with three-dimensional atomic force microscopy
Hagen Söngen,1, 2 Bernhard Reischl,3, 4 Kazuki Miyata,5 Ralf Bechstein,1 Paolo Raiteri,3, 6
Andrew L. Rohl,3 Julian D. Gale,3, 6 Takeshi Fukuma,5, 7 and Angelika Kühnle1, 8
1Institute of Physical Chemistry, Johannes Gutenberg University Mainz, Duesbergweg 10-14, 55099 Mainz, Germany 2Graduate School Materials Science in Mainz, Staudinger Weg 9, 55128, Germany∗
3Curtin Institute for Computation and Department of Chemistry, Curtin University, PO Box U1987, Perth, WA 6845, Australia 4now at: Institute for Atmospheric and Earth System Research / Physics,
Faculty of Science, P.O. Box 64, University of Helsinki, 00014 Finland. 5Division of Electrical Engineering and Computer Science,
Kanazawa University, Kanazawa 920-1192, Japan 6The Institute for Geoscience Research (TIGeR), Curtin University, PO Box U1987, Perth, WA 6845, Australia
7WPI Nano Life Science Institute (WPI-NanoLSI), Kanazawa University, Kanazawa 920-1192, Japan
8Physical Chemistry I, Bielefeld University, Universitätsstraÿe 25, 33615 Bielefeld, Germany†
It seems natural to assume that defects at mineral surfaces critically inuence interfacial processes such as the dissolution and growth of minerals in water. The experimental verication of this claim, however, is challenging and requires real-space methods with utmost spatial resolution, such as atomic force microscopy (AFM). While defects at mineralwater interfaces have been resolved in 2D AFM images before, the perturbation of the surrounding hydration structure has not yet been analyzed experimentally. In this letter, we demonstrate that point defects on the most stable and naturally abundant calcite(10.4) surface can be resolved using high-resolution 3D AFM even within the fth hydration layer. Our analysis of the hydration structure surrounding the point defect shows a perturbation of the hydration with a lateral extent of approximately one unit cell. These experimental results are corroborated by molecular dynamics simulations.
Defects have been suggested as the nucleus for disso-lution and growth processes on the calcite(10.4) surface
[1, 2]. Experimentally, Harstad and Stipp [2] have re-ported that even trace amounts of impurities present in natural calcite samples (such as Mg, Fe, Sr, Mn) inuence the dissolution of the calcite(10.4)surface. Moreover, in
a recent theoretical study, the substitution of Ca ions with similar divalent ions on the calcite (10.4) surface
has been found to signicantly alter the anity of water towards the surface [3]. As a consequence, trace amounts of defects can steer the competitive adsorption between water and organic molecules a highly relevant interplay in the eld of biomineralization [3].
Water at surface defects on calcite (10.4) has been
studied theoretically using density functional theory (DFT) by Lardge et al. [4]. The simulation system in-cluded the calcite surface with a carbonate vacancy, a calcium vacancy and a single water molecule. Compared to the at (10.4) terrace, the binding energy of water
at both defects has been found to increase (by 0.55 eV
and 0.65 eV for the carbonate and calcium vacancy,
re-spectively). Moreover, the water molecule was found to dissociate at carbonate vacancies, but not at calcium va-cancies.
A recent molecular dynamics (MD) study by Reischl et al. [5] has considered both bulk water instead of a single water molecule as well as the presence of a nanoscopic AFM tip. The authors have simulated both calcium and
carbonate vacancies as well as the substitution of a single Ca atom with a Mg atom. Two major results have been obtained [5]. First, the defects were found to be stable over the timescale of the simulations even though the vacancies carried a local charge of±2e. This behavior has
been observed both in the presence and in the absence of the AFM tip.
Second, at the calcium vacancy, the surrounding water structure has been found to be signicantly perturbed, while at the carbonate vacancy the distortion of the water structure was less pronounced. In case of the magnesium substitution, water has been found to be shifted closer to the surface (similar to the Mg ions on the dolomite surface presented in reference 6). Therefore, in all cases, defects inuence the water structure in their vicinity. For the three dierent types of defects that have been consid-ered, the lateral extent of the inuence on the hydration structure has been reported to be within the order of2×2
surface unit cells.
On the basis of these purely theoretical results, the au-thors raise the question of whether the predicted changes at the defect sites can be resolved by AFM? So far, sur-face defects at the calcitewater intersur-face have only been observed in 2D AFM experiments [7, 8]. In these studies, the observation of defects has been used to characterize the AFM tip only atomically sharp AFM tips image single atomic-scale features, such as point defects. How-ever, the defect itself and its hydration structure have
2
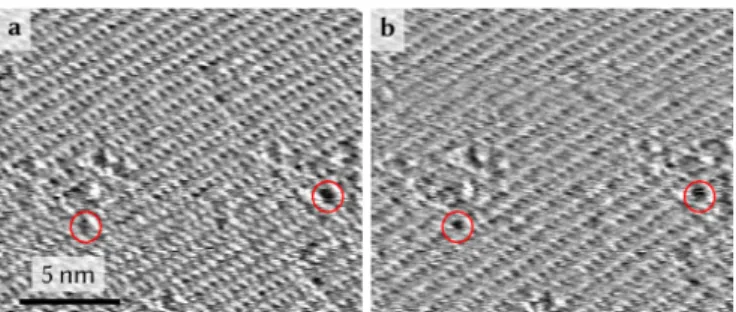
FIG. 1. AFM images of the atomically-resolved calcite(10.4) surface with defects. Panels a and b show two AFM images at the same sample position recorded with a time dierence of 2 min. Two red circles shown at equivalent positions in both images serve as a guide to the eye by showing the same defects, illustrating that the locations of the defects are xed. The data range in both images is 1 kHz-6 kHz. All images are trace-down images, the[421]direction points to the lower right corner.
not been the focus of these studies. In this letter, we present high-resolution 3D AFM experiments to assess the hydration structure in the vicinity of point defects at the calcitewater interface, which we compare to atom-istic simulations of calcite surfaces with point defects and AFM simulations with a model silica tip. We show that the defect detectably perturbs the hydration structure up until even the fth hydration layer. Therefore, we are able to answer the above question in the armative with 3D AFM, defects can indeed be resolved by their perturbation of the surrounding hydration structure.
Experiments were performed with a custom-built AFM [9, 10] using the 3D mapping technique, where the posi-tion of the oscillating AFM tip is addiposi-tionally modulated vertically [11]. Silicon cantilevers (AC55, Olympus) with a nominal spring constant of 85 N m−1 and an eigenfre-quencyνe of approximately1.2 MHzin water were used.
In most cases, the cantilevers were coated by an addi-tional layer of silicon (of approximately15 nmthickness)
by sputtering as described in reference 12. The excitation of the cantilever was performed with a photothermal ex-citation system [13, 14]. Amplitude and phase shift of the cantilever oscillation were detected by a commercial oscil-lation controller (OC4, Specs). The osciloscil-lation controller was operated in the frequency modulation (FM) mode, meaning that two feedback loops are employed to keep amplitude and phase shift constant by adjusting the exci-tation force amplitude and the exciexci-tation frequencyνexc,
respectively. The typical resolution of 3D datasets was
64×64 pixels laterally and 512 pixels vertically, with a
data acquisition time in the order of 2 min. According
to the solvent tip approximation [15, 16], maxima in the excitation frequency shiftνexc−νeare interpreted as
max-ima in the water density (as in reference 6). The crystal-lographic directions of the crystal have been determined from the birefringence [17].
Figures 1 a shows an atomically resolved excitation fre-quency shiftνexc−νe image of the (10.4)surface of
cal-cite. At various positions in the image, deviations from the periodic lattice of the calcite (10.4) surface can be
observed. In previous AFM works, similar atomic-scale inhomogeneities on the calcite surface have been assigned to point defects [7, 8, 18]. The measurements show that point defects on the surface of calcite(10.4)are present in
the sample. They can be observed with the experimental setup, which also means that an atomically-sharp tip has been used in this experiment.
Next, we assess whether the defects are located at xed positions or whether they are diusing, appearing or disappearing over the course of time. To this end, we recorded consecutive 2D images at a xed surface site. An image recorded2 minafter the image shown in
Fig-ure 1 a is shown in FigFig-ure 1 b [19] Several point defects are located at xed positions (e.g., the two defects marked by the red circles at identical positions in both images). Ob-serving the same deviation from the otherwise periodic calcite surface structure in consecutive images makes it highly unlikely that the deviation is an imaging artifact and thus conrms our assignment as a defect. Our obser-vation is consistent with the MD simulations by Reischl et al. [5] which indicate that calcium and carbonate vacan-cies, as well as magnesium substitutions, on calcite(10.4)
are stable, even in the presence of an AFM tip. Moreover, the presented data show that defects can be observed at least within a time that is similar to that taken to record a typical 3D dataset (which is in the order of2 min).
Next we performed 3D AFM mapping to resolve the local hydration structure surrounding the defect. Lateral slices of a 3D excitation frequency dataset extracted at dierentz-piezo displacements (corresponding to the
dif-ferent hydration layers) are presented in Figure 2. Note that we show unltered experimental raw data. The sur-face unit cell (rectangular overlay at the bottom right in Figure 2) of calcite(10.4) can be identied by the
pat-tern of minima and maxima. An inhomogeneity is visible in the center of the lateral slices (indicated by the arrow in layer 1). The deviation from the otherwise periodic structure was repeatedly observed in at least three scan lines. In contrast to randomly appearing imaging arti-facts such as noise, we expect this stability from a defect at a xed surface site. By analogy to the 2D images, we interpret this inhomogeneity as a point defect. Inter-estingly, the defect does not cause a major disruption of the hydration structure. Only a slightly enhanced con-trast (smaller or larger excitation frequency compared to equivalent sites) is visible at the defect site even within the fth hydration layer. Note that the defect appears at dierent positions within the various layers (as can be seen by using the unit cell marking as a xed reference). In the presented data, the deviation from the otherwise periodic pattern is only visible within an area that mea-sures one CaCO3 unit, i.e. half a calcite (10.4) surface
FIG. 2. Lateral slices of a 3D excitation frequency shift dataset showing a defect. The number in each panel indi-cates the hydration layer, in which the lateral slice has been extracted (the corresponding z-piezo displacement is shown
in gure 3). The color scale ranges from black (low) over or-ange to white (high). The lower right panel shows the atomic structure of the(10.4)surface unit cell along with a scale bar that applies to all panels.
unit cell. Considering the dierent noise present in the experimental data and in the MD simulation data, the lateral extent ts remarkably well with the MD simula-tion results. [5]
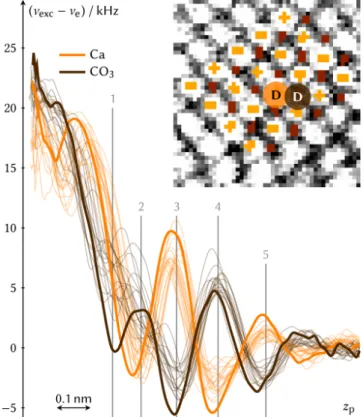
In Figure 3, we compare proles of the excitation fre-quency (as function of thez-piezo displacement) obtained
above defect and non-defect sites. Similar to previous works [6, 20], we assign proles with a minimum in the rst layer (brown curve) to a carbonate site, the other set of curves (yellow) to Ca sites [21]. The proles shown in Figure 3 are drawn using thin lines for the non-defective sites and with thick lines at the defect site (indicated by the arrow in Figure 2). The extraction sites are marked in the third layer (inset of Figure 3) by the yellow and brown circles, while the defect sites are additionally marked with
FIG. 3. Excitation frequency shift proles extracted above calcium ions (yellow) and carbonate groups (brown) at dier-ent sites. The extraction sites are shown in the inset. Proles extracted at the defect site (marked with D in the inset) are drawn as thick lines; all other proles are drawn as thin lines. The vertical lines (with numbers 15) indicate the tip-sample distance, at which the slices ae presented in gure 2 have been extracted.
D. To account for the nite size of the individual sites that are imaged, the proles are averages over multiple pixels as indicated by the shaded area around each site in the overlay. Given the small number of equivalent surface sites considered, we show all proles as individual curves. The curves extracted above the defect sites (drawn with thick lines) exhibit some minor, yet systematic, dier-ences compared to the non-defective sites (drawn using thin lines): The prole corresponding to the Ca defect site (yellow thick line) consistently exhibits the largest lo-cal maxima and the smallest lolo-cal minima in the fourth, third, and (with one exception) the second layer. This corresponds to the enhanced contrast visible at the defect site in Figure 2. Moreover, in the rst and second layer, the defect prole extracted above the Ca site is shifted closer to the surface compared to the other Ca proles. The other defect prole (corresponding to a carbonate site, thick brown line) shows a local minimum in the rst layer that is more pronounced compared to the non-defective proles. The experimental data show that point defects, indeed, causes a minute, yet detectable change in the hydration structure above calcite.
4 The magnitude of these perturbations is in good
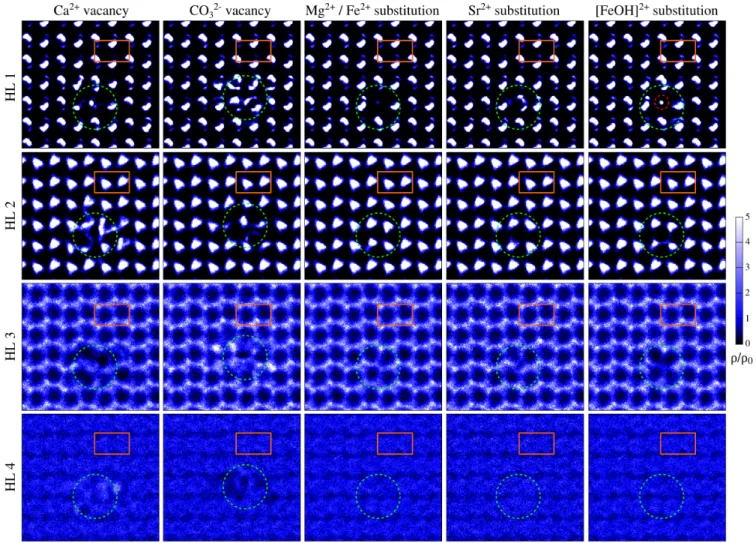
agree-ment with predictions from previous atomistic simula-tions of calcite surfaces with Ca and CO3 vacancies and Mg2+ (or Fe2+) substitutions [5] and additional simu-lations of two charge-neutral defects performed in this work, using the same methodology: a substitution of Ca2+with Sr2+, and with Fe3+, charge compensated by a OH−ion from solution. Details regarding the simulations are described in the rst section of the Supplementary Information and Supplementary Figure S1. The water density in the rst four hydration layers over the ve de-fect types is shown in Figure 4. All dede-fects considered are stable on the timescale of the simulation. One or two water molecules typically occupy the vacancies at any given time, with exchanges taking place on a nanosec-ond timescale and the hydration layer structure above the surface is more strongly perturbed compared to the charge neutral substitutions. Over the Mg2+/Fe2+ sub-stitution, the water molecule is at a lower position com-pared to Ca2+ in the perfect surface, whereas over Sr2+ the water molecule is higher, which is in good agreement with the radii of the rst solvation shell of Ca, Sr, and Mg ions in solution [22]. For the [FeOH]2+ substitution, the hydroxide oxygen atom is at a similar lateral posi-tion as the water oxygen over Ca in the perfect surface, but at a lower height. While we are not able to identify the defects seen in experiment directly from comparison with simulation, the lateral extent of the perturbation in the hydration structure is very similar. Moreover, AFM simulations with a model silica tip, on the ve defect types considered, conrm that there is a strong correla-tion between the changes in equilibrium hydracorrela-tion struc-ture above the defect, and the force acting on the AFM tip. This is shown in detail in the Supplementary Figures S2 and S3 as vertical and lateral slices and in Supple-mentary Figure S4 as proles. We further compare the solvent tip approximation with the force curves obtained by explicitly considering the tip in the simulations in the second section of the Supplementary Information and in the Supplementary Figure S5.
In summary, we investigated the hydration structure above point defects at the calcitewater interface. High-resolution 3D AFM maps show that the hydration struc-ture near point defects is perturbed both vertically as well as laterally. Vertically, the perturbation of the hy-dration structure due to the point defect is visible even in the fth hydration layer. The lateral extent of the perturbation is in the order of a single unit cell. Both ndings are in good agreement with MD simulations. To the best of our knowledge, this is the rst experimen-tal observation of the hydration structure in the vicinity of point defects with high-resolution 3D AFM in liquids. The ability to even resolve the hydration of point defects is an important milestone in the rapidly-growing eld of hydration layer mapping.
H.S. is grateful to the Japanese Society for the
Promo-tion of Science for funding a three-month research stay in Kanazawa. H.S. is a recipient of a DFG-funded position through the Excellence Initiative (DFG/GSC 266). B.R., P.R., A.L.R. and J.D.G thank the Australian Research Council for nancial support through the Discovery Pro-gramme (FT130100463, DP140101776). A.K. thanks the DFG for nancial support (KU1980/7-1). This work was supported by computational resources provided by the Australian Government and the Government of West-ern Australia through the Pawsey Supercomputing Cen-tre under the National Computational Merit Allocation Scheme.
REFERENCES
[1] A. S. Lea, J. E. Amonette, D. R. Baer, Y. Liang, and N. G. Colton, Geochim. Cosmochim. Acta 65, 369 (2001). [2] A. O. Harstad and S. L. S. Stipp, Geochim. Cosmochim.
Acta 71, 56 (2007).
[3] M. P. Andersson, K. Dideriksen, H. Sakuma, and S. L. S. Stipp, Sci. Rep. 6, 28854 (2016).
[4] J. S. Lardge, D. M. Duy, M. J. Gillan, and M. Watkins, J. Phys. Chem. C 114, 2664 (2010).
[5] B. Reischl, P. Raiteri, J. D. Gale, and A. L. Rohl, Phys. Rev. Lett. 117, 226101 (2016).
[6] H. Söngen, C. Marutschke, P. Spijker, E. Holmgren, I. Hermes, R. Bechstein, S. Klassen, J. Tracey, A. S. Fos-ter, and A. Kühnle, Langmuir 33, 125 (2017).
[7] F. Ohnesorge and G. Binnig, Science 260, 1451 (1993). [8] S. Rode, N. Oyabu, K. Kobayashi, H. Yamada, and
A. Kühnle, Langmuir 25, 2850 (2009).
[9] T. Fukuma, M. Kimura, K. Kobayashi, K. Matsushige, and H. Yamada, Rev. Sci. Instrum. 76, 053704 (2005). [10] T. Fukuma and S. P. Jarvis, Rev. Sci. Instrum. 77,
043701 (2006).
[11] T. Fukuma, Y. Ueda, S. Yoshioka, and H. Asakawa, Phys. Rev. Lett. 104, 016101 (2010).
[12] S. M. R. Akrami, H. Nakayachi, T. Watanabe-Nakayama, H. Asakawa, and T. Fukuma, Nanotechnology 25, 455701 (2014).
[13] T. Fukuma, Rev. Sci. Instrum. 80, 023707 (2009). [14] T. Fukuma, K. Onishi, N. Kobayashi, A. Matsuki, and
H. Asakawa, Nanotechnology 23, 135706 (2012). [15] M. Watkins and B. Reischl, J. Chem. Phys. 138, 154703
(2013).
[16] K.-i. Amano, K. Suzuki, T. Fukuma, O. Takahashi, and H. Onishi, J. Chem. Phys. 139, 224710 (2013).
[17] S. Kuhn, M. Kittelmann, Y. Sugimoto, M. Abe, A. Kühnle, and P. Rahe, Phys. Rev. B. 90, 195405 (2014).
[18] P. Rahe, J. Schütte, and A. Kühnle, J. Phys.: Condens. Matter 24, 084006 (2012).
[19] Care was taken to select a series of images that showed a stable (non-dissolving) terrace of the calcite surface
with-FIG. 4. Defect induced perturbation of the calcite hydration layer structure from simulation. Lateral slices through the time averaged water oxygen density at heights corresponding to the rst to fourth hydration layers (HL1-HL4) over surfaces with Ca2+and CO2−
3 vacancies as well as Mg
2+/Fe2+, Sr2+, and [FeOH]2+substitutions. A calcite surface unit cell dened by the
calcium ions is indicated by the orange rectangle. The position of the defect is at the center of the dashed green circles. The oxygen density peak originating from the hydroxide ion in HL1 over the Fe(III) ion is indicated by a dashed red circle. The [421]direction points to the right, the[010]direction points up.
out step edges. As AFM measurements are typically sub-ject to (non-linear) drift as well as piezo creep eects, two consecutive images do not necessarily show the exact same section of the sample surface. To align the images, the two-dimensional cross-correlation of two images was computed for each consecutive image pair. Consequently, each image was shifted by an oset given by the maxi-mum of the cross-correlation function.
[20] T. Fukuma, B. Reischl, N. Kobayashi, P. Spijker, F. F. Canova, K. Miyazawa, and A. S. Foster, Phys. Rev. B
92, 155412 (2015).
[21] The identication of carbonate and calcium ions is based on clearly identifying the rst hydration layer and fur-ther relies on interpreting the data as the water density (see reference 20). As it can be dicult to ensure that the rst observed layer in the 3D AFM data corresponds to the rst hydration layer, the assignment might be in-correct. Importantly, this would not aect the general interpretation and conclusion of this manuscript. [22] P. Raiteri, R. Demichelis, and J. D. Gale, J. Phys. Chem.