Table of Contents
1
PREFACE ... 1-1
2
RESOURCE PLAN NON-TECHNICAL SUMMARY ... 2-1
2.1 Load Forecast ... 2-1 2.2 Future Resource Needs ... 2-2 2.3 Resource Plan Development ... 2-3 2.4 Resource Alternatives ... 2-3 2.5 Preferred Resource Plan ... 2-4 2.6 Preferred Plan is in the Public Interest ... 2-7 2.7 Externality Values ... 2-11 2.8 Preferred Plan Rate Impacts ... 2-11 2.9 Five-Year Action Plan ... 2-12 2.10 Conclusion ... 2-133
CURRENT OUTLOOK ... 3-1
3.1 Big Stone Plant Air Quality Control System (“AQCS”) ... 3-1 3.2 Hoot Lake Plant MATS (Mercury and Air Toxics Standard) Upgrade ... 3-1 3.3 Coordination with Midcontinent ISO with regards to outage scheduling ... 3-1 3.4 Midcontinent ISO Module E Resource Adequacy Obligation ... 3-2 3.5 Market Conditions in the Midcontinent ISO ... 3-3 3.6 New EPA Emission Standards for Stationary Engines ... 3-3 3.7 Climate Change Legislation Uncertainty ... 3-3 3.8 Renewable Energy Objectives and Standards ... 3-4 3.9 2007 MN Legislature DSM and Conservation Requirements ... 3-4 3.10 Projected Load and Capability ... 3-44
PLAN DEVELOPMENT ... 4-1
4.1 Plan Objectives ... 4-1 4.2 Planning Tools ... 4-1 4.3 Planning Process ... 4-25
PREFERRED RESOURCE PLAN ... 5-1
5.1 Preferred Resource Plan Description ... 5-2 5.2 REO/RES Compliance ... 5-3 5.3 Load Growth Scenarios ... 5-7 5.4 Environmental Externality Scenarios ... 5-7 5.5 Emissions and Greenhouse Gas Reduction Goal ... 5-9 5.6 50% and 75% Conservation and Renewable Scenarios ... 5-11 5.7 Additional Sensitivity Scenarios ... 5-126
CONCLUSION ... 6-1
6.1 Preferred Plan is in the Public Interest ... 6-1 6.2 Socio-Economic Impacts of the Preferred Plan ... 6-1 6.3 Five-Year Action Plan ... 6-2List of Appendices
Appendix A: Plan Cross Reference and Checklist Appendix B: Electric Utility Report
Appendix C: Existing Resources Appendix D: Potential Resources
Appendix E: Assessment of Federal and State Environmental Regulation Appendix F: Assumptions for Strategist Modeling Scenarios
Appendix G: Otter Tail’s REO/RES Compliance Strategy Appendix H: Update on C-BED Progress
Appendix I: Integrated Resource Plan Sensitivity Summary Appendix J: Combined Heat and Power Evaluation
Appendix K: Distributed Renewable Generation Evaluation
List of Tables
Table 2-1: Summer 2014-2028 Base Case Projected Load and Capability Prior to Resource Plan Information ... 2-2 Table 2-2: List of Resource Alternatives Included in Strategist Model ... 2-3 Table 2-3: Preferred Resource Plan Summary ... 2-4 Table 2-4: Five-Year Action Plan Activities ... 2-13 Table 3-1: Summer 2014-2028 Load and Capability Prior to Preferred Plan Information ... 3-6 Table 5-1: Preferred Plan Resource Additions ... 5-1 Table 5-2: 50% and 75% Renewable and Conservation as Percent of Total New MN Energy Requirements ... 5-11 Table 6-1: Five-Year Action Plan Activities ... 6-2
List of Figures
Figure 2-1: Preferred Plan Capacity Resources and Reserve Obligation 2014-2028 (MW) ... 2-5 Figure 2-2: Preferred Plan Energy Resources and Requirements 2014-2028 (GWh) ... 2-5 Figure 2-3: 2012 Energy by Fuel Source ... 2-6 Figure 2-4: Preferred plan 2028 Energy by Fuel Source ... 2-6 Figure 2-5: Net Present Value of Revenue Requirements ($000) by Sensitivity ... 2-7 Figure 2-6: Energy Market On vs Energy Market Off Sensitivity PVRR Comparison ($000) ... 2-8 Figure 2-7: 2028 Load Duration Curve vs Company Resources ... 2-9 Figure 2-8: Energy Market On Capacity Resources and Reserve Obligation 2014-2028 ... 2-10 Figure 2-9: Energy Market Off Capacity Resources and Reserve Obligation 2014-2028 ... 2-10 Figure 2-10: Preferred Resource Plan Estimated Rate Impacts ... 2-12 Figure 2-11: Preferred Resource Plan Estimated Rate Impacts by Class ... 2-12 Figure 3-1: Historic and Forecast Unmanaged 50/50 Non-coincident Summer Peak Demand ... 3-5 Figure 3-2: Historic and Forecast Annual Retail Sales (Losses are not included) ... 3-5 Figure 3-3: Projected Summer Capacity Needs through 2028, by Calendar Year ... 3-6 Figure 5-1: 2014-2028 Capacity Resources and Reserve Obligation for Preferred Plan (MW) ... 5-1 Figure 5-2: 2014-2028 Energy Resources and Energy Requirements for Preferred Plan (MW) ... 5-2 Figure 5-3: Compliance with REO/RES Regulation in All Jurisdictions ... 5-3 Figure 5-4: Solar Sensitivities – PVRR impact ... 5-4 Figure 5-5: RES Resource Cost Compared to Average Market Costs ... 5-5 Figure 5-6: Estimated RES impact on Average Retail Rates ... 5-6 Figure 5-7: Load Growth Sensitivities – PVRR impact ... 5-7 Figure 5-8: Externality Application – PVRR impact ... 5-8 Figure 5-9: SO2 and NOx Emissions ... 5-9
Figure 5-10: CO2 Emissions ... 5-9
Figure 5-11: Mercury Emissions ... 5-10 Figure 5-12: Preferred Plan CO2 Emissions and the CO2 reduction Goal ... 5-10
Figure 5-13: Comparison of Net Present Value of Revenue Requirements for All Sensitivities ... 5-12
1
Preface
Otter Tail Power Company (“Otter Tail” or “Company”) respectfully files this resource plan with the Minnesota Public Utilities Commission (“Commission”) for approval under Minnesota Statute
§216B.2422 and Minnesota Rules Part 7843. The plan presented in this filing identifies the anticipated demand and energy needs of the Company's customers and details specific action items that Otter Tail intends to complete within the first five years of the planning period, as well as potential resources that might be used in the following 10 years.
This resource plan is intended to identify the Company's likely courses of action that are designed to meet the requirements of the statutes and rules, satisfy the Commission's goals in implementing its
responsibilities, and allow the Company to continue providing reliable, low-cost electricity to meet the service requirements and the desires of customers, while minimizing potential adverse environmental and socio-economic impacts in an increasingly competitive industry. Considerable unknowns and variables, outside of Otter Tail’s control, will impact the actual resources the Company selects and implements in the future. Any long-range plan is subject to change because it represents an optimal plan based on numerous forecasts and assumptions at a specific point in time.
This resource plan may be one of the most straight-forward resource plans that the Commission has recently reviewed. No new resources are proposed for addition during the first five years of the plan. In the period after the first five years, the only questions are those regarding the specific type and timing of resources to replace Hoot Lake Plant and expiring capacity purchase contracts. As is detailed in this plan, a natural gas resource is the first resource selected in almost all of the 78 Strategist runs submitted in this plan. The timing (2019 -2021), type (simple-cycle vs. combined-cycle), and size of the natural gas resource are the only attributes that vary among the different Strategist runs. While it may be useful to discuss and consider the attributes of this resource in this plan proceeding, because this addition occurs several years into the future, the specific timing, type, and size of the gas addition can be better addressed in the Company’s next resource plan, which will likely be filed in mid-2016.
Since the 2010 resource plan and the subsequent Baseload Diversification Study, Otter Tail has added 62.4 MW of wind generation and entered into a capacity-only PPA for Midcontinent Independent System Operator (“Midcontinent ISO”) Zone 1 capacity that will cover Otter Tail’s capacity needs until June 2021. In addition, the Company has included in this plan an energy efficiency goal of 1.5 percent to meet Minnesota state mandates, which is an increase from 1.2 percent included in Otter Tail’s previous resource plan.
To prepare for the studies that form the foundation for this resource plan, the Company convened a stakeholder group meeting in St. Paul on September 26, 2013. Each party who was actively involved in the Baseload Diversification Study also participated in this meeting. At this stakeholder meeting, no participant objected to the assumptions being used in the modelling, and meeting participants requested several new sensitivity runs, which were incorporated in the Strategist modeling. Consequently, Otter Tail believes it has developed a resource plan that addresses the concerns of stakeholders.
Details of the underlying assumptions and descriptions of significant components, activities and issues associated with this resource plan are documented within the appendices to this filing.
2
Resource Plan Non-Technical Summary
The plan identifies the anticipated electric service needs of the Company's customers for the 2014-2028 planning period. The plan details specific action items that Otter Tail intends to complete within the first five years of the planning period.
In its Order concerning Otter Tail's initial resource plan filing in 1992, the Commission stated that it considers the characteristics of the available resource options and the proposed plan as a whole. In Minnesota Administrative Rules, Chapter 7843.0500, Subp.3, it states that “Resource options and resource plans must be evaluated on their ability to:
A. maintain or improve the adequacy and reliability of utility service.
B. keep the customer's bills and the utility's rates as low as practicable, given regulatory and other constraints.
C. minimize adverse socio-economic effects and adverse effects upon the environment. D. enhance the utility's ability to respond to changes in the financial, social, and technological
factors affecting its operations.
E. limit the risk of adverse effects on the utility and its customers from financial, social, and technological factors that the utility cannot control.”
Otter Tail has worked diligently to keep these objectives in mind while developing this resource plan. Otter Tail continues to make existing facilities as efficient and economical as is cost-effective. These efforts should help to maintain low rates and customer bills, reduce the financial risks of future
environmental regulation or taxes, reduce environmental effects, and keep the Company well positioned to respond to change. This resource plan provides a blend of supply-side and demand-side resource options to meet customer needs that cannot be met with existing resources.
2.1
Load Forecast
The process of developing this resource plan began with an econometric peak demand and energy requirements forecast, which provided base forecast, low forecast, and high forecast scenarios.
The forecast peak demand and energy requirements are detailed in Appendix B. The energy requirements forecast represents an approximate 1.5 percent average annual growth rate, prior to new demand side management (“DSM”) programs, and is the key component in determining the type of capacity resources to be added, whether baseload, intermediate, or peaking. Peak demands are anticipated to average an annual growth rate of 1.8 percent in the summer, prior to new DSM programs. The peak demand will determine the size of capacity resources required for the system. As a participant in the Midcontinent ISO, Otter Tail is currently required to maintain a 6.2 percent planning reserve margin on the forecasted summer peak demand coincident with the Midcontinent ISO’s peak demand, after accounting for plant accreditation ratings as defined by the Midcontinent ISO.
2.2
Future Resource Needs
Table 2-1 provides the Company’s summer season resource needs showing the Company’s projected load and capability according to Midcontinent ISO Module E rules for resource adequacy. Please see Section 3 for discussion of Midcontinent ISO Module E and further detail regarding the resource adequacy obligation calculation. 1
The 50th percentile demand forecast is adjusted for accredited demand response capability, and a 6.2 percent planning reserve margin is calculated on this net demand forecast to determine the expected reserve obligation. The total accredited capacities, shown as Zonal Resource Credits (“ZRCs”), represent the Midcontinent ISO’s capacity ratings for the Company’s resources based on the 2013 planning year accreditation levels (including wind resource capacity credit as ordered in Otter Tail’s 2010 resource plan). Aggregate ZRCs are the accreditation of those resources that have deliverability anywhere within the Midcontinent ISO footprint. Local ZRCs are the accreditation of those resources that are Behind-the-Meter-Generation, or locally deliverable to the Company’s load. Capacities for transactions are shown separately. Resource, transaction, and demand response accreditations are based on historical summer performance and do not vary monthly.
Table 2-1: Summer 2014-2028 Base Case Projected Load and Capability Prior to Resource Plan Information
The data in the tables illustrates the capacity deficits that exist prior to plan development, based on the Company’s existing resources as of December 1, 2013. The table shows that Otter Tail is capacity deficient beginning in the summer of 2021 when Hoot Lake Plant is retired and power purchase
agreements (“PPAs”) expire and that the deficiency grows from that point throughout the study period as demand continues to grow.
1 The Module E resource adequacy obligation calculation is:
Reserve Obligation = (Coincident Peak Demand Forecast-Demand Response) x (1+Load Based Reserve Margin) + Transmission Losses, where the reserve margin is currently 6.2 percent. Total Accredited Capacity is the sum of Aggregate ZRCs, Local ZRCs, External ZRC’s and Net Transaction ZRCs, where ZRCs are MWs that have been converted to “Zonal Resource Credits.” Under Module E, only ZRCs are eligible for designation toward the Reserve Obligation.
Planning Year Coincident 50/50 Forecasted Demand (MW) Accredited Demand Response (MW) Planning Reserve Margin (6.2%) Transmission Losses Reserve Obligation Net of Accredited Demand Response (MW) Aggregate Capacity (ZRCs) Local Capacity (ZRCs) External Capacity (ZRCs) Net Transaction Capacity (ZRCs) Total Accredited Capacity (ZRCs) Projected Summer Deficiency (-MW) 2014 603.6 -26.0 35.8 28.2 641.6 608.5 64.8 4.5 100.0 777.8 136.2 2015 628.5 -30.0 37.1 29.2 664.8 608.5 64.8 4.5 100.0 777.8 113.0 2016 657.0 -41.0 38.2 30.1 684.2 608.5 64.8 4.5 100.0 777.8 93.6 2017 658.5 -39.0 38.4 30.2 688.2 608.5 64.8 4.5 25.0 702.8 14.6 2018 664.7 -39.0 38.8 30.5 695.1 608.5 64.8 4.5 25.0 702.8 7.7 2019 687.2 -43.0 39.9 31.4 715.6 608.5 64.8 4.5 50.0 727.8 12.2 2020 695.4 -43.0 40.4 31.8 724.7 608.5 64.8 4.5 50.0 727.8 3.1 2021 708.2 -50.0 40.8 32.1 731.1 473.1 64.8 4.5 0.0 542.4 -188.7 2022 722.9 -51.0 41.7 32.8 746.4 473.1 64.8 4.5 0.0 542.4 -204.0 2023 730.5 -51.0 42.1 33.2 754.8 473.1 64.8 4.5 0.0 542.4 -212.4 2024 738.2 -51.0 42.6 33.5 763.4 473.1 64.8 4.5 0.0 542.4 -221.0 2025 746.0 -51.0 43.1 33.9 772.0 473.1 64.8 4.5 0.0 542.4 -229.6 2026 754.0 -56.0 43.3 34.1 775.3 473.1 64.8 4.5 0.0 542.4 -232.9 2027 762.0 -56.0 43.8 34.5 784.3 473.1 64.8 4.5 0.0 542.4 -241.9 2028 770.2 -56.0 44.3 34.9 793.4 473.1 64.8 4.5 0.0 542.4 -251.0
2.3
Resource Plan Development
The software model used for developing Otter Tail’s resource plan is Strategist. The long-range peak demand and energy forecasts are incorporated into the Strategist database, along with the supply-side and demand-side resource alternatives available to the Company over the course of the study period.
Strategist was then executed to develop a series of least-cost resource plans. Otter Tail defined the objective function as minimizing total revenue requirements or total societal costs.
The Proview module within Strategist was executed to develop an optimized resource plan for each scenario for the time period 2014 through 2028. Resource plans were developed in accordance with the resource planning rules, including evaluation of scenarios that varied load growth, applied externalities, and achieved specified renewable and conservation objectives.
2.4
Resource Alternatives
Otter Tail considers both demand-side and supply-side resources in long-term planning analysis.
Appendix D provides a more detailed discussion of the resources that the Company evaluated. Table 2-2 provides a list of the alternatives evaluated.
Table 2-2: List of Resource Alternatives Included in Strategist Model
Re source Alternatives Mode le d De scription
Natural Gas Combined Cycle Generic 311 MW nameplate capacity frame type
combined cycle unit
Natural Gas Simple Cycle - Small Generic 49 MW nameplate capacity Aeroderivitive
type simple cycle unit
Natural Gas Simple Cycle - Medium Generic 101 MW nameplate capacity Aeroderivitive
type simple cycle unit
Natural Gas Simple Cycle - Large Generic 211 MW nameplate capacity frame type
simple cycle unit
Natural Gas Combined Heat/Power Generic 96 MW nameplate capacity frame type
combined cycle unit
Natural Gas conversion of Hoot Lake units 2 and 3 122 MW nameplate capacity conversion of units 2 and 3 at Hoot Lake plant from coal to natural gas
Solar Photovoltaic Generic 1 MW nameplate capacity utility-scale solar
photovoltaic resource
Wind Generic 50 MW nameplate capacity utility-scale wind
resource
Conservation 1.5% energy efficiency/conservation resource (MN
load only)
Load Control (DSM) 15 MW of additional load control by the end of the 15
2.5
Preferred Resource Plan
The Company’s preferred resource plan (Energy Market On sensitivity 22 from Appendix I) as developed by the Strategist Proview optimization analysis calls for the addition of a 211 MW simple cycle frame unit in 2021 as shown in Table 2-3. The preferred resource plan is the least cost plan developed by the Strategist model without the consideration of environmental externalities, CO2 values,
or other proposed environmental regulation and using base case assumptions for load growth, fuel prices (natural gas and coal), solar, wind, market energy prices, capacity prices, and capital costs. The preferred plan is expected to cost $3.376B, a net present value in 2014$ of revenue requirements (“NPVRR”). The preferred plan uses the 1.5 percent CIP energy goal in Minnesota and 15 MW of new incremental summer demand response by 2028.
Table 2-3: Preferred Resource Plan Summary
Resource Plan (MW) - Based on Nameplate ratings
2014 2015 2016 2017 2018 2019 2020
2021 211 MW frame NG CT Commercial Operation of frame, natural gas-fired, simple cycle
combustion turbine. 2022 2023 2024 2025 2026 2027 2028
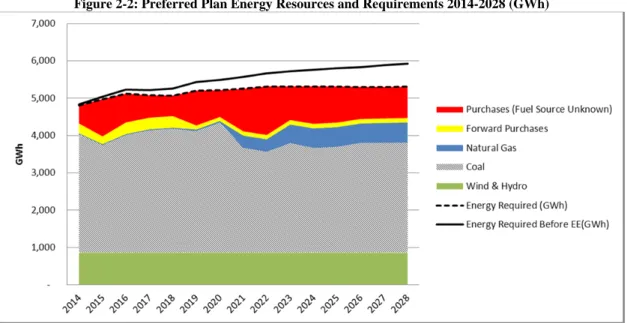
Figure 2-1 shows the capacity resource addition along with existing resources over the study period and Figure 2-2 shows the energy contribution by fuel category for 2014-2028 under the preferred plan. In Figure 2-2, the Purchases category (red) is primarily comprised of day-ahead market opportunity
purchases, while the Forward Purchases (yellow) represents longer term bi-lateral contractual purchases.
Figure 2-1: Preferred Plan Capacity Resources and Reserve Obligation 2014-2028 (MW)
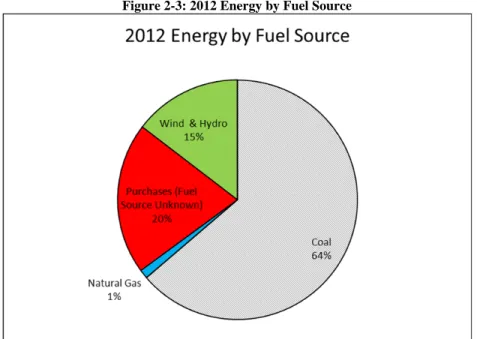
Figure 2-3 shows the current energy contribution by fuel category for the year 2012. Figure 2-4 shows the expected energy contribution by fuel category for the preferred plan for the year 2028. The preferred plan shows a reduction in percentage of coal energy and market purchases and an increase in the percentage of energy from natural gas and renewable energy.
Figure 2-3: 2012 Energy by Fuel Source
2.6
Preferred Plan is in the Public Interest
Otter Tail Power Company is committed to operating its generation facilities as efficiently as practicable while minimizing adverse effects on the environment. New resources have been selected that will meet the Company’s needs while maintaining flexibility and limiting the risk of exposure to changes in financial, social, and technological factors beyond its control. With no resource additions during the initial five-year period, the plan maintains flexibility during a period of much uncertainty including recession impacts and rebound, climate change proposals, and other factors that can have a material impact on the industry. In addition, customers will be provided with more opportunities to improve their energy efficiency. This resource plan satisfies the legal and regulatory requirements in the multi-state service territory and allows Otter Tail and its customers to realize the benefits of operating as a single system while satisfying requirements in all states served by Otter Tail.
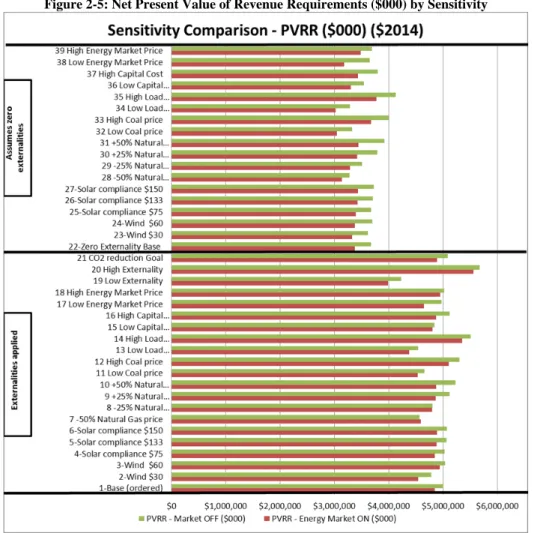
Figure 2-5 shows a summary of the Net Present Value of Revenue Requirements for all sensitivities evaluated for this resource plan.
Otter Tail uses two scenarios related to interaction with the energy market in this resource plan. The Energy Market Off scenario turns the energy market opportunity purchases off after five years as required by the Commission’s Order in Otter Tail’s last resource plan (Docket No. E017/RP-10-623). The Energy Market On scenario allows energy market opportunity purchases throughout the study period. This plan evaluates 39 sensitivities for each scenario, a total of 78 sensitivities. The Company believes that the Energy Market On scenarios more accurately reflect the current operations and interactions with the energy market while providing significant benefit to our customers. Figure 2-6 displays the difference in the Net Present Value of Revenue Requirements of the Energy Market On and Energy Market Off for each sensitivity. Only 1 of the 39 sensitivities shows the Energy Market Off as favorable to Energy Market On.
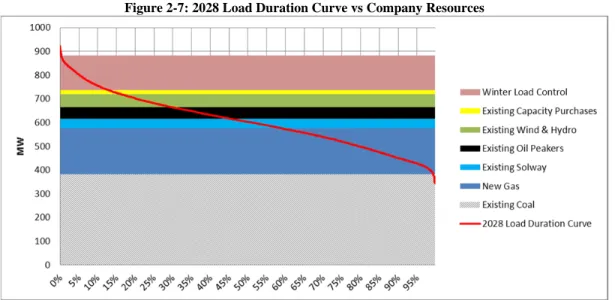
Market energy opportunity purchases should not be considered market reliance because market
opportunity purchases would occur when market energy prices are more favorable to the customer than running an Otter Tail-owned facility. Figure 2-7 shows the expected load duration curve for the year 2028 compared to the resources planned for that year. The resources could be considered a “price backstop”, in which the resource would run when the variable cost of the resource (fuel and variable operations & maintenance expenses) is less than the market energy price.
Figure 2-7: 2028 Load Duration Curve vs Company Resources
In the Energy Market Off scenarios, a capacity build takes place in 2019, the year the energy market is turned off. The capacity build is in excess of the planned capacity reserve requirements. Figure 2-8 displays the capacity expansion for the Energy Market On scenario (Energy Market On 22 from Appendix I). Figure 2-9 displays the capacity expansion plan for the Energy Market Off scenario, depicting the excess capacity build in the year 2019 (Energy Market Off 22 from Appendix I). The increase in PVRR for the figures displayed was over $301 million. For all 39 sensitivities, the average increase in PVRR of the Energy Market Off scenarios compared to the Energy Market On scenarios was over $230 million.
Figure 2-8: Energy Market On Capacity Resources and Reserve Obligation 2014-2028
Figure 2-9: Energy Market Off Capacity Resources and Reserve Obligation 2014-2028
This resource plan satisfies all rules and requirements of the Minnesota statutes and rules, provides a clear concise report to interested parties of how Otter Tail will satisfy customer needs in the near term, and identifies the resources the Company is considering for viable options for the long term.
The preferred resource plan represents the most economic plan developed with a model that successfully integrates demand-side and supply-side resource analysis. Otter Tail serves customers in three states. To provide operating efficiencies, the Company operates and plans its system as a single entity to the benefit of all customers. Maintaining compliance with the many statutes, rules, and regulations in three separate states and three separate regulatory commissions can be challenging at times. Otter Tail believes that this resource plan meets that challenge, successfully providing a plan that reasonably satisfies the needs of all three states.
In compliance with Minnesota Statutes, the Company evaluated low (2 sensitivities), mid (38
sensitivities), and high (2 sensitivities) externality sensitivities for this resource plan and as defined by the Commission’s June 5, 2013, Notice of Updated Environmental Externality Values. Each externality case also assumed a CO2 tax starting in 2017 and escalating annually. In addition to the externality
sensitivities, the Company evaluated 36 sensitivities with zero externalities.
Minnesota Stat. §216B.2422 also requires evaluation of the resource plan for low and high load growth sensitivities and for sensitivities that evaluate meeting 50 percent and 75 percent of future resource needs using demand side management and renewable resources. Like the externality sensitivities, the load growth sensitivities also varied from the preferred plan in total cost and resource selection. The Company plans for the most likely forecast, recognizing that this plan can adapt as time progresses to accommodate variations in actual load growth from the present long-range forecast. The preferred plan meets 65 percent of new energy requirements for Minnesota customers using renewable resources and energy efficiency and conservation.
2.7
Externality Values
Two dockets relating to externality values are open in Minnesota. Docket No. E999/CI-13-796, deals with the estimate of the costs of future carbon regulation. In Docket No. E999/CI-00-1636 a motion is pending before the Commission which requests an update to environmental cost values. Neither of these
proceedings will be completed in time for Otter Tail to incorporate the results into its 2013 resource plan. The company does not anticipate that these proceedings would have an impact on the five year action plan since the preferred plan does not call for any resource additions in the first five years of the planning period. The outcome of the above listed proceedings would be incorporated in future resource plans.
2.8
Preferred Plan Rate Impacts
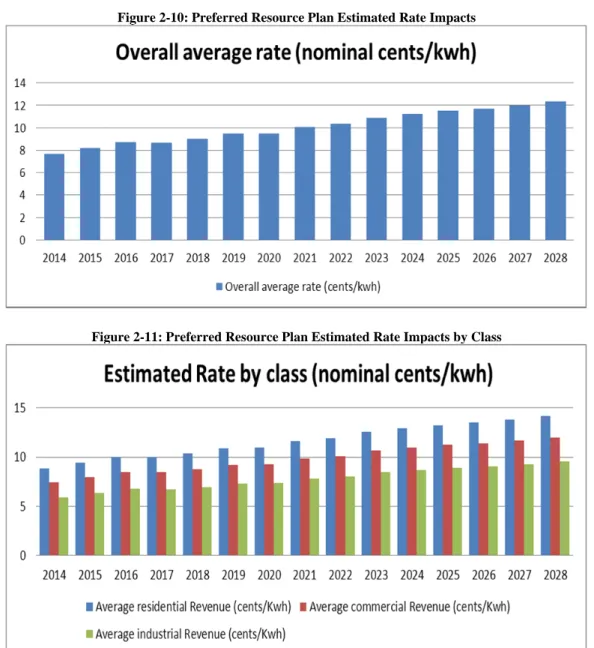
Figure 2-10 shows the potential estimated overall rate impact of the preferred resource plan. The data shown is the average annual rate based on the Strategist model for the total system and represents total revenue divided by total sales. Figure 2-11 shows the potential estimated rate impacts of the preferred resource plan by customer class. A number of parameters in the operation of the model will impact rates. The Strategist model assumes automatic rate increases each year to meet the targeted rate of return; but in reality, rate cases take place as needed and have an inherent amount of regulatory and administrative lag. The Strategist model rate impact calculation has taken into account the generation additions in the preferred plan. But it does not include all projected capital expenditures, asset based sales, or projected CO2 costs.
Figure 2-10: Preferred Resource Plan Estimated Rate Impacts
Figure 2-11: Preferred Resource Plan Estimated Rate Impacts by Class
2.9
Five-Year Action Plan
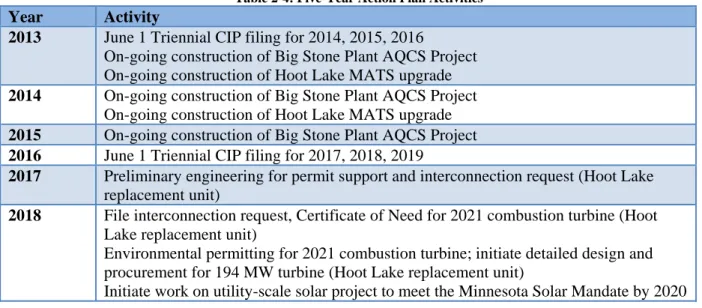
Table 2-4 identifies specific major items that require action in the first five years of the planning period. The five-year action plan is for the years 2014-2018; however, the action items in 2013 also are provided. As shown, the major construction activities for the Big Stone Plant AQCS project and the Hoot Lake Plant MATS upgrade comprise a large portion of the five-year action plan. In 2017, the company likely will begin preliminary engineering for the planned resource addition to be operational in 2021.
Table 2-4: Five-Year Action Plan Activities
Year Activity
2013 June 1 Triennial CIP filing for 2014, 2015, 2016
On-going construction of Big Stone Plant AQCS Project On-going construction of Hoot Lake MATS upgrade
2014 On-going construction of Big Stone Plant AQCS Project
On-going construction of Hoot Lake MATS upgrade
2015 On-going construction of Big Stone Plant AQCS Project
2016 June 1 Triennial CIP filing for 2017, 2018, 2019
2017 Preliminary engineering for permit support and interconnection request (Hoot Lake replacement unit)
2018 File interconnection request, Certificate of Need for 2021 combustion turbine (Hoot Lake replacement unit)
Environmental permitting for 2021 combustion turbine; initiate detailed design and procurement for 194 MW turbine (Hoot Lake replacement unit)
Initiate work on utility-scale solar project to meet the Minnesota Solar Mandate by 2020
2.10
Conclusion
Otter Tail Power Company has continued to optimize existing resources and obtain supplemental capacity and energy through the wholesale market to meet both customer needs and resource adequacy
requirements. This strategy will continue while balancing risk and economics. Cost-effective energy efficiency and demand response is used throughout the study period. The majority of the 78 Sensitivities show no new generation resource additions during the first five years. In the 2014-16 time period, construction on the Big Stone Plant Air Quality Control System (“AQCS”) takes place. During 2014, construction on the precipitator upgrades and activated carbon injection system at Hoot Lake Plant Units No. 2 and No. 3 will be completed a full year in advance of the MATS requirement. The preferred resource plan presented here accomplishes the goal of meeting customer needs in the three jurisdictions that Otter Tail serves.
3
Current Outlook
The following underlined list provides a brief overview of the most prevalent changes that have occurred since the 2010 resource plan filing and the subsequent Baseload Diversification Study. These changes include both regulatory and economic factors that have had very tangible effects on the Company’s current outlook.
3.1
Big Stone Plant Air Quality Control System (AQCS)
The AQCS project at Big Stone Plant is well underway. Engineering is 75 percent complete and ahead of schedule per the tracking index. The project’s cumulative cash flow through September 2013 is
$109,225,839 (27 percent) out of a total project budget of $405,175,000. Of the equipment, construction and service contracts, 27 out of 31 have been awarded. The total value of these contracts is
$284,183,046. The foundations are nearly complete. The structural steel for the scrubber and baghouse, as well as the selective catalytic reduction system is being erected. The project remains on-track for cutover to the Big Stone Plant in 2015, with startup and testing to follow. See Appendix L for photographs of progress on the Big Stone AQCS Project.
3.2
Hoot Lake Plant MATS (Mercury and Air Toxics Standard) Upgrade
The MATS Upgrade project also is on schedule. The Activated Carbon Injection (“ACI”) system is being installed and the ACI silo has been set on the foundation. The components for the electrostatic
precipitator (“ESP”) upgrade are being fabricated in Cleveland, Ohio. The new transformer/rectifier sets are on order for shipping to the site in early 2014. The Hoot Lake maintenance outage for installation of the ESP components is scheduled for April/May 2014. Beginning in June 2014, testing will begin and the system will be operational for the MATS compliance deadline of April 2015. The current projected final cost of the project remains at $8,600,000. See Appendix L for photographs of progress on the Hoot Lake Plant MATS Project.
The Hoot Lake Plant replacement is the main focus of the current resource plan. Strategist modeling runs show new gas generation being added in 2019 in the Energy Market Off sensitivities or 2021 in the Energy Market On sensitivities. The replacement in the majority of the sensitivities is a large simple-cycle combustion turbine. Permitting would begin about four years in advance of the commercial operation date.
3.3
Coordination with Midcontinent ISO with regards to outage scheduling
All outages are scheduled with the Midcontinent ISO. The Company has communicated with the Midcontinent ISO well in advance for the planned outage at Hoot Lake to install the MATS upgrade, as well as the planned outage at Big Stone Plant to install the AQCS. No potential reliability issues have been brought forward by Midcontinent ISO or are anticipated by the Company.
3.4
Midcontinent ISO Module E Resource Adequacy Obligation
Beginning in June 2013 the Midcontinent ISO revised its resource adequacy construct. The revisions included changing from a monthly construct based on non-coincident peak demand to an annual construct based on the Midcontinent ISO’s coincident peak demand. In addition, the Midcontinent ISO created seven capacity pricing zones to ensure capacity and transmission investments are made in the right places. The change from a non-coincident construct to a summer coincident construct reduced the Company’s reserve obligation. The Company’s customer peak demand is lower in the summer than in the winter, which is offset in part by the loss of winter demand response resources under the revised construct. The Company’s coincident peak demand diversity factor is approximately 8 percent of its non-coincident peak demand. For modeling purposes, Otter Tail used a zero cost capacity transaction within Strategist to reflect the impact of the coincident peak demand on reserve requirements.
The Midcontinent ISO’s planning year 2013 resource adequacy reserve obligation is 14.2 percent. The 14.2 percent reserve obligation under Module E is implemented through two components: a load-based reserve margin (planning reserve margin) and generation accreditation. For the 2013 planning year, the planning reserve margin applied to the load forecast is 6.2 percent. For every MW of forecasted peak demand, net of accredited demand response, the Company must provide 1.062 MW of accredited
capability. For the 2013 planning year, the Company’s aggregate equivalent forced outage rate is roughly 5.9 percent. Otter Tail’s generators are accredited based on historical plant performance. Each resource’s historical performance data is used to calculate a probability that it will be available to operate when called upon. The probability is applied to the resource’s demonstrated capability under defined conditions and lowers the accreditation of that resource from its demonstrated capability. Because the accreditation of resources is specific to each market participant and each resource, the effective reserve margin for each market participant can vary. Module E rules result in an effective reserve obligation specific to Otter Tail that is lower than the 14.2 percent regional reserve obligation due to the
accreditations of the Company’s units. Otter Tail’s effective reserve obligation is closer to 12.1 percent for the 2013 planning year. This 12.1 percent is comprised of the 6.2 percent planning reserve margin on the peak demand forecast and an estimated aggregate equivalent forced outage rate of roughly 5.9 percent applied to the generation resources, excluding wind. The Module E resource adequacy construct provides incentive to improve plant performance and availability to maximize generator accreditation under Module E.
Resource accreditations change annually and are based on summer ratings. As stated previously, ratings for generators are based on historic generator availability data or, if that is unavailable, class averages.
Wind generation is accredited based on unit specific historical capacity factors. Accreditation for the 2013 planning year for the Company’s wind farms varied from 27 percent at the Luverne Wind Farm to 15 percent at the Edgeley Wind Farm.
Otter Tail has successfully registered the load management system and retail firm service level contracts under Module E as Demand Resources. The accredited capability of these resources is subtracted from the Company’s forecast demand prior to calculating the planning reserve margin. Otter Tail’s accredited Demand Resources for planning year 2013 totaled 30 MW. This accreditation is based on its summer capability, which is when Midcontinent ISO experiences its annual peak demand.
3.5
Market Conditions in the Midcontinent ISO
Otter Tail has added 62.4MW of additional wind capability to its resource mix since 2010. The Midcontinent ISO continues to see even more wind resources in the region. Additional projects are moving forward to take advantage of the soon to expire Production Tax Credit (“PTC”). Wholesale energy prices remain low following the economic recession, and also due to the increasing penetration of wind generation, and continuing low natural gas prices. Annual average Locational Marginal Prices (“LMP”) at the OTP.OTP load zone in the day-ahead market remain low:
2010: $28.00/MWh 2011: $24.80/MWh 2012: $23.84/MWh
2013 (YTD September 30): $27.33/MWh
Capacity values in the Midcontinent ISO centralized market have remained at or near zero since 2010 due to excess reserves. However, due to pending coal plant retirements as we approach the compliance deadline for the Mercury and Air Toxics Standards (“MATS”), reserve margins likely will tighten. The forward capacity market has seen significant upward pressure as these uncertainties weigh on market participants. The Midcontinent ISO has recently projected the possibility of capacity shortfalls ranging from 3GW to 7GW starting in 2016. Otter Tail Power Company was able to purchase capacity to fulfill its currently anticipated capacity requirements through May 2021 at prices well below the cost of new construction.
3.6
New EPA Emission Standards for Stationary Engines
On March 3, 2010 the U.S. Environmental Protection Agency issued new national emission standards for hazardous air pollutants for existing stationary compression ignition reciprocating internal combustion engines with a compliance date of May 3, 2013. The new standards include varying combinations of emissions limitations, operating limitations, maintenance requirements, performance tests, recordkeeping requirements, and reporting requirements depending on the size and use of the engine. Otter Tail
currently contracts for roughly 7.5 MW of accredited capacity with customers who own generators that are impacted by these standards. Otter Tail also owns several small units, totaling about 4 MW, affected by the rule. The rule in its current form allows us to continue to use customer-owned and company-owned engines as we have in the past. However, several parties are challenged to prohibit the use of engines for demand-response programs unless expensive emissions control equipment is installed. Should the challengers be successful, it may not be economical for engines to continue participating in the accreditation program. For now, the Company is assuming this capacity will be available in the future.
3.7
Climate Change Legislation Uncertainty
The Minnesota legislature has a state CO2 reduction goal of 15 percent by 2015, 30 percent by 2025, and 80
percent by 2050. The Minnesota Commission uses a CO2 value of $9-$34 per ton for evaluation of all
future resource additions. There is currently no federal climate change legislation. The Environmental Protection Agency issued an endangerment finding on December 7, 2009, that paves the way for regulation of greenhouse gases under the existing Clean Air Act, regardless of whether Congress takes action.
3.8
Renewable Energy Objectives and Standards
Otter Tail was required to make a good faith effort to comply with the state REO through 2011. In 2012 the requirement switched to an RES. To date the Company has met the REO and RES targets. The state requirements2 increase in a step-wise fashion, consisting of:
2007 – 1% of retail sales
2010 – 7% of retail sales
2012 – 12% of retail sales
2016 – 17% of retail sales
2020 – 21.5% of retail sales (1.5% from solar resources)
2025 – 26.5% of retail sales (1.5% from solar resources).
The Company is also obligated to meet an REO beginning in 2015 in both North Dakota and South Dakota to generate or procure 10 percent of annual retail sales from renewable or recycled energy. Otter Tail has joined the Midwest Renewable Energy Tracking System (“M-RETS”) and uses this system to track and report compliance with REO and RES targets.
3.9
DSM and Conservation Requirements
The 2007 Next Generation Energy Act of 2007 established an ambitious goal for all Minnesota electric and natural gas utilities of achieving energy savings equal to 1.0 percent of retail energy sales. In 2013, the energy savings goal was modified to an annual goal of 1.5 percent of retail energy sales. The goal is based on a rolling three-year average of weather normalized historical retail sales. (Minnesota Statute §216B.241, Subd. 1c). On June 1, 2013, the Company made its 2014-2016 Minnesota CIP Triennial filing with the Minnesota Office of Energy Security. The plan as filed complied with all regulatory requirements, including a minimum of 1.5 percent energy savings. This resource plan reflects the 1.5 percent annual energy savings goal as filed in the Minnesota CIP Triennial filing.
3.10
Projected Load and Capability
Appendix B provides Otter Tail’s Annual Electric Utility Report, which includes Otter Tail’s forecast in detail. Figure 3-1 below shows the historical and projected non-coincident summer peak demand by season through the study period to 2028. Figure 3-2 shows historic and forecast annual energy requirements by customer class. The historic and forecast values have existing conservation programs embedded, whereas the forecasted values exclude new conservation programs. Otter Tail’s energy requirements are driven equally by residential and commercial customers, creating an annual load factor of approximately 70 percent. Otter Tail projects that by the end of the study period, large commercial and industrial loads will increase to roughly 60 percent of the Company’s retail sales.
2
These REO and RES requirements only apply to utilities like Otter Tail without nuclear generating assets. Utilities with nuclear generating assets have a more aggressive standard as detailed in Minn. Stat. §216B.1691
.
Figure 3-1: Historic and Forecast Unmanaged 50/50 Non-coincident Summer Peak Demand
Figure 3-2: Historic and Forecast Annual Retail Sales (Losses are not included)
Otter Tail assesses capacity need through evaluation of the Company’s load and capability under Module E of the Midcontinent ISO Resource Adequacy Construct. Capacity need is calculated by taking the difference between the planning reserve obligation, which is the coincident peak demand forecast plus the planning reserve margin and transmission losses, and the sum of accredited generating capability, net transaction capacity, and demand side resources.
0 200 400 600 800 1,000 1,200 1993 1995 1997 1999 2001 2003 2005 2007 2009 2011 2013 2015 2017 2019 2021 2023 2025 2027 MW History 1993-2012 Forecast 2013-2028
Historic data has impacts from existing conservation programs embedded.
Forecast data excludes impacts from any new conservation programs.
The Company’s projected summer capacity needs under Module E requirements are shown in Tables 3-1 and represented graphically in Figure 3-3. The Midcontinent ISO requires the Company to designate capacity to meet the 50th percentile peak demand forecast plus reserves. Demand response resources, such as Otter Tail’s load management system, are netted from the demand forecast prior to calculating the resource adequacy obligation. The supply-side resource stack is composed of capacity that is converted to zonal resource credits (“ZRCs”) for resources that are universally deliverable within the Midcontinent ISO footprint (or aggregate), as well as for resources that are locally deliverable to Otter Tail’s load, and any bilateral transactions of ZRCs.
Table 3-1: Summer 2014-2028 Load and Capability Prior to Preferred Plan Information
Figure 3-3: Projected Summer Capacity Needs through 2028, by Calendar Year
Planning Year Coincident 50/50 Forecasted Demand (MW) Accredited Demand Response (MW) Planning Reserve Margin (6.2%) Transmission Losses Reserve Obligation Net of Accredited Demand Response (MW) Aggregate Capacity (ZRCs) Local Capacity (ZRCs) External Capacity (ZRCs) Net Transaction Capacity (ZRCs) Total Accredited Capacity (ZRCs) Projected Summer Deficiency (-MW) 2014 603.6 -26.0 35.8 28.2 641.6 608.5 64.8 4.5 100.0 777.8 136.2 2015 628.5 -30.0 37.1 29.2 664.8 608.5 64.8 4.5 100.0 777.8 113.0 2016 657.0 -41.0 38.2 30.1 684.2 608.5 64.8 4.5 100.0 777.8 93.6 2017 658.5 -39.0 38.4 30.2 688.2 608.5 64.8 4.5 25.0 702.8 14.6 2018 664.7 -39.0 38.8 30.5 695.1 608.5 64.8 4.5 25.0 702.8 7.7 2019 687.2 -43.0 39.9 31.4 715.6 608.5 64.8 4.5 50.0 727.8 12.2 2020 695.4 -43.0 40.4 31.8 724.7 608.5 64.8 4.5 50.0 727.8 3.1 2021 708.2 -50.0 40.8 32.1 731.1 473.1 64.8 4.5 0.0 542.4 -188.7 2022 722.9 -51.0 41.7 32.8 746.4 473.1 64.8 4.5 0.0 542.4 -204.0 2023 730.5 -51.0 42.1 33.2 754.8 473.1 64.8 4.5 0.0 542.4 -212.4 2024 738.2 -51.0 42.6 33.5 763.4 473.1 64.8 4.5 0.0 542.4 -221.0 2025 746.0 -51.0 43.1 33.9 772.0 473.1 64.8 4.5 0.0 542.4 -229.6 2026 754.0 -56.0 43.3 34.1 775.3 473.1 64.8 4.5 0.0 542.4 -232.9 2027 762.0 -56.0 43.8 34.5 784.3 473.1 64.8 4.5 0.0 542.4 -241.9 2028 770.2 -56.0 44.3 34.9 793.4 473.1 64.8 4.5 0.0 542.4 -251.0
As shown, Otter Tail expects deficiencies to begin in 2021 when the existing capacity purchase agreements end and the Hoot Lake units 2 and 3 are planned to retire. Otter Tail is a winter peaking utility but for modeling purposes bases its capacity resource need on the summer season as required by Midcontinent ISO resource adequacy rules. Although the summer season drives capacity needs, the entire year is evaluated for the Company’s energy needs.
4
Plan Development
4.1
Plan Objectives
In its Order concerning Otter Tail Power Company’s initial resource plan filing in 1992, the Commission stated that it considers the characteristics of the available resource options and the proposed plan as a whole. In addition, the Commission stated that it evaluates resource plans on their ability to: (1) maintain or improve the adequacy and reliability of utility service, (2) keep the customers' bills and the utility's rates as low as practicable, given regulatory and other constraints, (3) minimize adverse socio-economic effects and adverse effects upon the environment, (4) enhance the utility's ability to respond to changes in the financial, social, and technological factors affecting its operations, and (5) limit the risk of adverse effects on the utility and its customers from financial, social, and technological factors that the utility cannot control. Otter Tail has worked to keep the Commission's objectives in mind while selecting resource options that will provide adequate, reliable, and reasonably priced electric power for its customers.
4.2
Planning Tools
Otter Tail Power Company uses Strategist to perform capacity expansion planning. The Strategist model is capable of providing full supply-side and demand-side integration in the optimal selection of resources, subject to a specified objective function and any imposed constraints. The objective function employed by Otter Tail was to minimize total societal cost, or revenue requirements, based on the costs incurred by both the customers and the utility, plus any externality costs, as shown in the following formula:
Capital Cost + Base Revenue + Total System Cost + Emissions Externalities
MINIMIZE Net Present Value: Total Societal Costs (or Revenue Requirements)
Capital Costs include costs for engineering, procurement, and construction of a resource addition. Base Revenue includes the allowable return the Company is able to earn on rate base. Total System Costs include operations and maintenance expenses, fuel costs, or emissions charges. Emissions externalities include any imposed externality cost.
Emissions externalities were used in 42 of the 78 sensitivities. The remaining 36 sensitivities did not have emissions externalities applied.
The net present value of revenue requirements evaluated by the model includes end-effects calculations. End-effects calculations are used to analyze differences between alternatives after the planning period's horizon. End effects are significant in determining the optimal rankings of plans based on long-run economic advantages. Differences among alternatives are due to different operating characteristics and lives and end-effects analysis ensures that those characteristics are adequately considered for capital intensive units that may be added late in the planning period. The end effects result is used to augment the planning period result to account for the cost of replacing the resources and for differences in
operating cost after the planning period. In all scenarios, the end-effects period was assumed to be infinite. Therefore, the total societal costs, or revenue requirements, were considered for the study period of 2014-2028, plus end effects.
4.3
Planning Process
Otter Tail’s planning process is an iterative progression that includes the following primary steps:
1) Modeling the Company’s system using Strategist – This step requires representing all components of the Company’s existing fleet of generation, transactions, DSM programs, and financial structure. This is an ongoing process and many inputs are updated either annually or as changes occur.
2) Performing capacity expansion runs – This step requires executing the capacity expansion model to rank plans of feasible combinations of alternatives under specified constraints. The capacity expansion tool ranks the plans according to least cost. Careful review of model results for verification and validation and reasonability is essential.
3) Developing a preferred resource plan – The Company aims to select a least-cost preferred plan that complies with all relevant statutes and rules, resource adequacy obligations, renewable energy objectives and standards, and established environmental regulations. Additionally, the least cost plan is weighed against scenarios that evaluate regulatory and market uncertainties in the planning horizon. The preferred plan protects the customer and the Company from
unnecessary exposure to risk, while maintaining flexibility and commitment to providing electricity in an economical, reliable, and environmentally responsible manner.
Because Otter Tail’s planning process is model-dependent, a more detailed explanation of the components of the Strategist model is provided here. Otter Tail uses four modules in the Strategist model called the LFA, GAF, CER, and PRV. The following section discusses some of the major inputs and the process involved in populating these modules of the database. Greater detail on model assumptions is provided in Appendix F.
Load Forecasting Module – (“LFA”)
The load-forecasting process developed three uncontrolled load forecast scenarios: low, base, and high. The Company splits the load into two components for modeling purposes to represent the Company’s Minnesota load and remaining load in both North Dakota and South Dakota. The accredited load control, as registered with Midcontinent ISO under Module E as Demand Response, was also entered into the model. The load control was set up to net against the demand forecast prior to calculating the reserve obligation, it was prevented from actually dispatching. The reason for this representation was that the model is developing a capacity expansion plan based on the 50/50 or mean forecast. Load control is unlikely to occur for capacity reasons at the mean forecast level. Rather, Otter Tail aims to control for capacity reasons to protect against extreme capacity constraints during higher than anticipated load levels, more likely at the 95th percentile level or under obligation to the Midcontinent ISO for emergency
Generation and Fuel Module – (“GAF”)
Operational specifications and performance parameters of existing and potential thermal resources, hydro units, and transactions (including owned wind and power purchase agreements) were entered in the Strategist database. Capacity accreditation was based on the 2013-2014 planning year ratings by the Midcontinent ISO and any known or anticipated adjustments to accreditations in future years. The data for the thermal resources included heat rates, emissions, maintenance schedules, and maximum and minimum capability. Fuel price forecasts for oil, coal, and natural gas were also represented in the GAF. A tie line to the Midcontinent ISO energy market was represented along with a corresponding energy market price forecast. Wind generation resources were provided a profile for generation output based on historical performance. The GAF also includes cost data for fixed and variable operation and
maintenance expenses and contract prices for energy and capacity.
Capital Expenditures – (“CER”)
Planned capital projects unique to each resource were represented in the model. Non-project specific annual capital expenses were projected over the long-term. Capital projects associated with potential resources were also entered in the CER module along with an expenditure profile and specified tax life and book life.
Proview Capacity Expansion – (“PRV”)
The Proview Module in Strategist was set up to evaluate a variety of potential resource alternatives subject to the objective function to minimize total societal costs, or revenue requirements. As part of a robust planning process, the Company uses Proview to evaluate a variety of sensitivities to meet the requirements of the resource plan filing and any known or expected regulatory or economic conditions. Otter Tail ran the model from 2014 through 2028 to capture the full 15 years in the study period. Model results from the Proview runs were compared and evaluated for reasonability and compliance with all constraints.
The Company seeks to develop one preferred plan that reliably and economically meets the energy needs of its customers in all three states, while complying with all legal and regulatory obligations and
managing risk. The results of the resource planning analysis are used to develop this filing as well as internal planning and evaluation.
5
Preferred Resource Plan
The preferred resource plan identifies possible resources that could be used to serve customer loads over the entire 2014 – 2028 resource planning period. It also details Otter Tail’s expected activities during the first five years of the planning period. This section first discusses details associated with the preferred resource plan. Then it presents the results for the scenarios required by the Minnesota Rules for resource plan filings, including high and low load growth scenarios, externality scenarios, and renewable and conservation scenarios. The Company’s preferred resource plan, presented in Table 5-1, shows the resource additions anticipated for the planning period.
Table 5-1: Preferred Plan Resource Additions
As Figure 5-1 shows, a new natural gas 211 MW combustion unit resource is added in 2021.
Figure 5-1: 2014-2028 Capacity Resources and Reserve Obligation for Preferred Plan (MW)
Resource Plan (MW) - Based on Nameplate ratings
2014 2015 2016 2017 2018 2019 2020
2021 211 MW frame NG CT Commercial Operation of frame, natural gas-fired, simple cycle
combustion turbine. 2022 2023 2024 2025 2026 2027 2028
Figure 5-2 shows the energy sources in the preferred plan by fuel type. Conservation contributes a significant portion to the Company’s future energy needs, as do wind generation, continued market opportunity purchases, and natural gas generation.
Figure 5-2: 2014-2028 Energy Resources and Energy Requirements for Preferred Plan (MW)
5.1
Preferred Resource Plan Description
The Otter Tail preferred resource plan is the least cost plan selected by the Strategist model under the Company’s base case assumptions, totaling $3.376B in NPVRR in 2014$. The Company’s preferred plan is Energy Market On sensitivity No. 22 from Appendix I. Following is a description and comment on each of the new demand response and energy efficiency resources used in the preferred plan.
1.5 % CIP – The model uses an annual energy efficiency and conservation alternative for Minnesota load that is 1.5 percent of average retail sales for the prior three years. By 2028, summer peak demand impacts from energy efficiency and conservation are expected to be 91 MW, not including the reserve margin savings.
Demand Response – Demand response includes both load management capability and customer contracts that allow load shedding to a firm service level. In the preferred plan, demand response capability was selected to increase annually and reach 15 MW of additional summer season capability by 2028. To allow the Company time to confirm measurement and verification capability of incrementally new demand response, the new demand response was stair-stepped in every five years in 5 MW increments.
5.2
REO/RES Compliance
Figure 5-3 represents the planned compliance with REO/RES regulation in all jurisdictions under the preferred plan.
Otter Tail expects to have surplus renewable energy credits until 2020 when the solar portion of the Minnesota RES begins. The solar portion of the RES is a new Minnesota requirement enacted in 2013 to be effective in 2020. The preferred plan does not select solar resources as part of its least cost plan. The Company included 12 solar compliance sensitivities (Energy Market On and Energy Market Off
sensitivities numbered 4, 5, 6, 25, 26 and 27 from Appendix I), which included modeling solar purchased power agreements at different price levels to determine the impact of meeting the solar RES. Figure 5-4 shows the impact on the PVRR for the solar compliance sensitivities relative to the base cases. Otter Tail will continue to monitor and evaluate potential solar opportunities on its system.
To estimate the cost/benefit of RES compliance, Otter Tail compared the cost of Otter Tail’s RES eligible resources to the market energy costs. Figure 5-5 shows the comparison. Historical values are used for 2008 through 2012. Forecasted values are used for 2013 through 2028. When the average day-ahead market price is below the RES cost it is a “cost” year (2009-2013). When the average day-ahead market price is above the RES cost, it is a “benefit” year (2008, 2014-2028).
Figure 5-6 shows the estimated impact of the RES on average retail rates when comparing RES resources to the average energy market price. The solar portion of the RES is estimated to have a 2 percent increase in rates while the remainder of the RES is expected to have a benefit when compared to the average energy market prices (Figure 5-6 does not attempt to compare the cost/benefit of the RES additions to alternative non-market resources). The wind portion of the RES provides 19 percent of the Company’s system-wide energy requirement while the solar portion provides 1.5 percent of the Company’s
Minnesota load (0.75 percent of system-wide energy).
5.3
Load Growth Scenarios
The Company included four low load growth sensitivities (Energy Market On and Energy Market Off sensitivities numbered 13 and 34 from Appendix I) and four high load growth sensitivities (Energy Market On and Energy Market Off sensitivities numbered 14 and 35 from Appendix I). As shown in Figure 5-7, the low load growth sensitivities results in lower total revenue requirements and fewer resource additions. The high load growth sensitivities result in higher total revenue requirements and more resource additions.
Figure 5-7: Load Growth Sensitivities – PVRR impact
5.4
Environmental Externality Scenarios
The Company evaluated 42 sensitivities where environmental externalities were applied (Energy Market On and Energy Market Off sensitivities 1 thru 21 from Appendix I).
The assumptions for the high (Energy Market On and Energy Market Off sensitivity 20 from Appendix I) and low (Energy Market On and Energy Market Off sensitivity 19 from Appendix I) environmental externality values were taken from the June 5, 2013, Notice of Revised Updated Environmental Externality Values as provided by the Commission for rural Minnesota. The high and low CO2 values
high and low values was used. In all externality sensitivities, externality values were escalated 3 percent for inflation.
Figure 5-8 shows the impact of externality values on the PVRR. The PVRR for sensitivities 1 through 18 (which use the mid-point externality values) are compared to their zero externality counterpart
sensitivities 22 through 39. The average increase to the PVRR is approximately $1.4 billion.
Figure 5-8: Externality Application – PVRR impact
Customers benefit from one uniform plan across the jurisdictions through (1) economy of scale, (2) reduced administrative and ratemaking burden by not having to “jurisdictionalize” the plan, and (3) reduced complexity in operating the system. The Company recognizes that the preferred plan may change as CO2 regulation becomes defined. The preferred plan provides the greatest flexibility in
5.5
Emissions and Greenhouse Gas Reduction Goal
The preferred plan shows a reduction in emissions from Otter Tail’s historical levels. Figure 5-9 shows the estimated emissions for SO2 and NOx. Figure 5-10 shows the estimated emissions for CO2. Figure
5-11 shows the estimated emissions for mercury. The solid lines indicate historical levels of emissions (2005 to 2012) for Otter Tail-owned units. The dashed lines (2014 to 2028) indicate the estimated emissions of the preferred plan for Otter Tail-owned units.
Figure 5-9: SO2 and NOx Emissions
Figure 5-11: Mercury Emissions
Minnesota Statutes §216H.02 states that “It is the goal of the state to reduce greenhouse gas emissions to a level of at least 15 percent below 2005 levels by 2015, to a level at least 30 percent below 2005 levels by 2025, and to a level at least 80 percent below 2005 levels by 2050.” Sensitivity No. 21 from Appendix I shows the resource additions to meet the CO2 reduction goal for Otter Tail’s system. Within this
sensitivity, the Energy Market Off sensitivity adds 350 MW more wind than the base case and increases the PVRR by more than $87 million. The Energy Market On sensitivity adds 200 MW of wind more than the base case and increases the PVRR by over $39 million.
Figure 5-12 shows the preferred plan CO2 emissions and how it compares with the CO2 reduction goal and
the 2005 level of CO2 emissions. The 2005 level is estimated at 4,653,930 tons of CO2 (3,745,676 tons
from Otter Tail-owned units and 908,254 tons assumed for purchased energy based on the 2005 MRO west regional average CO2 /MWh of 1,821.64 lbs). For market purchases, 1,623.64 lbs of CO2 are
applied to each MWh of energy purchased.
5.6
50% and 75% Conservation and Renewable Scenarios
Minnesota Statutes §216B.2422, Subd. 2, states that "a utility shall include the least cost plan for meeting 50 and 75 percent of all new and refurbished capacity needs through a combination of conservation and renewable energy resources.” The calculation is based on the energy from future conservation and
renewable resources compared to the total growth in energy requirements for Otter Tail’s Minnesota load.
Table 5-2 presents the energy calculation for determining whether the conservation and renewable energy target was met. The preferred plan achieves the 50 percent target. The combined additions of CIP and a 50 MW wind resource would meet the 75 percent target of the Company’s future energy needs in the Minnesota jurisdiction, assuming only 50 percent of new wind resources are allocated to Minnesota load (Otter Tail notes that the specific jurisdictional allocation of the wind resource might not be proportional among its jurisdictions if the resource addition is not able to be demonstrated to be part of a least cost resource plan).
Table 5-2: 50% and 75% Renewable and Conservation as Percent of Total New MN Energy Requirements
1.5% Conservation (GWh) MN 50% Share of 50 MW Wind (GWh) Total (GWh) 1.5% Conservation (GWh) MN 50% Share of 50 MW Wind (GWh) Total (GWh) New MN CIP 540 ‐ 540 540 ‐ 540 New Wind ‐ 0 0 ‐ 82 82 Total 540 0 540 540 82 622
Percent of Total New MN Energy Requirements (= 827 GWh)
65% 0% 65% 65% 10% 75%
Preferred Plan and the 50% Renewable and
5.7
Additional Sensitivity Scenarios
Otter Tail evaluated additional sensitivities. They included variations in wind prices, solar prices, natural gas prices, coal prices, capital costs, energy and capacity market prices, and CO2 reductions. A
comparison of the net present value of revenue requirements for all scenarios is provided in Figure 5-13.
6
Conclusion
Otter Tail Power Company’s mission is to produce and deliver electricity as reliably, economically, and environmentally responsibly as possible to the balanced benefit of customers, shareholders, and
employees and to improve the quality of life in the areas in which we do business. The preferred plan provides the best course of action for the Company to achieve these objectives. The preferred plan also provides flexibility to react to legislative, regulatory, and market changes that will occur during the next several years.
This resource plan is straightforward in that the resulting generation additions are nearly the same in the majority of the sensitivities: No generation additions during years one through five with the first addition being a natural gas simple-cycle combustion turbine in either 2019 or 2021. The specific size, type and timing of the next resource can be more precisely addressed in the next resource plan.
The preferred plan improves environmental performance through implementation of DSM, renewable resources and environmental upgrades at existing facilities. The resource plan satisfies the regulatory and statutory requirements of all three jurisdictions that it serves.
6.1
Preferred Plan is in the Public Interest
The Company is committed to operating its generation facilities as efficiently as practicable while minimizing adverse effects on the environment. New resources have been selected that will meet the Company’s needs while maintaining flexibility and limiting the risk of exposure to changes in financial, social and technological factors beyond its control. With no resource additions during the initial five-year period, the plan maintains flexibility during a period of much uncertainty in the future of the electric industry. In addition, customers will be provided with increased opportunities to improve their energy efficiency. By using excess REC’s generated in prior years, Otter Tail is compliant with the renewable energy objectives and standards across the entire Otter Tail tri-state system until 2025. This resource plan satisfies the legal and regulatory requirements in the multi-state service territory and allows Otter Tail and its customers to realize the benefits of operating as a single system while recognizing the differing state requirements.
The preferred plan will meet 65 percent of new energy requirements in Minnesota through renewable generation and increased levels of conservation by 2028. The plan satisfies all rules and requirements of the Minnesota statutes and rules, provides a clear concise report to interested parties of what Otter Tail intends to do to satisfy customer needs in the near term, and identifies the resources the Company is considering for viable options for the long term.
6.2
Socio-Economic Impacts of the Preferred Plan
The primary socio-economic impact of the preferred plan is that it is the least-cost plan, and provides reliable and affordable electricity to customers. Otter Tail supports economic development in the states we do business by keeping costs low and reliability high for commercial and industrial customers so that those customers can invest in greater productivity and growth. Likewise, Otter Tail keeps costs low and reliability high for the residential consumer, recognizing that electricity is a fundamental input to the overall health, welfare, and productivity of society.