Intermediate report on the development of
railway safety in the European Union
Intermediate report on the
development of railway safety in the
European Union
2013
European Railway Agency Safety Unit
Contact: Vojtech EKSLER Publication date: 15 May 2013
CONTENTS
BACKGROUND ... II SUMMARY ... III
SAFETY OVERVIEW ... 1
HISTORICAL DEVELOPMENT OF RAILWAY SAFETY ... 2
RISK LEVELS ... 4
Second set of CSTs ... 6
Second assessment of the second set in 2013 ... 8
ACCIDENT OUTCOMES ... 10
SIGNIFICANT ACCIDENTS ... 10
DANGEROUS GOODS ACCIDENTS ... 12
CASUALTIES FROM SIGNIFICANT ACCIDENTS ... 13
PRECURSORS TO ACCIDENTS ... 16
LEVEL CROSSING SAFETY ... 17
RAILWAY SUICIDES ... 20
SAFETY AND MARKET OPENING ... 22
ACCIDENT COSTS ... 24
SAFETY OF INFRASTRUCTURE ... 25
TRAFFIC VOLUMES ... 27
RAILWAY TRANSPORT OPERATION EFFICIENCY ... 29
Passenger trains ... 29
Freight trains ... 29
INDEPENDENT ACCIDENT INVESTIGATION ... 31
BACKGROUND INFORMATION ... 34
ANNEXES ... 36
ANNEX 1 — COMMON SAFETY INDICATORS... 37
LIST OF CSI DATA TABLES ... 37
LEGEND ... 37
ANNEX 2 — LIST OF SERIOUS ACCIDENTS – COLLISIONS AND DERAILMENTS - OCCURRING IN 2012 AND NOTIFIED TO ERA ... 43
I
List of abbreviations
ATP
automatic train protection
CSI
common safety indicator
CSTs
common safety targets
CT
Channel Tunnel
ERA
European Railway Agency
ERADIS
European Railway Agency Database of Interoperability and Safety
ERAIL
European railway accident information links
EU
European Union
FWSI
fatalities and weighted serious injuries
IM
infrastructure manager
KPI
key performance indicator
LC
Level crossing
NIB
national investigation body
NRV
national reference value
NSA
national safety authority
OSP
observed safety performance
p.a.
Per annum (per year)
RSD
railway safety directive
RU
railway undertaking
II
BACKGROUND
Safety of European railways is relatively high, being one of the safest modes of transport. Even so, it is essential to maintain and improve the current level of safety for the benefit of European citizens. A safe railway is more efficient and also a more attractive transport choice, enabling society to address the environmental and economic challenges of the 21st century.
The European Railway Agency (ERA) is a cornerstone of the EU strategy for railway safety. It supports national safety authorities (NSAs) and national investigation bodies (NIBs) in their tasks and provides evidence for policy actions at EU level. It develops and promotes the common safety framework as a means for achieving an open railway market in the EU. The Agency also coordinates activities such as monitoring and provides support for the further development of EU legislation.
Monitoring safety performance is one of the key tasks of the ERA. The ERA collects, processes and analyses different sets of data, in order to support recommendations on actions to be taken. In this way, the Agency facilitates evidence-based policy- making at the EU level. By continuously monitoring and analysing safety performance, the Agency provides the assurance that the objective of maintaining and improving safety where reasonably practicable can be achieved.
The Agency is requested by EU legislation (1) to produce a report on safety performance on biannual basis. As a biannual report was published in 2012, there is no requirement to produce such a report in 2013; therefore no regular “Railway Safety in the EU” report is published by the Agency. Nevertheless, the availability of annual evaluation of railway safety performance is of vital importance for the Agency itself, EU and national policy makers, public agencies and experts from consultancies and academia.
This intermediate report is intended to provide an updated overview of railway safety performance across the EU and present results of various analyses of that performance. It also includes the results of various benchmarking exercises that have not been previously published by the Agency. They are all intended to share knowledge available to the Agency with all interested parties and enable them to make the railway system safer, more efficient and more competitive.
This report is unique in its nature - it is a once-only publication prepared exclusively in electronic format and its content has been customised to meet the present needs of the Agency and of its stakeholders, including the European Commission. The methodology applied throughout this report stems from the presumption that one cannot improve what one cannot measure (2).
Although this report relies heavily on quantitative data, the ERA is starting to use qualitative information for the evaluation of railway safety in the EU and its Member States in the coming years. The assessment of processes carried by National Safety Authorities and National Investigation Bodies extends the possibility for safety monitoring beyond safety outcomes and changes its nature from reactive to proactive.
(1) Article 9(2) of the Agency Regulation (881/2004/EC)
(2) In the words of Lord Kelvin: “When you can measure what you are speaking about, and express it in numbers, you know something about it; but when you cannot measure it, when you cannot express it in numbers, your knowledge is of a meagre and unsatisfactory kind; it may be the beginning of knowledge, but you have scarcely in your thoughts advanced
III
SUMMARY
This report provides an annual overview of railway safety performance of the European Union. Following the statutory biennial report published by the European Railway Agency in 2012 in accordance with the requirements of the Railway Safety Directive, this is intended as intermediate report.
Most recently available figures confirm that railways remain one of the safest modes of transport in the European Union and worldwide. However, it has become difficult to sustain the trend in reducing casualties on railways. In particular, it appears that the sector continues to struggle to reduce the number of third-party victims, which represents 90 % of all casualties on railways, excluding suicides.
Safety performance of EU Member States varies considerably, with a more than ten-fold difference in risk for all categories of railway users. These differences have not reduced over the past few years and represent a major challenge for EU policy makers.
The continuous opening of railway market does not appear to be a threat to safety: the countries with advanced market liberalization have a better safety performance than other countries and they do not appear to be losing their position with time.
Around 2 400 significant accidents occur each year on the railways of the EU Member States. Accidents to persons caused by rolling stock in motion and level-crossing accidents constitute more than three quarters of railway accidents, excluding suicides. In these accidents, around 1 200 persons are killed and a similar number of persons are seriously injured each year.
In 2011, railway safety continued to improve across the EU, with 2 342 significant accidents resulting in 1 183 fatalities and 1 032 seriously injured. Accident figures have been decreasing considerably over the past five years; the casualty numbers have seen slight, close to uniform reductions over the same period.
Level crossing users are the only category of third-party/external victims for which the number of causalities has seen a reduction over the past five years; yet this reduction was less significant than the reduction in road casualties over the same period.
The number of suicide and trespasser fatalities has not seen any significant reduction over time. In consequence, while suicide and trespasser fatalities accounted for 84 % of all fatalities in 2007; their share has increased to 90 % in 2011. External victims, i.e. suicides, trespassers and level crossing users made up 98 % of railway fatalities in 2011.
Among 2 342 significant accidents that occurred in 2011, 44 were classified as serious accidents by National Investigation Bodies (NIBs) and as such investigated independently. In total, the NIBs opened an investigation into 249 accidents and incidents that occurred in 2011.
Page | 1
S
AFETY OVERVIEW
Around 2 400 significant accidents occur each year on the railways of the EU Member States. Accidents to persons caused by rolling stock in motion and level-crossing accidents constitute more than three quarters of railway accidents, excluding suicides. In these accidents, around 1 200 persons are killed and a similar number of persons seriously injured each year.
In 2011, railway safety continued to improve across Europe, with 2 342 significant accidents resulting in 1 183 fatalities and 1 032 seriously injured. Accident figures have been decreasing considerably over the past five years; the casualties’ numbers have seen slight, close to uniform reductions over the same period (Figure 1).
Figure 1: Significant accidents and resulting casualties for the EU-27 (2007–2011)
Comparisons of fatality risks for travelling passengers (occupants) reveals that train is one of the safest mode of transport. The fatality risk for an average passenger is about 0.15 fatalities per billion kilometres, comparable with the risk of commercial flight passengers of 0.1 fatalities per billion passenger kilometres. The fatality risk for a train passenger is three times lower than the risk for a bus/coach passenger (Table 1).
Transport mode used by user Fatality risk (2008-2010)
Fatalities per billion passenger kilometers
Airline passenger 0.101
Railway passenger 0.156
Car occupant 4.450
Bus/Coach occupant 0.433
Powered two-wheelers 52.593
Vessels passenger N/A
Table 1: Fatality risk of passenger using different mode of transport (EU-27 in 2008-2010) (3)
(3) Source of data: EU transport in figures (Statistical Pocketbook 2012), DG MOVE 2012, European Commission
1517 1479 1385 1256 1183 1370 1382 1110 1236 1032 3819 3730 3027 2401 2342 0 500 1000 1500 2000 2500 3000 3500 4000 2007 2008 2009 2010 2011
Page | 2
Historical development of railway safety
The overall level of railway safety in Europe, as measured by fatal train collisions and derailments per billion train-kilometres, has gradually improved since 1990, although there is considerable scatter from year to year. The estimated overall trend is a reduction in the accident rate of 6 % per year (4). This gives a fall of 70 % from 1990 to 2012 (Figure 2). The estimated underlying average number of fatal train collisions and derailments per billion train-killometers was about 4.4 in 1990 and 1.3 in 2011. Despite a positive long-term trend in the risk of fatal train collisions and derailments over the past two decades, the data in Figure 2 suggests that the progress has been slowing down, in particular since 2004.
Figure 2: Fatal train collisions and derailments per billion train-kilometres in 1990–2012 for the EU-27, Switzerland and Norway (5)
The number of fatalities in all railway accidents has seen a distinct, downward trend for all categories of accidents, except level-crossing accidents. This can be partly explained by the continuous increase in road traffic across Europe, as contributing to the likelihood of a level-crossing collision. The currently run programmes to remove or upgrade level-crossings might not be extensive enough to compensate for the increased risk of a level crossing collision.
Accidents with multiple fatalities rarely escape the attention of the media and the public, so data on these may be more complete. Figure 3 is based on data from the historical archive of railway accidents maintained by the Agency; it shows the number of major accidents and resulting fatalities for the 33 years 1980–2012. It includes not only the train collisions and derailments with 5 or more fatalities, but also the major level-crossing accidents, train fires, and accidents involving groups of persons struck by rolling stock in motion. The trend in the accident rate per billion train-kilometres for accidents resulting in five or more fatalities is strongly downward over the period 1990–2012, but somewhat less steep if taken back to 1980–2012. Figure 3 shows that there were on average eight major railway accidents each year during the 1990s, this figure has
(4) A. W. Evans (2011), ‘Fatal train accidents on Europe’s railways: 1980–2009’, Accident Analysis and Prevention 43(1), 391–401.
(5) Figure courtesy of Andrew W. Evans (Imperial College and University College London), based on own database of fatal train accidents and collisions and on the train-km data from the UIC, Eurostat and the ERA.
Page | 3 now come down to five accidents per year in the 2000s. There were four accidents with five or more fatalities in Europe in 2012, three of which were level crossing accidents.
Figure 3: Railway accidents with five or more fatalities (1980–2012) (6)
In conclusion, available historical data on fatal railway accidents shows a gradual improvement in safety over the past three decades, however restricting the analysis to the past eight years creates uncertainty about the trend in railway safety in Europe in recent years. This stems from the low number of fatal accidents and from their random nature.
(6) All EU countries, Norway and Switzerland, excluding Romania for the period 1980–1989. Accidents on railway mainlines not covered by the RSD are also included.
Page | 4
Risk levels
Accident risk expressed in the number of outcomes per exposure is probably the best measure of the safety level. The framework for the evaluation of CSTs/NRVs also uses it as a basis for the assessment of safety levels at the level of Member States and the Union. Considering all railway fatalities (excluding suicides), the fatality risk per million train-km in the period 2009-2011 was 0.31 killed per million train km in the EU level. Yet the values of risk vary greatly between countries: The risk of countries in the lowest and highest 10th percentile differs by a factor of 15. (i.e. the fatality risk for Estonia (1.36) is 15 times higher than the risk for Ireland (0.09)). Interestingly, the countries with a fatality risk higher than average show much greater variations in risk than those outperforming the EU average. (The distribution of risk among countries is clearly asymmetrical, with the median value of 0.31, as compared to mean value of 0.60.) Actually, one third of countries seriously undermine the low level of risk at EU level. Six EU countries have a level of risk that is at least four times higher than the EU average as shown in Figure 4.
Figure 4: Fatality risk on EU railways: Fatalities per million train-km (2009-2011)
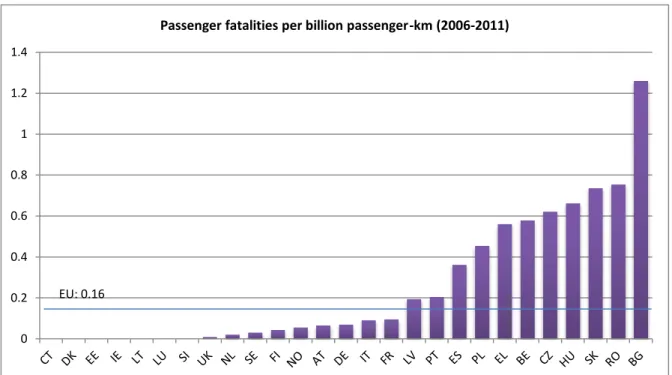
Another way to benchmark the level of risk of national railway systems is to look at the fatality risk of passengers expressed in terms of passenger fatalities per passenger kilometres. Six countries and the Channel Tunnel have recorded no passenger fatality in the period 2006-2011, thus their passenger fatality risk is zero. The countries with a level of risk higher than the average are typically those with a high risk for all persons on railways (8 countries have fatality risks for passenger and all users higher than EU average). This fact, together with the similarities in the distribution shapes, discards the common belief that the two measures of risk are not comparable and that the safety of passengers is not correlated to safety of other users.
There are certain limitations in the two benchmarking indicators: They rely on the numbers of fatalities only, since serious injury data are not believed to be fully comparable between countries and the period considered is not of the same length, because of limited compatibility of certain data before 2009. However, these limitations do not seriously undermine the conclusions that can be drawn from Figure 4 and Figure 5.
0.0 0.2 0.4 0.6 0.8 1.0 1.2 1.4 1.6 1.8 2.0
Railway fatalities per million train-km (2009-2011)
Page | 5
Figure 5: Passenger fatality risk: Passenger fatalities per billion passenger kilometres (2006-2011)
Similarly, one can show the levels of risk for different types of persons and different exposure. This is done in the framework of common safety targets (CSTs) and national reference values (NRVs), where the NRVs exist for 6 categories of persons and sometimes for two types of exposure. The NRVs are valid measures of risk that can be used for benchmarking similar to the one shown in Figure 5, but their value is limited due to the fact that they are not updated in regular enough intervals and often rely on relatively old data.
Selected descriptive statistics can be used to assess the development of differences in risk levels between countries over time. Fatality risk per million train kilometres for three groups of persons is considered: Passengers and employees, all railway victims except third parties (suicide, trespassers and LC victims) and all victims except suicides. The fatality risk is estimated for two periods: 2006-2008 and 2009-2011. For all three user categories under consideration, the fatality risk decreased considerably between the two periods (decrease in mean and median values). Similarly, the standard deviation characterizing how widely values are dispersed from the average value decreased over time, yet the relative decrease was more important for passengers and employees (and other) victims. When also considering level crossing users and trespassers, the relative reduction is only minor. The distribution of risk values for Member States is relatively peaked regardless the category of users considered seeing from positive kurtosis values. A relative increase in kurtosis in time suggests that the distribution has become less flat. With regard to passengers and employees, the decreases in risk variation have been driven by reductions in risk in countries which had relatively high risk values in the first period, given the increase in skewness. For other categories, the decrease in the variation of risk is a result of an overall reduction recorded for all countries.
Fatality risk per million train-km Period Mean Median SD Kurtosis Skewness
Passengers and employees 2006-2008 0.049 0.039 0.043 0.021 0.882 2009-2011 0.030 0.022 0.030 6.280 2.194 All except third parties 2006-2008 0.081 0.056 0.106 15.139 3.568 2009-2011 0.048 0.031 0.054 9.678 2.871 All fatalities except suicide 2006-2008 0.724 0.379 0.665 0.075 0.973 2009-2011 0.596 0.306 0.562 0.163 1.093
Table 2: Descriptive statistics for fatality risk in periods 2006-2008 and 2009-2011
0 0.2 0.4 0.6 0.8 1 1.2 1.4
Passenger fatalities per billion passenger-km (2006-2011)
Page | 6
Common Safety Targets
Common safety targets (CSTs) are quantitative tools intended to monitor whether the current safety levels of the railways in the Member States are at least maintained. In the long term, they could also help to drive efforts to reduce the current differences in railway safety performance. Railway transport is the only mode of transport for which the targets have been prescribed by European legislation. The CSTs are EU-wide maximum risk values, the national reference values (NRVs) are the maximum risk levels set for individual Member States. The risks are measured by the number of weighted fatalities (FWSI (7)) per train-kilometre. There are risk categories for passengers, employees, level-crossing users, unauthorised persons on railway premises, ‘others’ and as applied to society as a whole.
Second set of CSTs
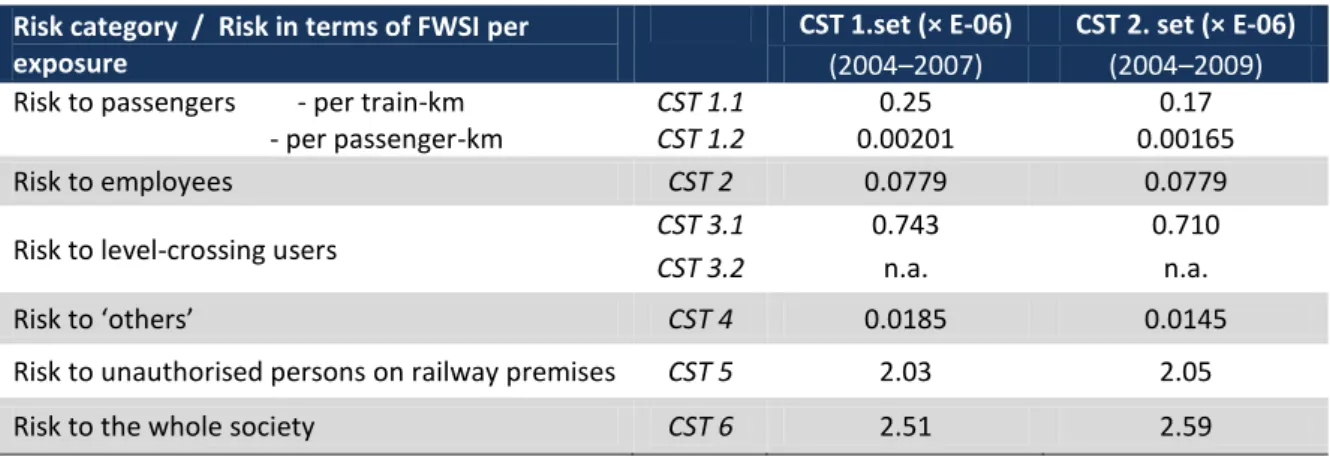
As required by the RSD, the Agency proposed and the EC adopted the second set of CSTs and NRVs in 2012. The CSTs and NRVs of the second set are based on a six-year time series of data, from 2004 to 2009, that were delivered to Eurostat by Member States. The second set of CSTs and NRVs was calculated with the same method, defined in the CSM on the assessment of the achievement of CSTs, as the first set. The revisions made by the countries to Eurostat data were taken into account. Compared with the first set of CSTs and NRVs, the only difference is the extension of the period for which data was used for calculations. The calculation method, the data source and the risk categories are the same as in the first set. The values for the second set of CSTs are shown together with the values of the first set in Table 3.
Risk category / Risk in terms of FWSI per exposure
CST 1.set (× E-06) CST 2. set (× E-06)
(2004–2007) (2004–2009)
Risk to passengers - per train-km - per passenger-km
CST 1.1 0.25 0.17
CST 1.2 0.00201 0.00165
Risk to employees CST 2 0.0779 0.0779
Risk to level-crossing users CST 3.1 0.743 0.710
CST 3.2 n.a. n.a.
Risk to ‘others’ CST 4 0.0185 0.0145
Risk to unauthorised persons on railway premises CST 5 2.03 2.05
Risk to the whole society CST 6 2.51 2.59
Table 3: Values of the second set of CSTs for different risk categories
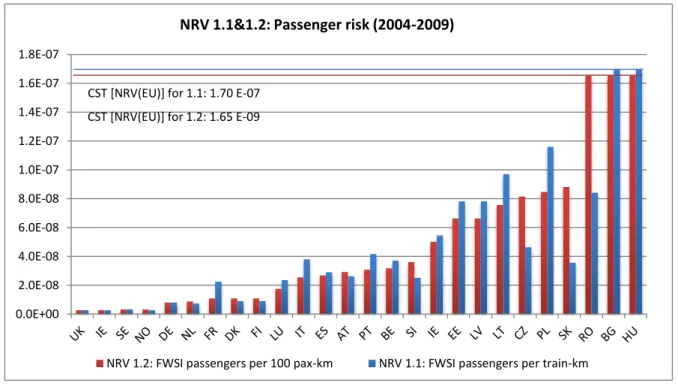
Figure 6 shows the values of the second set of NRVs for train passengers. The two indicators are showed at the same figure, the FWSI per passenger train-km and FWSI per 100 passenger-km. Not surprisingly, the two indicators are relatively well correlated, despite the fact that the hypothetical average train occupancy may vary considerably between MS. There are big discrepancies in terms of risk values among countries. The risk levels of Member States (estimated as NRV) differ by up to sixty times.
A detailed look at the descriptive statistics on NRV values (2004-2009) unveils huge variations in NRV values as expressed by the ratio between largest and smallest NRV value. The variation in NRV values for different categories of railway users is expressed through the coefficient of variation; the variation is most significant for the categories of passengers and for unauthorized persons.
While the extreme variation recorded for unauthorized persons is partly the result of poor statistics (suicide fatalities are often confused with unauthorized persons fatalities), the prevailing variation in risk for all categories of railway users under consideration is enormous and may be reflecting the different levels of infrastructure safety in Member States and the differences in the level of implementation of the common safety framework.
(7) Weighted fatalities and serious injuries are the normalised measure of railway safety outcome. One seriously injured person is considered as 0.1 fatalities and added to the number of fatalities in the given year.
Page | 7
Figure 6: CST and NRVs for the passenger category (second set based on 2004–2009 data)
Two additional descriptive statistics are showed in Table 4: kurtosis and skewness. The low values of kurtosis indicate that the single NRV values are widely spread around the mean (8). The positive values for skewness (right skewed distribution) indicate that most values are concentrated to the left of the mean, with extreme values to the right. This means that a small number of countries have significantly higher NRVs compared with the average.
NRV (FWSI) Passenger Employees LC users Others
Unauthorized persons
Whole society 1.1 1.2 2 3.1 4 5 6
Mean 4.70E-08 4.89E-10 2.21E-08 2.18E-07 8.01E-09 4.89E-07 7.60E-07 Median 3.25E-08 3.00E-10 1.45E-08 1.62E-07 7.00E-09 2.02E-07 3.73E-07 Largest 1.70E-07 1.65E-09 7.79E-08 7.10E-07 1.45E-08 2.05E-06 2.59E-06 Smallest 2.73E-09 2.76E-11 1.36E-09 2.16E-08 2.41E-09 1.59E-08 5.09E-08 Largest/Smallest 62 60 57 33 6 128 51 Coefficient of
variation 1.02 1.04 0.98 0.81 0.53 1.12 0.94 Kurtosis 1.61 1.02 0.93 0.87 -1.46 1.34 0.13 Skewness 1.45 1.36 1.39 1.04 0.32 1.39 1.01
Table 4: Descriptive statistics for NRVs (2nd set based on Eurostat 2004-2009 data)
(8) Leptokurtic distribution, sharper than a normal distribution, with values concentrated around the mean. 0.0E+00 2.0E-08 4.0E-08 6.0E-08 8.0E-08 1.0E-07 1.2E-07 1.4E-07 1.6E-07 1.8E-07
NRV 1.1&1.2: Passenger risk (2004-2009)
NRV 1.2: FWSI passengers per 100 pax-km NRV 1.1: FWSI passengers per train-km CST [NRV(EU)] for 1.1: 1.70 E-07
Page | 8
Second assessment of the second set in 2013
The second assessment of the second set was carried out by the Agency in early 2013 and delivered to the Commission at the end of March. The assessment was based on a five-year time series (2007–2011) of data on railway casualties that were delivered to Eurostat by Member States according to Annex H to Regulation (EC) No 2003/91 on rail transport statistics. The assessment was made for six risk categories of CSTs and NRVs using the method set by Commission Decision 2009/460/EC (9).
In general, the results of the annual assessment of achievements of CSTs/NRVs indicated that railway safety performance remains acceptable at the EU level for all categories of railway users under consideration. The results further showed other than acceptable safety performance in four Member States, usually for one category of railway users (Table 5). Only in one case the result of the assessment was “probable deterioration of safety performance”. In some cases, the negative result of the assessment was due to poor quality data in years before 2007, used to set up the second set of CSTs. Following the consolidation of data carried out by NSAs at national level, the Agency recommended to the EC to revise certain values of NRVs for Slovakia, Bulgaria and Romania.
Risk category Passengers Employees LC users Others
Unauthorised persons Whole society 1.1 (10) 1.2 (11) 2 3.1 4 5 6 Possible
deterioration Slovakia Slovakia
Romania
Slovakia None Romania
Romania Slovakia Sweden
Romania Probable
deterioration none none Bulgaria None None None None
Table 5: Results of the assessment of achievements of the second set of CSTs/NRVs - other than acceptable
Figure 7 shows the intermediate results of the second assessment of the second set of CSTs/NRVs for the category of whole society. The values of NRVs (second set) are plotted together with the values of OSP (Observed Safety Performance) in 2011 and MWA (Moving Weighted Average Value) for years 2007-2011. To achieve an acceptable safety performance after two steps of the method, the OSP, or MWA have to be lower than the NRV stepped up by 20 %. The OSP value was however higher than NRV in nine countries (NO, SE, FR, IT, BE, SK, BG, RO, PL) and the similar observation was made for MWA value that was higher than NRV in nine countries (NO, IE, SE, IT, BE, SI, SK, RO, PL). It is largely thanks to the application of the 20 % margin that all countries but four showed acceptable safety performance in 2011.
(9) Commission Decision 2009/460/EC on a common safety method for assessment of achievement of safety targets. (10) Scaling base: passenger train-km per year
Page | 9
Figure 7: NRVs, OSP and MWA risk levels for the whole society (second set based on 2004–2009 data)
In the fourth assessment step, a check is made whether the number of significant accidents per train-km, with respect to the previous years, remained stable (or decreased). The criteria for this appraisal are whether there has been a statistically significant increase in the number of relevant significant accidents per train-km. This is evaluated by using an upper Poisson tolerance bound which will determine the acceptable variability based on the number of accidents that occurred in the different Member States.
In the 2011 assessment, all countries but one (Bulgaria) passed this test for all types of significant accidents under consideration. In case of Bulgaria, the number of all significant accidents and the number of accidents caused by rolling stock in motion in 2011 was higher than the number of accidents in previous years.
0.0E+00 5.0E-07 1.0E-06 1.5E-06 2.0E-06 2.5E-06
NRV & MWA 6: Societal risk (2004-2009)
Page | 10
Accident outcomes
Significant accidents
Around 2 400 significant accidents occur each year on the railways of the EU Member States. Accidents to persons caused by rolling stock in motion and level-crossing accidents constitute more than three quarters of the total number of accidents, excluding suicides. The number of significant accidents per accident type in the period 2010–2011 is shown in Figure 8.
For collisions of trains, level crossing accidents and other accidents, the reported number of accidents in 2011 was lower than in the previous year. There was an increase in the number of accidents between 2010 and 2011 for derailments, fires and accidents to persons caused by rolling stock in motion.
On average a derailment or a collision is reported at least every second day in the EU, causing significant disruptions to railway operations.
The Member States reported 1 480 accidents to persons caused by rolling stock in motion in 2011. The risk of this type of accident is relatively high in the three Baltic countries and in some Central and East European countries (Czech Republic, Slovakia, Poland, Romania).
The number of fires in rolling stock reported for 2011 (25) is similar to the number of fires reported in 2010 (23). At least one such fire in rolling was recorded in 11 EU countries in 2011 (compared to 8 in 2010). A wide range of accidents, not included within the specific types of accidents, are included in the category of other accidents. The 129 cases reported in 2011 include collisions and derailments of shunting rolling stock/maintenance machines, dangerous goods released during transport, objects projected by the running train, and electrocution in connection with the rolling stock in motion; the category other accidents is the third largest group of accidents.
Figure 8: Reported number of significant accidents per accident category (2010–2011)
99 95 619 1420 23 145 2401 83 97 528 1480 25 129 2342 0 500 1 000 1 500 2 000 2 500
Collisions of trains Derailments of trains Level-crossing accidents
Accidents to persons caused by rolling
stock in motion
Fires in rolling stock Other accidents Total nr accidents Significant railway accidents (EU-27)
2010 2011
Page | 11
Collision types and their outcomes Total EU Share
Trains collisions 11 13 %
Collisions with obstacles 72 87 %
Persons killed and seriously injured in trains collisions 7 12 %
Persons killed and seriously injured in collisions with obstacles 50 88 %
Table 6: Collisions of trains by type and their outcomes (EU-27 in 2011)
In 2012, the number of collisions and relevant outcomes was reported by type for the first time, on a voluntary basis. Among 83 collisions reported in 2011, only 11 were trains collisions, the remaining 72 collisions involved a train hitting an obstacle within the clearance gauge. The number of casualties per collision type follows a similar pattern, with on average 1 person killed and 6 seriously injured in trains collisions and 50 people killed and seriously injured in collisions with an obstacle (Table 6).
Over the past five years, the number of significant accidents has seen a reduction of 38 % (9.3 % p.a. on average). This is almost twice as much as the reduction achieved for fatalities (22 %) and serious injuries (25 %). The number of significant accidents has reduced in all categories of accidents, with most important reductions in the category of collisions, derailments and fires. The lowest reduction was achieved in the category of accident to persons by rolling stock in motion.
Given the heterogeneous development in the number of significant accidents across the different categories of significant accidents, the relative share of accident types has changed dramatically over the past years. This is shown in Figure 9. The relative share of collisions and derailment dropped from 16 % in 2007 to 8 % in 2011, while the number of accidents involving third parties (LC accidents and accidents to persons) increased from 75 % to 86 %.
Figure 9: Reported number of significant accidents per accident category (2007 and 2011)
7% 9% 31% 44% 3% 7%
2007
4% 4% 23% 63% 1% 6%2011
Collisions of trains Derailments of trains LC accidents Accidents to persons Fires in rolling stock Other accidentsPage | 12
Dangerous goods accidents
When a railway accident involves dangerous goods, whether they are being transported or not, it must be reported under a separate category of accidents: accidents involving dangerous goods. Depending on the type and consequences, an accident involving dangerous goods may also be reported in duplicate as a significant accident. In 2011, Member States reported a total of 28 accidents involving dangerous goods; in nine of these, the transported dangerous goods were released during the accident. The 28 accidents involving dangerous goods occurred in 11 EU countries.
Dangerous goods accidents 2010 2011
Number of accidents involving at least one railway vehicle transporting dangerous
goods in which dangerous goods are NOT released 17 19
Number of accidents involving at least one railway vehicle transporting dangerous
goods in which dangerous goods ARE released 37 9
Total number of accidents involving at least one railway vehicle transporting
dangerous goods 54 28
Page | 13
Casualties from significant accidents
In parallel with the decrease in railway accidents, the total number of casualties, excluding suicides, has fallen steadily in recent years. There were 1 183 fatalities reported for the year 2011, a six per cent decrease from the previous year (1 256 fatalities recorded in 2010). The number of passenger casualties (fatalities and serious injuries) fell down to the pre-2010 level, with 38 passenger fatalities in 2011. The unusually high number of fatalities among train passengers in 2010 was largely driven by the outcome of one single occurrence, the collision of trains in Belgium on 15 February 2010 that alone led to 19 fatalities and 35 serious injuries.
Figure 10: Number of fatalities per victim category (2010–2011)
Figure 10 shows the number of fatalities in different categories of persons over the period 2010–2011. With 797 fatalities in 2011, unauthorised persons represented 67 % of all persons killed on railway premises. The number of level-crossing fatalities of 294 in 2010 is by far the lowest ever recorded on EU railways. This figure represents 25 % of railway fatalities, but only 1.1 % of road-user fatalities. Level crossing safety might therefore be perceived as a marginal problem by the road sector, while it is a key problem for the railway - also because of its impact on railway operation.
Figure 11: Relative share of fatalities per victim category among railway and all fatalities (2009–2011)
62 44 359 750 41 1 256 38 29 294 797 25 1183 0 200 400 600 800 1 000 1 200 1 400
Passengers Employees Level crossing users Unauthorised persons Other persons Total persons Fatalities in railway accidents (EU-27)
2010 2011 3% 3% 28% 63% 3% 1% 1% 9% 19% 1% 69%
Railway fatalities per victim category
Passengers Employees Level crossing users Unauthorised persons Other persons Suicides
Page | 14
Suicides are reported separately from accident fatalities. They represent 69 % of all fatalities on railways and, together with the unauthorised person fatalities, constitute 88 % of all fatalities occurring within the railway system (period 2009-2011). In 2011, on average 8 suicides were recorded everyday on the EU railways, totalling 2 868, a record number since 2006. Several Central and Eastern European countries registered a significant increase of railway suicide fatalities in 2011; only seven EU countries saw their suicide figures falling in 2011.
Figure 11 shows that if we exclude suicide fatalities, the majority of fatalities are unauthorised persons. Level-crossing accidents account for 25 % of fatalities, whereas passenger and employees fatalities make up 6 % of the total number of deaths on railways. People strictly internal to railway operation (passengers, employees and other persons) represent only three per cent of persons killed on EU railways.
Figure 12: Fatalities on EU railways per year and victim category (2006-2011)
Figure 12 shows that although the total number of fatalities on EU railways has been steady since 2007 (with around 4 000 fatalities in total), there has been an increase in the number of suicide fatalities. Suicide and unauthorized user fatalities accounted for 84 % of all fatalities in 2007; their share has increased to 90 % in 2011. Victims not inherent to the railway system (suicides, unauthorized persons and level crossing users) make up 98 % of railway fatalities.
Over and above the number of fatalities, a large number of persons are seriously injured each year on the railways. Over the past five years, for each 10 persons killed, Member States reported some nine seriously injured persons. This ratio, illustrating the seriousness of accidents, has been constant over time, with the exception of 2009, in which there were only eight seriously injured per 10 persons killed in significant railway accidents.
In 2011, 1 032 persons were seriously injured, a decrease of 204 over 2010 when 1 236 serious injuries were reported (Figure 13). The numbers of injured passengers and level crossing users reported for the period 2010-2011 show variations beyond what might be expected from natural fluctuation).
366 504 380 405 359 294 940 855 928 852 750 797 1874 2622 2422 2773 2743 2868 0 500 1000 1500 2000 2500 3000 3500 4000 4500 2006 2007 2008 2009 2010 2011
Fatalities in railway accidents by category of victim (EU-27)
Suicides Other persons Unauthorised persons Level crossing users Employees Passengers
Page | 15
Figure 13: Number of serious injuries per victim category (2010–2011)
The decrease in the number of casualties (fatalities and serious injuries) in recent years is promising, especially in the categories of passengers, employees and other persons, who are all users internal to railway system. At the same time, the trend in the number of unauthorized person casualties is a cause of concern. Over the past five years, there were 11 fatalities per 10 seriously injured persons on EU railways. Persons being hit by a train are the users most likely to die. There are almost two killed trespassers per one seriously injured trespasser. Among all railway users, passengers are most likely to survive in significant accidents. Passenger fatalities represent only one fifth of all railway casualties. Analysing the seriousness of injuries over time does not reveal any significant trends since 2006.
Figure 14: Seriousness of injury in significant accidents: fatalities per seriously injured (2007-2011)
354 93 327 409 53 1236 217 74 273 433 35 1032 0 200 400 600 800 1 000 1 200 1 400
Passengers Employees Level crossing users Unauthorised persons Other persons Total persons Serious injuries in railway accidents (EU-27)
2010 2011 0 0.2 0.4 0.6 0.8 1 1.2 1.4 1.6 1.8 2
Passengers Employees Other persons Level crossing users
Unauthorised persons
Total persons
Page | 16
Precursors to accidents
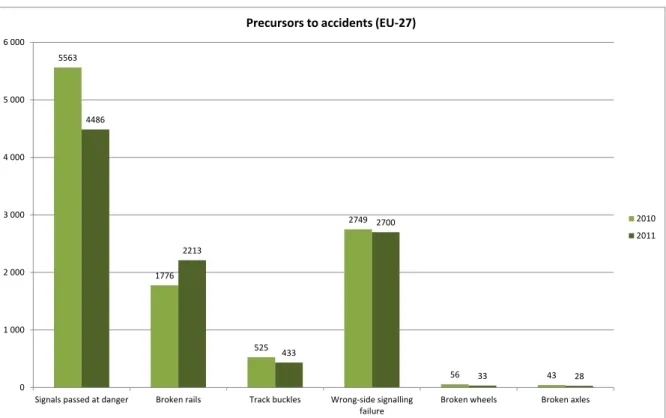
As accidents on railways are rare, the monitoring of less serious events occurring on railways is an essential tool of a proactive SMS. ‘Precursors to accidents’ are indicators of incidents that under other circumstances could have led to an accident. The indicators reported to the Agency are: broken rails, track buckles, signals passed at danger, wrong-side signalling failures, broken wheels and broken axles (Figure 15).
Over the period 2010–11, EU countries reported as many as 20 650 precursors to accidents; this is a ratio of more than four precursors to one significant accident. However, if we discard accidents to persons caused by rolling stock in motion, the ratio between the precursors and accidents rises to 11:1. This unveils the great potential benefit in analysing precursors in the proactive monitoring of railway safety.
Signal passed at danger is the most common type of accident precursors; it is also a precursor for which the highest absolute reduction has been registered in 2011. The most important reduction has been however achieved for the category of broken wheels and broken axles (a 40 % year-to-year reduction when taken together).
Figure 15: Reported number of precursors in 2010-2011 (EU-27 countries and Norway)
Signals passed at danger is also the most commonly investigated type of incidents as shown by the overview of the number of incidents investigations carried out by NIBs (Table 8). In the past three years (2008-2012), there were on average 13 SPADs investigated by NIBs, compared to 6 other types of incidents for which an investigation has been carried out by a NIB.
Incident 2006 2007 2008 2009 2010 2011 2012
SPAD 4 3 6 16 13 14 15
Other 2 0 4 7 4 8 9
Table 8: Number of incidents investigated by NIBs (2006-2012)
5563 1776 525 2749 56 43 4486 2213 433 2700 33 28 0 1 000 2 000 3 000 4 000 5 000 6 000
Signals passed at danger Broken rails Track buckles Wrong-side signalling failure
Broken wheels Broken axles Precursors to accidents (EU-27)
2010 2011
Page | 17
Level crossing safety
Level crossings constitute a significant safety concern. In recent years, on average, every day, one person has been killed and close to one seriously injured at level crossings in Europe. This is shown in Figure 16 that summarizes the development of level crossing accident casualties since 2007.
Figure 16: Development of casualties in level crossing accidents (EU-27)
Level crossing accidents and fatalities represent more than one fourth of all railway accidents on EU railway. However, level crossing fatalities make up only one per-cent of all road deaths. While level crossing safety has been traditionally viewed as a road safety problem by railway infrastructure managers, road authorities often struggle to address the problem in relation to other urgent road safety problems they seek to address. The concept of shared and delegated responsibility often fails to deliver the targeted results when it comes to level crossing safety and may need to be revised at both EU and national level.
Figure 17: Share of fatalities in level crossing accidents in all other railway and road accidents (2009-2011)
There has been a sound reduction in level crossing accident fatalities in recent years; level crossing user deaths have been decreasing by 5.7 % per year on average. However, the reductions in the number of deaths in all other types of railway and road accidents have been even more significant; their numbers have been decreasing at an average annual rate of 6.3 and 8.0 % respectively.
545 389 410 372 300 550 446 332 360 304 0 100 200 300 400 500 600 2007 2008 2009 2010 2011
Casulties in level crossing accidents (EU-27)
Fatalities Serious Injuries
Passengers 3% Employees 3% Level crossing users 28% Unauthoris ed persons 63% Others 3% Railway fatalities (2009-2011) Level crossings 1% All roads except LCs 99% Road fatalities (2009-2011)
Page | 18
Fatalities by type 2006 2007 2008 2009 2010 2011 % change p.a.
LC fatalities 366 504 380 405 359 294 5.7 %
All other railway
fatalities 1105 1013 1099 980 897 897 6.3 %
All other road fatalities 42 700 42 000 38 550 34 400 30 500 30 200 8.0 %
Table 9: Development in level crossing accident fatalities compared to all other types of accidents (EU-27)
The fatality risk at level crossings in EU countries was estimated for the period 2009-2011 and the countries were ranked in Figure 18. The difference in risk between the countries with the smallest fatality risk at level crossings (United Kingdom with 19 deaths per billion train km) and the country with the highest level of risk (Greece with 537 deaths per billion train km) is huge, there is a 28 fold difference in the estimated risk of fatality at level crossings. The variance in risk remains significant, even if we disregard the 10th percentiles of countries with highest and lowest risk levels.
Figure 18: Fatality risk at level crossings: Level crossing fatalities per million train-km (2009-2011)
The estimation of trends in accidents and other outcomes for EU countries reveals that while the number of significant accidents on level crossings has been decreasing at a steady pace since 2006 (by 15 per cent per year on average), the number of casualties (fatalities and serious injuries taken together) was almost constant. At the same time, casualties on railways have been decreasing by about 4 % per year, on average. In other words, while there has been a marked reduction in level crossing accidents (and casualties) over the past five years, this reduction disappears when one looks at the development in railway casualties. This finding is surprising; one would expect a strong correlation between the trend in the number of accidents and related casualties. Possible causes of this discrepancy include poor reporting practice and a sudden increase in the seriousness of LC accidents. A longer time series is needed to confirm the estimated trends in order to draw clearer conclusions.
One can assess the level of risk at LCs alongside progress in its reduction in different EU countries. This analysis is limited to 21 countries, for which the relevant data (casualties, train-km) were available for the whole period under consideration (2006-2010). In Figure 19, KSI risk (number of killed and seriously injured people in LC accidents per million train kilometres) for the past three years (2008-2010) is plotted horizontally against the estimated average annual percentage change in LC casualties. The EU averages of the two indicators are used to divide the diagram into four quadrants. Three countries with the highest annual
0.0 0.1 0.2 0.3 0.4 0.5 0.6
Page | 19 number of train-km (Germany, United Kingdom and France) appear in the left-hand part of the graph among countries with lower than average casualty risk at LCs, weighting heavily on the EU average. Only France, Germany, Denmark and Sweden achieved lower than average KSI risk after higher than average reductions in KSI risk. The graph also shows that there is no correlation between the level of casualty risk and the trend in risk.
The estimated values of the annual average percentage change in Figure 19 are sensitive to sudden changes in the number of casualties, behaving as random variables. A longer time series of data would be needed to assess the trend with a higher degree of reliability.
Figure 19: Casualty risk (killed and seriously injured per million train kilometres) versus average annual percentage change in casualty risk from 2006 to 2011
With about 50 accident investigations into LC accidents by NIBs per year, not even one tenth of all fatal LC accidents are subject to independent investigation. In many cases, these investigations do not seek root and underlying causes, significantly limiting their value. Although these investigations cost money, it is a worthwhile investment, if we consider the costs to society of these accidents.
Infrastructure managers (IMs) of EU countries regularly issue statements that about 95 % of LC accidents are caused by LC users, who break (road traffic) rules, either intentionally or unintentionally. The liability is then often confused with responsibility, being quite a different issue. When an in-depth accident investigation into a LC accident is carried out, problems are frequently identified with specific safety barriers. Moreover, not all IMs apply a holistic and analytical approach for LC safety improvements.
AT BE BG CZ DE DK EE ES FI FR HU IE IT LT LV NL NO PL PT RO SE SI SK UK EU -25 -20 -15 -10 -5 0 5 10 15 20 0 0,2 0,4 0,6 0,8 1 1,2 A ve rag e an n u al p e rc e n tage ch an ge in KS I p e r t rai n -km (2006 -2011)
Page | 20
Railway suicides
Railway suicides are persons recorded and classified as suicide by competent national authorities. While the classification approach is mature in most Member States, some incertainty prevails in a few countries, where some suicide fatalities may be confused with trespasser fatalities.
The number of suicide fatalities continues to rise across the EU. Every year, more than 2 500 suicide fatalities and additional 800 trespasser fatalities occur on EU railways (Figure 25). While accounting for 8 % of all suicides, the societal impact of suicides on railways remains considerable. The consequences are not only trauma for all parties involved, but also significant costs incurred by delays, deployment of rescue services, loss of productivity or employees involved etc..
On average, railway suicides account for 8 % of all suicides across the EU. Only in the Czech Republic, Germany, the Netherlands and Slovakia is their share higher than 10 %. In Greece, Ireland, Poland and Romania, the share of railway suicide as a proportion of all suicides is below 1 %. This may be due to the relatively small railway network and low density of population.
Figure 20: Suicide and unauthorized person fatalities (EU 27 in 2006-2011)
Railway suicides, and more generally, all suicides are relatively well correlated with unemployment rates. This may partly explain an increase in railway suicide fatalities in 2007 and 2009, visible at EU level. This correlation is however not traceable anymore at country level.
Railway suicides are relatively common on EU railways: there were 700 suicides per billion train-km on average in the past three years. The railway suicide rate is highest in the Netherlands, followed by Portugal, Hungary and the Czech Republic. In these four countries, the suicide rate is above one suicide per million train kilometres. 1874 2622 2422 2773 2743 2868 940 855 928 852 750 797 0 500 1000 1500 2000 2500 3000 3500 4000 2006 2007 2008 2009 2010 2011
Suicide and trespasser fatalities (EU-27)
Page | 21
Figure 21: Suicide rates: number of suicide fatalities per million train kilometres (EU 27 in 2009-2011)
The costs of delays due to suicides (and trespasser fatalities) represent a significant share of total costs of delays incurred to railway undertakings. It typically takes up to 2 hours to open a railway line when a person is struck by a train. This is a significantly longer time compared to delays caused by some technical failures.
0 0.2 0.4 0.6 0.8 1 1.2 1.4
Page | 22
Safety and market opening
Setting up a common safety regulatory framework for the EU is a part of the wider EU policy to create more efficient railway market in Europe. Gradual opening of national railway markets carries inherent safety risks that are being addressed by the provisions of EU safety legislation. The two figures below seek to shed light on the impact of market opening on safety at country level.
The measurement of the degrees of market opening is relatively complex and any benchmark proposed would inevitably have its limitation. However, one measurement index, the rail liberalization index, has recently gained recognition and acceptance by railway community. The index has been produced by IBM Global Business Services (12) since 2002. It reflects legal and de facto barriers to market access from the perspective of an external railway undertaking seeking access. It reflects the market shares of external RUs active in addition to the incumbent as a practical consequence of existing barriers to open market.
The fourth edition of the index published in 2011 benchmark the rail market opening of MSs as of 1st January 2011 and ranks countries from those most advanced to those delayed in terms of rail market opening. Three categories of countries are considered based on the value of the index: six countries are considered as delayed, 15 countries on schedule and six countries advanced, in terms of rail market opening.
The IBM rail liberalization index is plotted against the casualty risk for passengers and employees in Figure 22. While it is impossible to find a correlation between the two variables, it appears that countries from advanced group have lower casualty risk than the countries in the two other groups.
Figure 22: Fatality risk versus rail liberalization index (IBM 2011) for EU countries
(12) Rail liberalization index 2011, IBM Germany with Prof. Kirschner, Deutsche Bahn, 2011 RO DE EE PL SE UK AT SI IT LT EL LV HU FI FR IE LU ES NL DK SK BG PT CZ NO IT
Page | 23 A separate look at the development of railway safety in the advanced group of countries as compared to all other countries confirms that there are no significant differences in trends in casualty risk for passengers and employees in countries with a higher liberalization index.
Figure 23: Fatality risk versus rail liberalization index (IBM 2011) for EU countries 0 0.2 0.4 0.6 0.8 1 1.2 2006 2007 2008 2009 2010 2011 Cas u alt ie s (f at alit ie s an d se riou s in ju rie s)
Railway casulties vs Rail Liberalization Index (IBM)
Page | 24
Accident costs
The data on the cost of accidents show a wide variation over time and between countries. It is also evident that Member States continue to have problems in establishing reporting regimes for this set of CSIs.
The economic impact of significant accidents in 2011 is shown in Figure 24. It has five components: Costs of fatalities, cost of injuries, costs of material damage, costs of damage to the environment and costs of delays. While the first two components are available for all countries, the number of countries providing information on the costs of damage to infrastructure, to the environment and delays is limited.
Societal costs of casualties represent the majority of costs of significant accidents. For countries that reported costs for all five categories of costs is their share 73 % (Austria) and higher.
By adding together the costs of fatalities and of serious injuries, we obtain a value exceeding EUR 2.5 billion, which gives a broad idea of the overall economic burden of rail casualties in 2011. Other reported costs of accidents for all EU countries account for little more than EUR 200 million.
Figure 24: Economic impact of significant accidents in 2011 (in million EUR)
The significant accident costs of material damage to rolling stock and infrastructure per train-km are relatively high in Norway, Austria, the Netherlands and Poland (more than EUR 100 per 1 000 train-km).
Page | 25
Safety of infrastructure
Three CSIs concern railway infrastructure, the first is a measure of the coverage of automatic train protection (ATP) systems on the lines (Figure 25); the second is the number of level crossings (Figure 26), normalised by the length of the network expressed in track kilometres; and the third gives information on the type of protection at level crossings (Figure 27).
ATP (13) systems is widely considered to be the most effective railway safety measure that infrastructure managers can implement to reduce the risk of collisions on mainline railways (14). A relatively high density of train protection is typical in countries with high traffic density such as the Netherlands, Italy and Germany. This can be seen in Figure 25.
The percentage of tracks equipped with an ATP system has seen a marked increase of 2 % from 2010 to 2011 (15). This was largely driven by progress in ATP implementation achieved by France, Latvia, Sweden and Norway. However, the data seem to be reported in an inconsistent manner across the EU, reducing their comparability.
Figure 25: Percentage of tracks equipped with automatic train protection (2009–2011)
There were 114 615 level crossings in the EU countries in 2011.On average, there are five level crossings per 10 line-km in the EU; only 24 % of them are active level crossings with user-side protection (16). Sweden, Austria, the Czech Republic, the Netherlands and Norway have the highest density of level crossings in terms of level crossings per line-kilometre. Of these, the Netherlands has the highest ratio of active level crossings to all level crossings. A low ratio of active level crossings to all level crossings is typical for the less densely populated countries (Figure 26).Spain has the lowest average number of level crossings per line-kilometre: there is one level crossing per 5 line-km.
(13) Automatic train protection (ATP) means a system that enforces obedience to signals and speed restrictions by speed supervision, including automatic stop at signals. Systems where track signalling information is substituted and/or supplemented by cab signalling are included. The part of the definition relating to ‘automatic stop at signals’ is intended to include also automatic stops at conflict points between clearance gauges.
(14) Interfleet (2011). Investigating the links between historic accident rate reduction and the underlying changes, Report prepared for ERA in 2011. Report can be downloaded from the ERA website.
(15) Estimate for EU-27 countries excluding France and Denmark. (16) Protection is typically provided by arm barriers.
AT BE BG CT CZ DE DK EE EL ES FI FR HU IE IT LT LU LV NL NO PL PT RO SE SI SK UK 2009 67.9 11.0 11.0 100. 17.0 90.0 22.8 0.0 87.4 83.0 47.2 5.0 92.4 34.9 100. 46.4 99.0 74.0 0.0 51.3 48.3 64.0 67.0 18.5 4.2 2010 72.6 11.0 11.0 100. 0.0 93.2 53.0 23.6 0.0 88.4 82.0 52.3 5.0 100. 37.9 100. 47.7 98.0 70.0 0.0 52.6 97.8 65.5 67.0 21.0 4.2 2011 82.0 11.0 11.0 100. 94.3 53.0 23.7 0.0 86.0 82.0 52.3 54.0 5.0 100. 37.3 100. 66.0 96.0 74.0 0.0 58.6 97.5 81.2 67.0 21.0 4.2 0 10 20 30 40 50 60 70 80 90 100
Page | 26
Figure 26: Number of active and passive level crossings per 100 line-km in 2011
Detailed statistics are available on the type of active level crossings at European level. In Figure 27, the data for EU countries (17) show that level crossings with automatic user-side protection and warning (barriers with lights) (34 %) are the most common type of active crossings (24 %), followed by the level crossings with user-side warning (11 %). Passive (unprotected) level crossings represent 53 % of all level crossings in the EU.
Figure 27: Breakdown of active level crossings according to the level of protection in 2011 (EU countries)
(17) EU-27 countries excluding Denmark and France
AT BE BG CT CZ DE DK EE EL ES FI FR HU IE IT LT LU LV NL NO PL PT RO SE SI SK UK Passive LCs per line-km 55 8 4 0 49 21 18 19 19 11 51 12 36 50 7 9 12 8 21 0 44 23 20 73 45 0 32 Active LCs per line-km 33 46 17 0 40 31 22 18 32 7 14 31 33 13 27 22 39 24 67 88 27 16 9 30 28 0 11
0 20 40 60 80 100 120 Avera ge ni um ber of lev el cros sing s (LC s) per 1 0 li ne kil om et er s
Number of level crossings (LCs) per 100 line kilometers (2011)
11% 1%
23%
4% 8% 53%
Level crossings per type (EU-27 excluding FR and DK in 2011)
with automatic user-side warning
with automatic user-side protection
with automatic user-side protection and warning
with automatic user-side protection and warning, and rail-side protection with manual user-side warning and/or protection
Page | 27
Traffic volumes
The number of train-kilometres continued to rise in 2011, with a 2 % annual increase at the EU level. The number of freight train-km increased by 6 % between 2010 and 2011. At the same time, the number of passenger-kilometres reported in 2011 is similar to that of 2009 and 2010: slightly less than 400 billion train-km. The average number of passengers per train was 122 in Europe in 2011; i.e. the ratio of number of passenger-kilometres to passenger train-kilometres.
Figure 28: Number of million train-kilometres (2009–2011)
Germany is the country with the highest number of train-kilometres, accounting alone for one quarter of all train-kilometres in the EU.
Figure 29: Relative change in the number of train-kilometres between 2007 and 2011 (Train-km in 2011 / Train-km in 2007) AT BE BG CT CZ DE DK EE EL ES FI FR HU IE IT LT LU LV NL NO PL PT RO SE SI SK UK 2009 152.3 91.87 31.49 5.652 163.1 1002. 82.15 6.820 19.61 188.1 50.01 504.0 106.2 18.18 350.5 14.05 8.063 18.72 132.0 43.27 208.6 40.58 88.50 143.0 18.20 44.95 568.5 2010 156.1 98.00 30.63 5.714 160.1 1032. 83.08 8.934 16.96 186.7 51.00 484.7 97.40 17.69 323.9 14.13 8.161 16.62 146.2 46.46 219.0 40.00 93.52 141.3 18.84 47.53 520.0 2011 152.2 100.5 31.24 5.600 160.6 1063. 84.78 7.000 12.53 191.3 51.07 501.5 110.2 18.05 317.3 15.32 8.861 18.47 160.5 45.85 227.3 37.20 104.2 140.3 20.33 45.38 528.4 0 200 400 600 800 1 000 1 200
Train kilometres (million)
0.00 0.20 0.40 0.60 0.80 1.00 1.20 Train-km in 2011 / Train-km in 2007
Page | 28 Looking at figures for passenger train-kilometres and freight train kilometres separately allows identification of countries with important share of freight train traffic (three Baltic countries, Slovenia and Poland). At the level of Union, passenger traffic represented 80 % of all train-kilometres in 2011. The share of passenger train-kilometres exceeded 90 % in Ireland, Denmark, Greece, the UK and the Netherlands (Figure 30).
Figure 30: Percentage of passenger train-kilometres among all train-kilometres in 2010 in all countries
Four countries with the highest passenger volumes (Germany, France, Italy and the UK) together account for two thirds of all passenger-kilometres. In two of them (Germany and the UK), have passenger volumes been increasing over the past three years, as shown in Figure 31.
Figure 31: Number of million passenger-kilometres (2009–2011)
0% 10% 20% 30% 40% 50% 60% 70% 80% 90% 100%
Passenger train-km among all train kilometres (2011)
10 5 00 10 4 93 2 14 4 6 47 2 81 6 12 6 38 9 232 1 41 4 21 7 29 3 87 6 83 2 60 7 94 5 1 68 1 46 4 26 357 333 747 16 8 00 2 99 6 18 5 77 4 15 2 6 177 11 2 16 840 2 24 7 52 7 65 10 7 00 10 4 93 2 10 0 497 6 55 3 83 7 02 6 58 7 1 14 4 20 9 78 3 95 9 81 7 50 7 66 6 1 67 8 43 4 74 373 350 741 16 6 21 3 15 3 17 8 00 4 11 1 5 50 0 11 0 36 813 2 29 1 55 8 31 10 9 00 9 49 4 2 06 7 506 6 75 0 85 0 35 6 88 9 393 958 21 3 99 3 88 2 82 7 50 7 79 5 1 63 9 41 3 26 389 354 733 16 8 92 3 03 6 18 0 49 4 14 3 5 14 1 11 4 34 773 2 42 8 56 0 59 0 10 000 20 000 30 000 40 000 50 000 60 000 70 000 80 000 90 000 AT BE BG CT CZ DE DK EE EL ES FI FR HU IE IT LT LU LV NL NO PL PT RO SE SI SK UK Passenger kilometres (million)
2009 2010 2011 EU (80 %)
Page | 29
Railway transport operation efficiency
The operational efficiency of railway transport can be implicitly expressed by a simple ratio of passenger kilometres per passenger train kilometres and freight tonne kilometres per freight train kilometres.
Passenger trains
The theoretical average passenger train load in the EU-27 was 122 passengers in 2011 (1 % increase compared to 2010). The average passenger train load appears to be primarily a function of country size; Romania, Estonia and Latvia are an exception to this rule. Given the limits of international passenger traffic across Europe, the share of domestic long-distance services is the most important factor here.
Figure 32: Passenger kilometres per passenger train kilometres in 2011
In case of passenger rail traffic, France together with Italy has the highest ratio of theoretical average train occupancy, with more than 150 passengers travelling on board of an average passenger train. The theoretical average train occupancy is lowest in Luxembourg, Czech Republic and Romania. The ratio is a function of prevalent types of services operated in the given country, as well as of its geographical aspects. Yet, different positions of countries with huge number of similarities (Baltic countries, Nordic countries) in the ranking presented in Figure 32 is surprising and may be pointing to differences in operational arrangements and minimum public service strategies.
Freight trains
The average load ratio for freight trains on European railways gives only a very limited idea about the efficiency of freight train operations, since it is a function of the load mix transported. Raw materials represent a high proportion of transported goods in Baltic countries and in some Central European countries, leading to a relatively high theoretical average load ratio (Figure 33). A high degree of interoperability of railway systems of Baltic countries and the Russian one contributes to their relative outperformance.
0 20 40 60 80 100 120 140 160 180 200 FR IT PT ES EE PL SE LV NL UK BE FI AT DE IE HU BG NO DK EL SK LT SI RO CZ LU
Passenger kilometers per passenger train-km (2011)
Page | 30
Figure 33: Freight tonne kilometres per freight train kilometres in 2011
0 500 1000 1500 2000 2500 3000 3500 EE LV LT SK HU CZ RO LU PL UK FI DK CT SE AT NL IT NO FR SI DE EL PT ES IE BG BE
Freight tonne kilometers per freight train-km (2011)
Page | 31
Independent accident investigation
Every year, more than 200 of accidents and incidents are investigated by NIBs of MSs. This number has been slightly increasing in time in recent years, since more and more NIBs decide to open an investigation into other than serious accidents. The number of serious railway accidents investigated by NIBs has been stable since 2007 with some 40 serious accidents into which a NIB investigation started (Figure 34).
Figure 34: Serious railway accidents investigated by NIBs together with the resulting casualties (EU-27)
A detailed look into the type of serious accidents investigated by NIBs shows that level crossing accident is the most commonly investigated type of serious accidents, followed by train derailment and train collisions (Figure 35).
Figure 35: Serious accidents investigated by NIBs per type of accident (EU-27 countries in 2006-2012)
34 42 38 30 36 42 42 0 50 100 150 200 250 2006 2007 2008 2009 2010 2011 2012
Serious railway accidents investigated by NIBs with resulting casualties
Fatalities Serious Injuries Accidents
0 5 10 15 20 25 30 35 40 45 2006 2007 2008 2009 2010 2011 2012
Serious accidents investigated by NIBs per type of accident
Other Fire in RS LC accident Accident to person Train derailment Train collision with obstacle