Durham Research Online
Deposited in DRO:
18 June 2020
Version of attached le:
Published Version
Peer-review status of attached le:
Peer-reviewed
Citation for published item:
Warnat-Herresthal, Stefanie and Perrakis, Konstantinos and Taschler, Bernd and Becker, Matthias and
Ba
ß
ler, Kevin and Beyer, Marc and Gunther, Patrick and Schulte-Schrepping, Jonas and Seep, Lea and Klee,
Kathrin and Ulas, Thomas and Haferlach, Torsten and Mukherjee, Sach and Schultze, Joachim L. (2020)
'Scalable prediction of acute myeloid leukemia using high-dimensional machine learning and blood
transcriptomics.', iScience., 23 (1). p. 100780.
Further information on publisher's website:
https://doi.org/10.1016/j.isci.2019.100780
Publisher's copyright statement:
c
2020 The Authors.This is an open access article under the CC BY-NC-ND license
(http://creativecommons.org/licenses/by-nc-nd/4.0/).
Additional information:
Use policy
The full-text may be used and/or reproduced, and given to third parties in any format or medium, without prior permission or charge, for personal research or study, educational, or not-for-prot purposes provided that:
• a full bibliographic reference is made to the original source
• alinkis made to the metadata record in DRO
• the full-text is not changed in any way
The full-text must not be sold in any format or medium without the formal permission of the copyright holders. Please consult thefull DRO policyfor further details.
Durham University Library, Stockton Road, Durham DH1 3LY, United Kingdom Tel : +44 (0)191 334 3042 | Fax : +44 (0)191 334 2971
Article
Scalable Prediction of Acute Myeloid Leukemia
Using High-Dimensional Machine Learning and
Blood Transcriptomics
Clinically
Key features
100 %
training samples
Accuracy
9 algorithms
Gene expression data
12,029 patients
105 studies
3 technologies
relevant scenarios
High-dimensional
- high accuracy
- highly scalable
- platform independent
- incremental learning
machine learning
Transcriptomic-based machine learning
to assist primary diagnosis of AML
potential
Stefanie
Warnat-Herresthal,
Konstantinos
Perrakis, Bernd
Taschler, ...,
Torsten Haferlach,
Sach Mukherjee,
Joachim L.
Schultze
[email protected] (S.M.) [email protected] (J.L.S.) HIGHLIGHTSStudy presents one of the largest transcriptomics datasets to date for AML prediction
Effective classifiers can be obtained by high-dimensional machine learning
Accuracy increases with dataset size
Includes challenging scenarios such as study and cross-technology
DATA AND CODE AVAILABILITY GSE122517 GSE122505 GSE122511 GSE122515 Warnat-Herresthal et al., iScience23, 100780 January 24, 2020ª2020 The Authors. https://doi.org/10.1016/ j.isci.2019.100780
Article
Scalable Prediction of Acute Myeloid
Leukemia Using High-Dimensional
Machine Learning and Blood Transcriptomics
Stefanie Warnat-Herresthal,
1,6Konstantinos Perrakis,
2,6Bernd Taschler,
2Matthias Becker,
4Kevin Baßler,
1Marc Beyer,
3,4Patrick Gu¨nther,
1Jonas Schulte-Schrepping,
1Lea Seep,
1Kathrin Klee,
1Thomas Ulas,
1Torsten Haferlach,
5Sach Mukherjee,
2,7,*
and Joachim L. Schultze
1,4,7,8,*
SUMMARY
Acute myeloid leukemia (AML) is a severe, mostly fatal hematopoietic malignancy. We were inter-ested in whether transcriptomic-based machine learning could predict AML status without requiring expert input. Using 12,029 samples from 105 different studies, we present a large-scale study of ma-chine learning-based prediction of AML in which we address key questions relating to the combination of machine learning and transcriptomics and their practical use. We find data-driven, high-dimensional approaches—in which multivariate signatures are learned directly from genome-wide data with no prior knowledge—to be accurate and robust. Importantly, these approaches are highly scalable with low marginal cost, essentially matching human expert annotation in a near-automated workflow. Our results support the notion that transcriptomics combined with machine learning could be used as part of an integrated -omics approach wherein risk prediction, differential diagnosis, and subclassifi-cation of AML are achieved by genomics while diagnosis could be assisted by transcriptomic-based machine learning.
INTRODUCTION
Recommendations for the diagnosis and management of malignant diseases are organized by interna-tional expert panels. For example, the first edition of the European LeukemiaNet (ELN) recommendations for the diagnosis and management of acute myeloid leukemia (AML) in adults was published in 2010 ( Do¨h-ner et al., 2010) and recently revised in 2017 (Do¨hner et al., 2017). Based on recent DNA sequencing results, such as those derived from The Cancer Genome Atlas, AML can be subdivided into multiple subclasses (Arber et al., 2016; Ding et al., 2012; Ley et al., 2008, 2010; Loriaux et al., 2008; Papaemmanuil et al., 2016; The Cancer Genome Atlas Research Network (TCGA) et al., 2013; Welch et al., 2012; Yan et al., 2011). Leukemias are characterized by strong transcriptomic signals, as seen in a pioneering study almost two decades ago by Golub et al. (Golub et al., 1999) and a rich body of subsequent work (Debernardi et al., 2003; Kohlmann et al., 2003; Ross et al., 2004; Schoch et al., 2002; Virtaneva et al., 2001). These findings led to the suggestion that gene expression profiling (GEP) could be utilized to define leukemia subtypes and derive useful predictive gene signatures (Andersson et al., 2007; Bullinger et al., 2004). Nevertheless, ac-cording to the ELN recommendations primary diagnosis still relies on classical approaches including assessment of morphology, immunophenotyping, cytochemistry, and cytogenetics (Do¨hner et al., 2017). Although undoubtedly effective in detecting disease, these existing diagnostic approaches rely on large investments in human expertise (training and employment of specialists) and physical infrastructure, whose costs scale with the number of samples. This has implications for accessibility (e.g., in rural areas or outside developed regions) and on cost and logistical grounds alone limits the scope to consider alternatives to the overall decision pipeline. In contrast to classical diagnostic pipelines that are centered on interpretation of results by human experts, artificial intelligence- (AI) and machine learning- (ML) based approaches have the potential for low marginal cost (i.e., cost per additional sample once the system is trained) (Esteva et al., 2017), and this key aspect of AI and ML is widely appreciated in the economics literature (see, e.g.,Brynjolfsson and McAfee, 2014).
The potential of GEP for leukemia diagnosis has been recognized. A decade after the pioneering work of Golub et al., the International Microarray Innovations in Leukemia Study Group proposed GEP by micro-array analysis to be a robust technology for the diagnosis of hematologic malignancies with high accuracy
1LIMES-Institute, Department
for Genomics and Immunoregulation, University of Bonn, Carl-Troll-Str. 31, 53115 Bonn, Germany
2Statistics and Machine
Learning, German Center for Neurodegenerative Diseases, Venusberg-Campus 1, Building 99, 53127 Bonn, Germany 3Molecular Immunology in Neurodegeneration, German Center for Neurodegenerative Diseases, Venusberg-Campus 1, Building 99, 53127 Bonn, Germany
4PRECISE Platform for Single
Cell Genomics and Epigenomics, German Center for
Neurodegenerative Diseases and the University of Bonn, Venusberg-Campus 1, Building 99, 53127 Bonn, Germany 5MLL, Mu¨nchner Leuka¨mielabor GmbH, Max-Lebsche-Platz 31, 81377 Mu¨nchen, Germany
6These authors contributed
equally
7These authors contributed
equally 8Lead Contact *Correspondence: [email protected] (S.M.), [email protected] (J.L.S.) https://doi.org/10.1016/j.isci. 2019.100780
(Haferlach et al., 2010). The utility of GEP by RNA sequencing (RNA-seq) has been also demonstrated for other tumor entities, for example, breast cancer (Ciriello et al., 2015; Kristensen et al., 2012; Parker et al., 2009), bladder cancer, or lung cancer (Hoadley et al., 2014; Robertson et al., 2017). Furthermore, in AML research large RNA-seq datasets have been described in the meantime (Garzon et al., 2014; Lavallee et al., 2016; Lavalle´e et al., 2015; Macrae et al., 2013; Pabst et al., 2016).
In parallel, a series of advances in ML, AI, and computational statistics have transformed our understanding of prediction using high-dimensional data. A variety of approaches are now an established part of the tool-kit, and for some models (including sparse linear and generalized linear models), there is a rich mathemat-ical theory concerning their performance in the high-dimensional setting (Bu¨hlmann and van de Geer, 2011). In a nutshell, the body of empirical and theoretical research has shown that learning predictive models over large numbers of variables is often feasible and remarkably effective. In applied ML, there has been a deepening understanding of practical issues, e.g., relating to the transferability of predictions across contexts (Quin˜onero-Candela et al., 2009), that is very relevant to the clinical setting.
Based on these developments in the data sciences and the increasing availability of GEP data derived from peripheral blood including AML, we sought to develop near-automated approaches in which ML tools automatically learn suitable patterns directly from the global transcriptomic data without pre-selec-tion of genes. To this end, we built the probably largest reference blood GEP dataset comprising 105 in-dividual studies with, in total, more than 12,000 patient samples. We applied high-dimensional ML approaches to build genome-wide predictors in an unbiased, entirely data-driven manner and tested predictive accuracy in held-out data. We emphasize that our goal was not to outperform classical diag-nostic methods, but to ask whether we could match human annotation in a near-automated and scalable manner. This aim is common to a number of recent efforts to use ML and AI advances in the diagnostic setting (see, e.g.,Esteva et al., 2017) wherein human-derived labels are used to guide learning. We did not address the question of subclassification of leukemic disease, where the mutation status of the leukemic cells is currently the dominant approach (Arber et al., 2016; Heath et al., 2017; Papaemmanuil et al., 2016; The Cancer Genome Atlas Research Network (TCGA) et al., 2013), but rather focused on primary diagnosis, which continues to rely mostly on classical approaches (morphology, immunophenotyp-ing, cytochemistry). We carried out extensive tests designed to address specific concerns relevant to prac-tical use, including the case of transferring predictive models between entirely disjoint studies (that could be subject to batch effects or other unwanted variation) and even between transcriptomic platforms. Our results show that combining ML and blood transcriptomics can yield highly effective and robust classifiers. This supports the notion that transcriptomic-based ML could be used to assist AML diagnostics, particu-larly in settings wherein hematological expertise is not sufficiently available and/or costly.
RESULTS
Establishment of a Unique GEP Dataset for Classifier Development
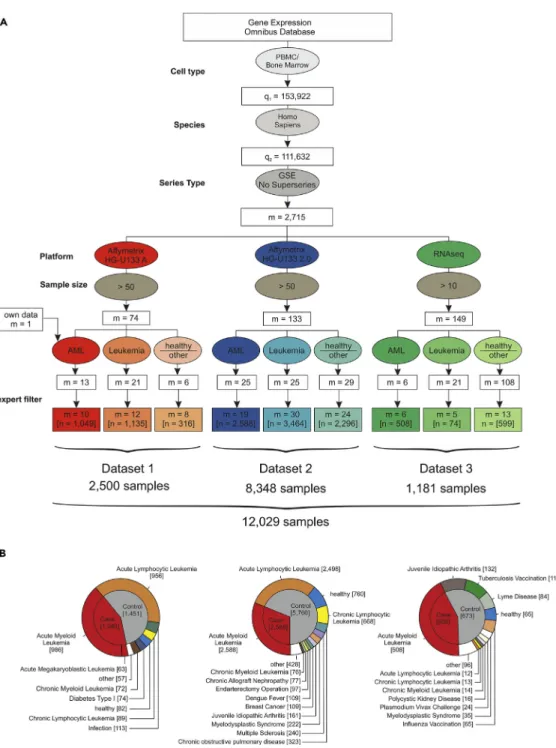
We hypothesized that the determination and comprehensive evaluation of GEP- and ML-based AML classifiers requires large datasets, should include samples from many sources to mimic the situation in real-world deployment, and should include several technical platforms to better understand their influence on classifier performance. To achieve these goals, we wanted to include the largest number of peripheral blood mononuclear cells (PBMC) or bone marrow samples possible and therefore systematically searched the National Center for Biotechnology Gene Expression Omnibus (GEO;Edgar, 2002) database for PBMC and bone marrow studies (Figure 1A). We identified 153,922 datasets, of which 111,632 contained human samples. To include only whole sample series and to avoid duplicate samples, we filtered for GEO series (GSE) and excluded the so-called super series, which resulted in 2,715 studies. We then focused the analysis on studies with samples analyzed on one of three platforms including the HG-U133A microarray, the HG-U133 2.0 microarray, and Illumina RNA-seq. Next, duplicated samples and studies working with pre-filtered cell subsets were excluded. This study search strategy resulted in 105 studies with a total of 12,029 samples (Figure 1) including 2,500 samples assessed by HG-U133A microarray (Dataset 1), 8,348 samples by HG-U133 2.0 microarray (Dataset 2), and 1,181 samples by RNA-seq (Dataset 3). In total, the dataset contained 4,145 AML samples of diverse disease subtypes and 7,884 other samples derived from healthy controls (n= 904), patients with acute lymphocytic leukemia (ALL,n= 3,466), chronic myeloid leukemia (CML,n= 162), chronic lymphocytic leukemia (CLL,n= 770), myelodysplastic syndrome (MDS,n= 267), and other non-leukemic diseases (n= 2,312) (Figures 1B,S1, andS2). Unless otherwise noted, all samples derived from patients with AML are referred to as cases and non-AML samples as controls. We
additionally considered a differential diagnosis-like setting, in which case the controls comprised non-AML leukemias. According to the three platform types, the whole sample cohort was divided into three datasets referred to as datasets 1, 2, and 3 (Table S1,Figure S1).
Figure 1. Establishing Datasets for the Largest AML Meta-study to Date
(A) Flowchart for the inclusion of studies. The gene expression omnibus (GEO) database was systematically searched for GEO Series of human PBMC and bone marrow samples processed with microarray platforms (Affymetrix HG-U133A and HG-U133 2.0) or next-generation RNA sequencing (RNA-seq) data. These data were filtered for inclusion of AML samples, samples of other leukemia, and healthy samples or other diseases. After manual revision and exclusion of duplicates and experiments using sorted cell populations (‘‘expert filter’’), the data were combined and normalized independently for each dataset.
(B) Detailed overview of the three datasets established in this study after filtering as given in (A). See alsoFigure S1.
Effective AML Classification Using High-Dimensional Models
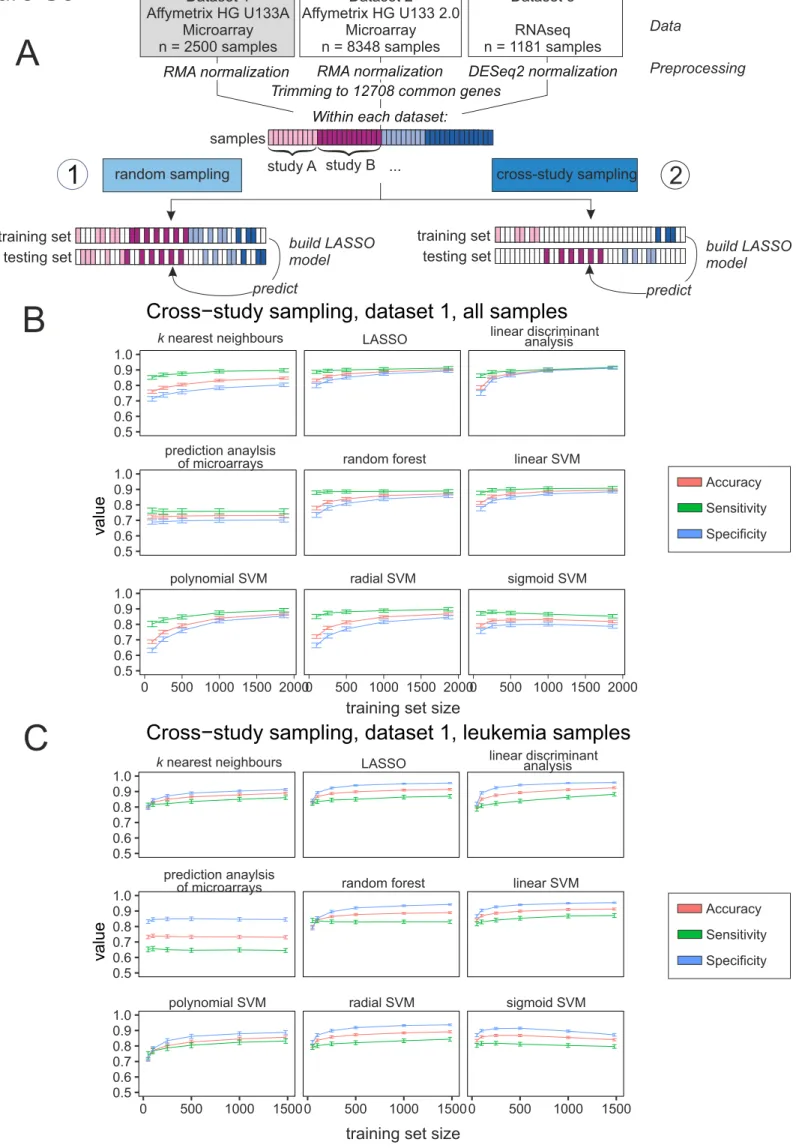
Here, we sought to assess classification of AML versus non-AML. Microarray data were RMA normalized using the R package affy (Gautier et al., 2004), whereas RNA-seq data were normalized as implemented in the R package DESeq2 (Love et al., 2014). For further analysis and better comparison between the different datasets, we trimmed the data to 12,708 genes, which were annotated within all datasets. No filtering of low expressed genes was performed (Figure 2A). The size of the test set was 20% of the total sample size, and random sampling of training and test sets was repeated 100 times. As main performance metrics, we considered (held-out) accuracy, sensitivity, and specificity. Classification was performed using
l1-regularized logistic regression (the lasso; see also later).
First, we included all non-AML samples, consisting of healthy controls and non-leukemic diseases, among the controls (Figures 2B, 2D, and 2F, light blue lines,Table S2). The goal was to classify unseen samples as AML or control. To understand how much data is needed in this setting, we plotted learning curves showing the test set accuracy as a function of training sample sizentrain. For each gene expression platform, this was done by randomly subsamplingntrainsamples and testing on held-out test data with fixed sample sizentest(as shown). We see that prediction in this setting is already highly effective with a small number of training samples, although accuracy still increases with increasing ntrain(note that the total number of samples and hence range ofntraindiffers by platform).
In many clinical settings, the control group does not contain healthy controls, but rather related diseases. To test effectiveness in a differential diagnosis setting, we repeated the experiments but with controls sampled only from other leukemic diseases, such as ALL, CLL, CML, and MDS (Figures 2C, 2E,S3–S5, andS13). We observed similar prediction results, which indicated that prediction accuracy is not only due to large differences between AML and non-leukemic conditions.
In additional experiments we considered performance of nine different classification methods (Figures S3– S5,Table S4). We could predict AML with good accuracy with all tested classification algorithms on micro-array platforms (Figures S3andS4). For RNA-seq data, the lasso,knearest neighbors, linear support vector machines, linear discriminant analysis, and random forests were able to predict with high sensitivity and specificity (Figure S5, for details on used packages seeTransparent Methods). Lasso-type methods have several advantages, including extensive theoretical support and interpretability, so we focused on these as our main predictive tool. Deep neural networks provided similar prediction performance to the lasso (Figure 2G) on dataset 2. We preferred the latter in this setting due to interpretability, because the lasso provides explicit variable selection, facilitating model interpretation.
Evaluation of Positive Predictive Value under Various Prevalence Scenarios
For diagnostic utility, the positive predictive value (PPV; the probability of disease given a positive test result) is an important quantity. The PPV depends not only on sensitivity and specificity but also on prev-alence, as it is harder to achieve a high PPV for a condition that is rare in the population of interest. This has implications for any change to the effective threshold at which a potential case enters the diag-nostic pipeline. As this threshold is relaxed, the prevalence (in the tested population) decreases, which in turn reduces the PPV. Thus, although we found high accuracy, sensitivity, and specificity already at mod-erate ntrain, depending on the use case, this could still imply that large training sample sizes would be useful to reach acceptable PPVs. For example, the predictive gains in increasingntrainfrom the lowest to the highest values indicated inFigure 2C, which is for the dataset with largest total sample size, corre-spond to a doubling of PPV from20% to 40% at an assumed prevalence of 1% (Figure 3). This illustrates the fact that although after a certain point increasing ntrain tends to increase accuracy only slowly, the gains, even if small in absolute terms, can be highly relevant with respect to PPV in low-prev-alence settings.
Assessing the Effect of Cross-Study Variation on Predictive Performance
Microarray data and data generated by high-throughput sequencing are both known to be susceptible to batch effects (Leek et al., 2010). More generally, diverse study-specific effects and sources of study-to-study variation can pose problems in the context of predictive tests for clinical applications. Predictors that perform well within one study may perform worse when applied to data from new studies (Hornung et al., 2017) with implications for practical generalizability.
A
1
Dataset 1 Affymetrix HG U133A Microarray n = 2500 samples Dataset 3 q RNAse n = 1181 samples Dataset 2 Affymetrix HG U133 2.0 Microarray n = 8348 samplesRMA normalization DESeq2 normalization RMA normalization
Trimming to 12708 common genes Within each dataset:
2
Data PreprocessingB
Dataset 1: AML vs. all samples
Accuracy (%) 100 90 80 70 60 50 100 200 500 1500 1875 2000 n train n test = 500 97.6 % random sampling cross-study sampling C 500 1000 1500 0 2000 n test = 436 Accuracy (%) 100 90 80 70 60 50 n train Dataset 1: AML vs. other leukemia
98.6%
E
Accuracy (%)
n train
Dataset 2: AML vs. other leukemia
2000 1000 1500 500 0 100 90 80 70 60 50 n test =1210 98.0% Accuracy (%) 2000 4000 6000 0 Dataset 2: AML vs. all samples
n test = 1669 100 90 80 70 60 50 n train 98.0% D n train Accuracy (%) Accuracy (%) Dataset 3: AML vs. all samples
Dataset 2: performance of neural nets
100 90 80 70 60 50 250 500 750 1000 n test = 236 99.1% F G LASSO mean accuracy neural net
5 layers neural net10 layers 80 85 90 95 100 98.6% 95.1% 97.1% samples study A study B
random sampling ... cross-study sampling training set
testing set
training set
testing set build LASSO model
predict build LASSO
model predict
The aforementioned results spanned data from multiple heterogeneous studies. Provided training and test data are sampled in the same way, such heterogeneity does not necessarily pose problems for classifica-tion, as evidenced earlier. However, if the training and test data are from entirely different sites/studies (rather than randomly sampled from a shared pool), then the impact of batch/study effects may be more serious. We took advantage of the large number of studies in our dataset to sample training and testing sets in such a way that they were mutually disjoint with respect to studies. That is, any individual study from which any sample was included into the training dataset was entirely absent from the test set, and
vice versa,and we use the termcross-studyto refer to this strictly disjoint case. Results are shown inFigures 2B, 2D, and 2F (dark blue lines). As expected, performance was worse in the cross-study setting than under entirely random sampling (light blue lines). However, in the dataset with the largest sample size (da-taset 2, platform HG-U133 2.0;Figure 2D) we see that the performance in the cross-study case gradually catches up to the random sampling case with only a small gap at the largestntrain. The other two datasets have smaller total sample sizes, so they never reach comparable training sample sizes. Note that we did not carry out any batch effect removal using tools such as combat (Johnson et al., 2007), SVA (Leek et al., 2012), or RUV (Jacob et al., 2016), and in that sense our results are conservative. Despite the availability of these and other tools for batch effect correction, it is difficult to be fully assured of the removal of unwanted variation in practice. Our intention here was not to remove between-study variation but rather to (conser-vatively) quantify its effects on accuracy.
Owing to the large number of studies included in our analysis, we were able to carry out an entirely disjoint cross-study analysis also for the differential diagnosis case. These results are shown inFigures 2C and 2E (dark blue lines; cross-study sampling for differential diagnosis was not possible using dataset 3 due to lack of samples, see Figure S1) and are broadly similar, also across different classification algorithms (Figures S6–S8).
However, even in this strict cross-study sampling scenario, where samples from studies of the training and testing sets are entirely disjoint, the predictor matrices are still normalized together, meaning that the prediction rule still depends to some extent on features (not labels) in the test set. To address this issue, we performed addon RMA normalization (Hornung et al., 2017) as implemented in the R package bapred (Hornung et al., 2016). We split dataset 1 in training and testing data in a strict cross-study setting as in
Figure 2A, performed RMA normalization on the training data, and then performed addon normalization of the test data onto the training data, meaning that the normalization of the training data does not in any sense depend on the testing data (Figure S9A). Accuracy, sensitivity, and specificity of this setting compare well to the ‘‘classical’’ cross-study setting described earlier (Figures 2andS6A).
Classification Accuracy and AML Subtypes
Next, we sought to understand whether the accuracy of the classifiers depended on specific AML subtypes. As only a limited number of samples in our data were already annotated according to the new World Health Organization (WHO) classification, we utilized the French-American-British (FAB) classification of AML. The FAB classification was available for a total of 616 samples of dataset 1 and 1,269 samples in dataset 2. We utilized results from train/test splits of datasets 1 and 2 to quantify accuracy for each individual sample (Figures 4A and 4D). No particular AML subtype dominated classification accuracy in either dataset 1 or 2 (Figures 4C and 4F). Prediction accuracy was also consistent when broken down by non-AML disease category (Figures 4B and 4E). In dataset 1, 8 MDS samples and 10 samples from patients with Down syndrome transient myeloproliferative disorder were misclassified. However, both are diseases closely related to AML and represented by a very limited sample size in dataset 1. For dataset 2, correct classifi-cation of MDS appeared to depend on the individual sample, potentially reflecting disease heterogeneity.
Figure 2. Prediction of AML in Random and Cross-study Sampling Scenarios
(A) Schema illustrating the approach to predict AML in random and cross-study sampling scenarios.
(B–D) AML classification accuracies based on the lasso model of AML versus all other samples and for both sampling strategies are shown for dataset 1 (B), dataset 2 (C), and dataset 3 (D).
(E and F) Classification accuracies for the differential diagnosis case (AML versus other leukemic samples, namely, AML, ALL, CML, CLL, and MDS) for both sampling strategies are shown for dataset 1 (E) and dataset 2 (F). Mean accuracies of the lasso models are shown as a function of the training sample size
ntrain. Results are over 100 random training and test sets, with error bars indicating the standard deviation.
(G) Comparison of the performance of the LASSO models introduced in panels A to F with a neural network approach using either 5 or 10 layers. Error bars indicate the standard deviation.
While our main focus is on diagnosis, we asked whether the transcriptomic data could contribute to clas-sifying AML subtypes. To exemplify this aspect, we focused on AML subtype M3, also namedacute pro-myelocytic leukemia, as this is the only genetically defined subtype of the FAB classification that is also part of the WHO classification. Using dataset 2, we used a train/test approach, drawing subsets of dataset 2 with approximately the same class balance as in main results (here, one-third AML-M3 cases in every sub-set) (Figure 4G). M3 was distinguished from non-M3 AML with high accuracy, sensitivity, and specificity ( Fig-ure 4H). Although the data here do not allow rigorous testing of transcriptomics combined with genomics in an integrated fashion for subtype classification, and we would not recommend at this stage the use of a purely transcriptomic classifier for subtyping, these initial results suggest that it may be useful to further study the potential value of testing scalable ML- and GEP-based methodology in the area of subclassifi-cation as well.
Translation of Classifiers across Technical Platforms
Over the long term, clinical pipelines must cope with changes in technological platforms. It is therefore relevant to understand to what extent predictors can generalize not only between studies but also between different platforms. In other words, is it possible to take a model learned on data from platformAand deploy it using unseen data from platformB? To address this question, we constructed AML versus non-AML training and test sets in across-platformmanner, i.e., training on one platform and testing on another (Figure 5A). That is, a model was learned using independently normalized data from one platform and then this model, used ‘‘as is,’’ with no further fine-tuning, was used to make predictions using expression data from a different platform. We see that classification accuracy varies greatly. Classifiers that were trained on HG-U133 A (dataset 1) work well when tested using data generated with the more advanced mi-croarray HG-U133 2.0 (dataset 2) (Figures 5B andS10) and models trained on HG-U133 2.0 data can predict well using RNA-seq data (dataset 3) (Figures 5D andS11). However, models trained naively on HG-U133 A data cannot predict using RNA-seq data (Figures 5F,S12, andS13,Table S4).
To explore the utility of simple transformations in this context, we then performed a rank transformation to normality on all datasets (seeTransparent Methods). This is among the simplest and best known data trans-formations, has previously been shown to increase the performance of prognostic gene expression signa-tures, and can even outperform more complex variance-stabilizing approaches (Zwiener et al., 2014). With this approach, we reached very good overall performance across all platforms under study (Figures 5C, 5E, and 5G). This is particularly interesting for the prediction of dataset 3, which fails when the model is trained on the untransformed dataset 1 (Figures 5F, 5G,S11, andS12) and performsworse(on dataset 3) asntrain
increases. This is because asntrainincreases, the models learn a pattern that is increasingly fine-tuned to the data type in the training set. However, because the test set is from adifferentplatform, test perfor-mance suffers. This is most likely not classical ‘‘overfitting,’’ because as shown in previous figures test error is well-behavedwithindataset 1, but rather an example of a transfer learning/distribution-shift type prob-lem, which in this case is solved simply by rank transformation. Note that the transformation is simply applied to each dataset independently and could be easily deployed in any practical use case without any need for prior input into, e.g., cross-platform designs such as inclusion of control samples.
Dataset 2
n train Positive predictive value (%) 100 80 60 40 20 0 100 200 500 3000 6678 n test = 1669 5 % Prevalence 1 % Prevalence 0.1 % PrevalenceA Figure 3. Positive Predictive Value
Positive predictive value as a function ofntraincorresponding to the
setting as inFigure 2C and assumed prevalence of 0.1%, 1%, or 5% is shown (see text). Error bars depict the standard deviation.
A Dataset 1: Affymetrix HG U133A Microarray n = 2500 samples training set n = 2000 testing set n = 500
Prediction of AML vs. non-AML Readout:
Percentage of correct predictions per sample (Accuracy) Leukemia samples and in all AML samples, split by AML subytype 100 random permutations (subsets as in fig. 2B)
C B
Accuracy (%) per sample over all permutations
100 0 0 50 75 25 # samples 1.00 956 63 978 89 72 8 10 19 0.97 0.97129 0.99166 1.0019 0.98144 0.9982 0.9914 0.839 0.97431 mean accuracy 99.4 0.88 0.98 0.94 0.16 0.42
ALL AMKL AML CLL CML DS TMD MDS
Prediction results by leukemia type
100
50 75
25
M0 M1 M2 M3 M4 M5 M6 M7
Prediction results in AML subtypes
NA
Prediction of AML vs. non-AML Readout:
Percentage of correct predictions per sample (Accuracy) Leukemia samples and in all AML samples, split by AML subytype 100 random permutations (subsets as in fig. 2C)
Dataset 2: Affymetrix HG U133 2.0 Microarray n = 8348 samples training set n = 6687 testing set n = 1670 D E F
Accuracy (%) per sample over all permutations
100 0 50 75 25 # samples 2498 2588 668 76 222 0.99 0.97 1.00 0.98 0.86 mean accuracy
Prediction results by leukemia type
ALL AML CLL CML MDS 100 0 50 75 25 54 235 317 98 204 176 21 17 7226 0.98 0.97 0.92
Prediction results in AML subtypes
NA
M0 M1 M2 M3 M4 M5 M6 M7
1.00 0.97 >0.99 0.96 0.90 0.96
G
100 random subsamples (of non-M3)
and train/test splits
subset
subset
80% 20%
Dataset 2
Affymetrix HG U133 2.0 Microarray n = 8348 samples
n = 1122 AML samples with known subype
M3 samples n = 98 prediction set 98 M3 samples 196 non-M3 samples non-M3 samples n = 1024 training set n = 235 testing set n = 59 H
Prediction of M3 AML vs. non-M3 AML
mean value (%) 100 60 70 80 90 50 accuracy 98.9% 97.6% 99.5% sensitivity specificity l llllllllllll l l l l
Furthermore, we used the rich resource of the present dataset to explore whether prediction across leukemic diseases would be possible as well. For this, we trained a multilabel-classifier on dataset 2 using both datasets 1 and 3 as independent validation sets (Figure S14A). We found good prediction accuracy, sensitivity, and specificity over most tested diseases (Figure S14B); however, a rigorous study over all leukemic conditions would clearly require the inclusion of more training samples for CLL and CML. Predictive Signatures and AML Biology
The predictive models derived from the lasso and used earlier are sparse in the sense that they automat-ically select a small number of genes to drive the prediction. The genes are selected in a unified global anal-ysis, rather than by differential expression (DE) on a gene-by-gene basis. From a statistical point of view, global sparsity patterns for prediction and gene-by-gene DE are different criteria. Differentially expressed genes are those that individually have different levels between the groups, whereas genes selected for prediction are those that together perform well in a predictive sense. For the lasso, the selected set of genes also typically includes false-positives with respect to the truly relevant predictors. Furthermore, a good set of genes for prediction need not be mechanistic (in the sense of constituting causal drivers of the disease state). We therefore sought to understand the relationship between DE, known mechanisms, and predictive gene signatures.
Using dataset 2 (the largest dataset) we compared DE and the sparse predictive models (Figure S15). We performed DE analysis using the whole dataset and compared the results with the set of genes in the lasso model (‘‘lasso genes’’) based on the same data (Figure 6A). A total of 506 genes was differentially expressed (‘‘DE genes’’), of which 26 were associated with the disease ontology term or Kyoto Encyclopedia of Genes and Genomes (KEGG) pathway for AML (‘‘AML-related genes’’). Of the 141 lasso genes, 7 genes were leukemia related and 46 were DE genes, meaning that many of the lasso genes were not differentially ex-pressed, as clearly seen when overlaying the lasso gene selection on a volcano plot (Figure 6A). This under-lines the fact that DE and predictive value in a signature sense are different criteria.
Next, we extended this analysis to focus on DE and lasso genes whose selection was robust to data sub-sampling. This was done by subsampling half the dataset randomly 100 times and in each such subsample carrying out the full DE and lasso analyses. For the lasso this type of approach has been studied under the name stability selection (Meinshausen and Bu¨hlmann, 2010). DE and lasso genes were then scored according to the frequency with which they appeared among the 100 rounds of selection (Figure 6B). Thus, an inclusion score of 100% for a DE gene means that the gene is selected as differentially expressed in all 100 iterations, and similarly for the lasso genes. In total, 669 genes passed the DE cutoffs in at least 50% of the iterations, whereas 80 genes were called in at least 50% of the iterations by the lasso model ( Fig-ure 6B). Of these genes, 35 were called according to both criteria. The above-mentioned results show that even among the genes that are included in the lasso models with high frequency (i.e., those genes that are robustly selected for prediction), many are not differentially expressed.
Next, we excluded the 155 known AML genes that are associated with the disease ontology term or KEGG pathway for AML from the prediction, which did not affect disease prediction at all (Figure 6C), high-lighting the strong robustness of the classifier. To better understand the potential biological relevance for AML of the 35 genes that were robustly called under both DE and lasso criteria (Figure 6B), we visualized the top-ranked genes over all 8,348 samples within the dataset by hierarchical clustering ofz-transformed expression values (Figure 6D). We identified one distinct cluster of genes with the majority of genes being elevated in AML compared with other leukemias and non-leukemic samples (cluster 1,n= 29). Although we identified several well-known AML-related genes (gene name in red color) such as the KIT Proto-Oncogene Receptor Tyrosine Kinase (KIT) (Gao et al., 2015; Heo et al., 2017; Ikeda et al., 1991), RUNX2 (Kuo et al., 2009), and FLT3 (Bullinger et al., 2008; Carow et al., 1996) in this cluster, many genes have not yet been
Figure 4. Accuracy of AML Classification in Different Leukemia Types and AML Subclasses
(A) Schema for determining accuracy for leukemia types and AML subclasses in dataset 1.
(B–D) Normalized dataset 1 was randomly split into training and test sets 100 times (same permutations as inFigure 2B), and prediction accuracy is reported for each individual sample. The bars in the figure correspond to individual samples broken down by leukemia type (B) and AML subtype (C). (D) Schema for determining accuracy for leukemia types and AML subclasses in dataset 2.
(E–H) Normalized dataset 2 was randomly split into training and test sets 100 times (D) and prediction accuracy is reported for each individual sample, listed by leukemia type (E) and AML subtype (F). Workflow for M3 subtype prediction using dataset 2 (G) Boxplots of prediction accuracy, sensitivity, and specificity over 100 train/test splits (H). Error bars depict the standard deviation.
Prediction Dataset 1 Affymetrix HG U133A Microarray n = 2500 samples Dataset 3 RNAseq n = 1181 samples Dataset 2 Affymetrix HG U133 2.0 Microarray n = 8348 samples
RMA normalization DESeq2 normalization RMA normalization
Trimming to 12708 common genes optional rank transformation
training set training set training set test set test set test set Prediction Prediction Data Preprocessing Cross-platform prediction prediction without rank transformation prediction without rank transformation prediction without rank transformation prediction with rank transformation prediction with rank transformation prediction with rank transformation Training set: Dataset 1
Test set: Dataset 2
Accuracy (%) Accuracy (%) Accuracy (%) Accuracy (%) Accuracy (%) Accuracy (%) 50 100 100 100 500 500 500 1000 1000 1000 1500 1500 1500 2000 2000 2000 2500 8348 2500 50 50 50 50 50 60 60 60 60 60 60 70 70 70 70 70 70 80 80 80 80 80 80 90 90 90 90 90 90 100 100 100 100 100 100 n train n train 100 500 1000 1500 2000 8348 n train 100 500 1000 1500 2000 2500 n train 100 500 1000 1500 2000 2500 n train n train
1
Setting
1
2
3
Setting
Setting
Setting
Training set: Dataset 2
Test set: Dataset 3
2
Setting
Training set: Dataset 1
Test set: Dataset 3
3
Setting
A B C E D F Glinked to AML biology, and, although not the focus of the present article, further study of these genes may be interesting from a mechanistic point of view. Within the other cluster (cluster 2, n = 6 genes), genes had reduced expression values in AML compared with other leukemias and two of these genes have been linked to other types of leukemias (gene names in orange color).
DISCUSSION
Despite the pioneering studies by Golub and others (Debernardi et al., 2003; Kohlmann et al., 2003; Ross et al., 2004; Schoch et al., 2002; Virtaneva et al., 2001) suggesting high potential value of GEP for primary AML diagnosis and differential diagnosis, current recommendations for diagnosing this disease currently center on classical approaches including assessment of morphology, immunophenotyping, cytochemistry, and cytogenetics (Do¨hner et al., 2017). Analyzing more than 12,000 samples from more than 100 individual studies, we provide evidence that combining large transcriptomic data with ML allows for the development of robust disease classifiers. Such classifiers could, in the future, potentially assist in primary diagnosis of this deadly disease particularly in settings where hematological expertise is not sufficiently available and/or costly. Considering the increased utilization of whole-genome and whole-transcriptome sequencing in the management of patients with cancer, we propose that application of GEP- and ML-based classifiers for diagnosis needs to be re-evaluated. This is in line with previous suggestions by the In-ternational Microarray Innovations in Leukemia Study Group (Haferlach et al., 2010). Furthermore, we sug-gest that similar analyses may be useful for other diseases when analyzing whole blood or PBMC-derived gene expression profiles, or for multiple conditions in parallel (see later).
We sought to understand and address some of the bottlenecks in the way of clinical deployment of transcriptomic-based ML tools for diagnosis. To this end, we considered a range of practical scenarios, including cross-study issues and prediction across different technological platforms. We found that accu-rate prediction is possible across a range of scenarios and, in many cases, with relatively few training sam-ples. However, we also showed that depending on the use case and the associated prevalence, large training sets may be required to reach accuracies high enough to yield acceptable PPVs.
Our results show that with existing technologies it is potentially possible to achieve good performance in a near-automated fashion. An ML-plus-genomics approach can be run at very low marginal cost: the RNA assays can already be done at <$100 (and this continues to fall), and in the long-term these costs will drop still further. To our knowledge, this is already in a cost range that is lower than the combined use of morphology, immunophenotyping, and cytochemistry for primary AML diagnosis. Furthermore, the sparse models we considered, once trained, require only a small subset of the genome, hence custom sequencing pipelines could be used. Marginal cost is important precisely because it opens up the possibility of a truly scalable detection/diagnosis strategy. One example of a recently developed, very-low-cost whole-tran-scriptomics protocol is BRB-seq which allows generating genome-wide transcriptomic data at a similar cost as profiling four genes using RT-qPCR (Alpern et al., 2019), which could be a candidate for future clin-ical development. Furthermore, recent developments in nanopore sequencing (Byrne et al., 2017) suggest that in the future, delivery of transcriptomic assays could be greatly simplified, and this, combined with cloud- or local-device-based ML prediction, would represent a paradigm shift in terms of scalability and accessibility. Such transcriptome-based ML might therefore also be utilized at an earlier time point in the disease course, when patients present with non-specific symptoms to their primary care physician. Here, ML-based diagnostics might assist a faster transfer of the patient to specialized hematology centers for complete diagnostics and therapeutic management.
The next steps toward better understanding ML-based diagnosis for AML would include prospective studies specifically aimed at assessing diagnostic utility. Before any development in the future pivotal clin-ical trials for approval with the respective regulatory bodies would be required. Naturally, any such devel-opment would require additional, independent studies with the develdevel-opment of deployment-ready
Figure 5. Translating Predictive Signatures across Technological Platforms
(A) Schema of signature translation across platforms. Datasets were normalized individually and trimmed to 12,708 common genes. The classifiers were trained on subsamples of different sizes on one platform and tested on all samples of another platform.
(B–G) Classification accuracies are shown as a function of training sample size (ntrain) without rank transformation (B, D, and F) and with rank transformation (C,
E, and G). For the latter case, the training and test datasets (from different platforms) were separately rank transformed (see text for details). Error bars depict the standard deviation.
pipelines, which by itself is a nontrivial undertaking (as discussed inKeane and Topol, 2018). However, initial prospective studies have already been started, such as the 5000 genomes project (https://www. mll.com/en/science/5000-genome-project.html), which also performs RNA-seq to develop such a classifier
A D
HBG1BSGNME7 GOLIM4PLA
GL1 R UNX2ACTA 2 NR1H3 DNM1FLT3ANKRD28CHRF AM7A
TPSB2 PLTPMICALL2 MESTTFPINPR3KITDEPT
OR
ARL4ACXCL2 PLD1JAG
1
APOC4−APOC2NRIP3 HO
XB5
HOMER3ADGRA2 CDC14B WLSTLE1SDHAP1MYLKPFKM
Sepsis [54] SLE [61] Transplant Rejection [12] Chronic Allograft Nephropathy [77]
healthy [760] Cluster 1 Cluster 2 MS [240] Periodontitis [59] RSV Infection [51] Sarcoidosis [40] Schizophrenia [43] Infection [43] Breast Cancer [109] Unknown Cancer [22] COPD [323] Dengue Fever [101] AML [2588] Endarterectomy operation [97] Hypersensitivity Pnemonitis [6] Immunosuppression [24] JDM [13] JIA [161] MDS [222] CML [76] CLL [668] ALL [2498] z-score 0 2 -2 Leukemia-related gene AML-related gene
Heatmap of 35 top-ranking lasso & DE-genes
B
35 45 634 Lasso genes DE genes
genes sorted by differential expression rank
100 50 0
% inclusion
> 50 % inclusion > 50 % inclusion
Dataset 2, 100 subsamples (each with n = 4174) Dataset 2, global analysis of all samples
300 200 100 log (padj.) 10 log2(FC) 0 0 2 -2 Lasso genes [141] DE genes [506] AML-relates genes (KEGG & DO)
460
(23) 46 (3) 95 (4)
DE genes( |FC| > 2 & padj < 0.05 ) Lasso gene (coefficients ≠ 0) none l l l 100 90 80 70 60 50
C known AML genes included
Mean SD
known AML genes excluded
AccSensSpec AccSensSpec 98.5
00.3
00.300.798.0 98.8 00.2 00.798.598.098.80.03
Figure 6. Predictive Signatures and AML Biology
(A) Volcano plot of global differentially expressed (DE) genes and genes of the lasso model (‘‘lasso genes’’) in dataset 2, and Venn diagram indicating the overlap of both gene sets and the genes included in the KEGG pathway or the disease ontology term ‘‘AML.’’
(B) Inclusion plot of DE genes and lasso genes in 100 random permutations of dataset 2. The plot is sorted according to DE gene rank, and a Venn diagram shows the overlap between genes with a minimum of 50% inclusion.
(C) Boxplot of accuracy, sensitivity, and specificity of the predictive model trained and tested on random subsets of dataset 2 with inclusion of all genes of the dataset and without 155 genes known to be relevant for AML biology. Error bars depict the standard deviation.
(D) Heatmap and hierarchical clustering of z-scaled expression values of 35 genes with >50% inclusion both in lasso and DE genes, as shown in (B). Genes with known associations with AML are marked red; genes associated with other types of leukemia are labeled in orange.
for the clinics. It is also important to emphasize that just as regulatory standards have evolved for classical diagnostics, so too will new regulatory frameworks be needed for ML-assisted diagnostics in the future (Keane and Topol, 2018).
An additional point concerns explicit and implicit thresholds at which a suspected case is entered into the pipeline in the first place. A lower threshold for entry could lower false-negatives and reduce the risk of delayed treatment (which has been associated with worse outcomes, notably in younger patients;
Sekeres et al., 2008). Using current diagnostic systems any such change would dramatically increase the overall costs; in contrast, more efficient solutions would allow thresholds to be optimized for patient benefit while keeping the overall costs controlled. Naturally any modification to the overall diagnostic strategy would need a full health economic and decision analysis (accounting in particular for a necessarily higher false-positive rate) and case-by-case assessment. For some diseases it may be the case that earlier entry into a diagnostic pipeline would overallnotbe beneficial, a point that is widely appreciated in the context of population-level screening (see, e.g.,Jacobs et al., 2016). Nevertheless, the point is that scalable diag-nostic strategies increase the scope for optimization of decision making for patient benefit.
We saw also encouraging results across other conditions. Although the data used in the present study do not allow rigorous study of diagnosis across multiple conditions, we conjecture that diagnosis of multiple conditions from blood transcriptomes may be possible, opening up the possibility of training multi-class classifiers on blood transcriptomic data. Note that this would allow diagnosis of several conditions at essentially thesamemarginal cost per additional sample, bolstering the economic case outlined earlier. Rigorous study would require new pan-disease study designs, but we think that such approaches could lead to large efficiency gains in the future.
All our models were learned in an unbiased manner, directly from the full transcriptome data with no prior biological knowledge or any pre-selection of genes. We showed that genes relevant for prediction were often not differentially expressed and that prediction was robust to removal of known AML-related genes. These observations illustrate two points of relevance to clinical applications. First, for prediction it can be more fruitful to consider signatures derived in data-driven, genome-wide fashion than to think in terms of single genes or DE. Second, high-dimensional analyses, although complex relative to more classical methods, can be highly predictive as well as robust to the presence or absence of specific genes. Taken together, our results underline the immense value of making GEP data publicly available, allowing for new and large-scale multi-study analyses. Furthermore, we support the notion that the application of ML approaches based on sequencing data to identify gene signatures for certain diseases such as AML will become part of recommendations for diagnosis and management of AML. We envision that combining whole-genome and whole-transcriptome analysis based on ML algorithms will ultimately allow early detection, diagnosis, differential diagnosis, subclassification, and outcome prediction in an integrated fashion.
Limitations of the Study
It is important to note that the data used here were pooled from multiple studies with different designs and goals. Further work, including suitably designed prospective studies, would be needed to better understand the diagnostic utility of an ML-plus-transcriptomics approach. Site- and study-specific effects may be relevant for clinical applications. This is because a classifier once learned might be deployed in a range of new settings (sites, regions) that could lead in a number of ways to unwanted variation. If training and test sets are very different, this can impact performance. In clinical applications of predictive models it will be important to continually track performance even after deployment and the possibility of distribu-tional shifts that require more complex analyses cannot be ruled out.
METHODS
All methods can be found in the accompanyingTransparent Methods supplemental file.
DATA AND CODE AVAILABILITY
Processed data can be accessed via the SuperSeries GSE122517 or via the individual SubSeries GSE122505 (dataset 1), GSE122511 (dataset 2), and GSE122515 (dataset 3). The code for preprocessing and for predic-tions can be found at GitHub (https://github.com/schultzelab/aml_classifer). In addition, all data and
package versions are stored in a docker container on Docker Hub (https://hub.docker.com/r/schultzelab/ aml_classifier,Table S3).
SUPPLEMENTAL INFORMATION
Supplemental Information can be found online athttps://doi.org/10.1016/j.isci.2019.100780.
ACKNOWLEDGMENTS
This work was funded by the Deutsche Forschungsgemeinschaft (DFG, German Research Foundation) un-der Germany’s Excellence Strategy—EXC2151—390873048. This project has received funding from the Eu-ropean Union’s Horizon 2020 research and innovation programme under grant agreement No 733100. J.L.S is member of the Helmholtz network Sparse2Big.
AUTHOR CONTRIBUTIONS
Conceptualization, J.L.S. and S.M.; Methodology, S.M., J.L.S., and S.W.-H.; Software, S.W.-H., K.P., and B.T.; Validation, B.T.; Formal Analysis, S.W.-H., T.U., K.P., J.S.-S., K.K., M.B., L.S.; Investigation, S.W.-H., T.U., P.G., K.B.; Resources, T.H., S.W.-H.; Data Curation, S.W.-H.; Writing – Original Draft, J.L.S., S.M., S.W.-H.; Visualization, S.W.-H., Supervision, J.L.S., S.M., M.B.
DECLARATION OF INTERESTS
There are no competing interests. Received: August 26, 2019 Revised: December 3, 2019 Accepted: December 12, 2019 Published: January 24, 2020
REFERENCES
Alpern, D., Gardeux, V., Russeil, J., Mangeat, B., Meireles-Filho, A.C.A., Breysse, R., Hacker, D., and Deplancke, B. (2019). BRB-seq: ultra-affordable high-throughput transcriptomics enabled by bulk RNA barcoding and sequencing. Genome Biol.20, 71.
Andersson, A., Ritz, C., Lindgren, D., Ede´n, P., Lassen, C., Heldrup, J., Olofsson, T., Ra˚de, J., Fontes, M., Porwit-MacDonald, A., et al. (2007). Microarray-based classification of a consecutive series of 121 childhood acute leukemias: prediction of leukemic and genetic subtype as well as of minimal residual disease status. Leukemia21, 1198–1203.
Arber, D.A., Orazi, A., Hasserjian, R., Thiele, J., Borowitz, M.J., Le Beau, M.M., Bloomfield, C.D., Cazzola, M., and Vardiman, J.W. (2016). The 2016 revision to the World Health Organization classification of myeloid neoplasms and acute leukemia. Blood127, 2391–2405.
Brynjolfsson, E., and McAfee, A. (2014). The Second Machine Age: Work, Progress, and Prosperity in a Time of Brilliant Technologies (W W Norton & Co).
Bu¨hlmann, P., and van de Geer, S. (2011). Statistics for High-Dimensional Data: Methods, Theory and Applications (Springer).
Bullinger, L., Do¨hner, K., Bair, E., Fro¨hling, S., Schlenk, R.F., Tibshirani, R., Do¨hner, H., and Pollack, J.R. (2004). Use of gene-expression profiling to identify prognostic subclasses in adult acute myeloid leukemia. N. Engl. J. Med.350, 1605–1616.
Bullinger, L., Do¨hner, K., Kranz, R., Stirner, C., Fro¨hling, S., Scholl, C., Kim, Y.H., Schlenk, R.F., Tibshirani, R., Do¨hner, H., et al. (2008). An FLT3 gene-expression signature predicts clinical outcome in normal karyotype AML. Blood111, 4490–4495.
Byrne, A., Beaudin, A.E., Olsen, H.E., Jain, M., Cole, C., Palmer, T., DuBois, R.M., Forsberg, E.C., Akeson, M., and Vollmers, C. (2017). Nanopore long-read RNAseq reveals widespread transcriptional variation among the surface receptors of individual B cells. Nat. Commun.8, 16027.
Carow, C.E., Levenstein, M., Kaufmann, S.H., Chen, J., Amin, S., Rockwell, P., Witte, L., Borowitz, M.J., Civin, C.I., and Small, D. (1996). Expression of the hematopoietic growth factor receptor FLT3 (STK-UFIk2) in human leukemias. Blood87, 1089–1096.
Ciriello, G., Gatza, M.L., Beck, A.H., Wilkerson, M.D., Rhie, S.K., Pastore, A., Zhang, H., McLellan, M., Yau, C., Kandoth, C., et al. (2015).
Comprehensive molecular portraits of invasive lobular breast cancer. Cell163, 506–519.
Debernardi, S., Lillington, D.M., Chaplin, T., Tomlinson, S., Amess, J., Rohatiner, A., Lister, T.A., and Young, B.D. (2003). Genome-wide analysis of acute myeloid leukemia with normal karyotype reveals a unique pattern of homeobox gene expression distinct from those with translocation-mediated fusion events. Genes Chromosomes Cancer37, 149–158.
Ding, L., Ley, T.J., Larson, D.E., Miller, C.A., Koboldt, D.C., Welch, J.S., Ritchey, J.K., Young, M.A., Lamprecht, T., McLellan, M.D., et al. (2012). Clonal evolution in relapsed acute myeloid leukaemia revealed by whole-genome sequencing. Nature481, 506–510.
Do¨hner, H., Estey, E.H., Amadori, S., Appelbaum, F.R., Buchner, T., Burnett, A.K., Dombret, H., Fenaux, P., Grimwade, D., Larson, R.A., et al. (2010). Diagnosis and management of acute myeloid leukemia in adults: recommendations from an international expert panel, on behalf of the European LeukemiaNet. Blood115, 453–474.
Do¨hner, H., Estey, E., Grimwade, D., Amadori, S., Appelbaum, F.R., Bu¨chner, T., Dombret, H., Ebert, B.L., Fenaux, P., Larson, R.A., et al. (2017). Diagnosis and management of AML in adults: 2017 ELN recommendations from an international expert panel. Blood129, 424–447.
Edgar, R. (2002). Gene Expression Omnibus: NCBI gene expression and hybridization array data repository. Nucleic Acids Res.30, 207–210.
Esteva, A., Kuprel, B., Novoa, R.A., Ko, J., Swetter, S.M., Blau, H.M., and Thrun, S. (2017).
Dermatologist-level classification of skin cancer with deep neural networks. Nature542, 115–118.
Gao, X., Lin, J., Gao, L., Deng, A., Lu, X., Li, Y., Wang, L., and Yu, L. (2015). High expression of c-kit mRNA predicts unfavorable outcome in adult patients with t(8;21) acute myeloid leukemia. PLoS One10, e0124241.
Garzon, R., Volinia, S., Papaioannou, D., Nicolet, D., Kohlschmidt, J., Yan, P.S., Mro´zek, K., Bucci, D., Carroll, A.J., Baer, M.R., et al. (2014). Expression and prognostic impact of lncRNAs in acute myeloid leukemia. Proc. Natl. Acad. Sci. U S A111, 18679–18684.
Gautier, L., Cope, L., Bolstad, B.M., and Irizarry, R.A. (2004). affy–analysis of Affymetrix GeneChip data at the probe level. Bioinformatics20, 307–315.
Golub, T.R., Slonim, D.K., Tamayo, P., Huard, C., Gaasenbeek, M., Mesirov, J.P., Coller, H., Loh, M.L., Downing, J.R., Caligiuri, M.A., et al. (1999). Molecular classification of cancer: class discovery and class prediction by gene expression monitoring. Science286, 531–537.
Haferlach, T., Kohlmann, A., Wieczorek, L., Basso, G., Te Kronnie, G., Be´ne´, M.-C., De Vos, J., Herna´ndez, J.M., Hofmann, W.-K., Mills, K.I., et al. (2010). Clinical utility of microarray-based gene expression profiling in the diagnosis and subclassification of leukemia: report from the International Microarray Innovations in Leukemia Study Group. J. Clin. Oncol.28, 2529–2537.
Heath, E.M., Chan, S.M., Minden, M.D., Murphy, T., Shlush, L.I., and Schimmer, A.D. (2017). Biological and clinical consequences of NPM1 mutations in AML. Leukemia31, 798–807.
Heo, S.-K., Noh, E.-K., Kim, J.Y., Jeong, Y.K., Jo, J.-C., Choi, Y., Koh, S., Baek, J.H., Min, Y.J., and Kim, H. (2017). Targeting c-KIT (CD117) by dasatinib and radotinib promotes acute myeloid leukemia cell death. Sci. Rep.7, 15278.
Hoadley, K.A., Yau, C., Wolf, D.M., Cherniack, A.D., Tamborero, D., Ng, S., Leiserson, M.D.M., Niu, B., McLellan, M.D., Uzunangelov, V., et al. (2014). Multiplatform analysis of 12 cancer types reveals molecular classification within and across tissues of origin. Cell158, 929–944.
Hornung, R., Boulesteix, A.-L., and Causeur, D. (2016). Combining location-and-scale batch effect adjustment with data cleaning by latent factor adjustment. BMC Bioinformatics
17, 27.
Hornung, R., Causeur, D., Bernau, C., and Boulesteix, A.-L. (2017). Improving cross-study prediction through addon batch effect adjustment or addon normalization. Bioinformatics33, 397–404.
Ikeda, H., Kanakura, Y., Tamaki, T., Kuriu, A., Kitayama, H., Ishikawa, J., Kanayama, Y., Yonezawa, T., Tarui, S., and Griffin, J. (1991). Expression and functional role of the proto-oncogene c-kit in acute myeloblastic leukemia cells. Blood78, 2962–2968.
Jacob, L., Gagnon-Bartsch, J.A., and Speed, T.P. (2016). Correcting gene expression data when neither the unwanted variation nor the factor of interest are observed. Biostatistics17, 16–28.
Jacobs, I.J., Menon, U., Ryan, A., Gentry-Maharaj, A., Burnell, M., Kalsi, J.K., Amso, N.N., Apostolidou, S., Benjamin, E., Cruickshank, D., et al. (2016). Ovarian cancer screening and mortality in the UK Collaborative Trial of Ovarian Cancer Screening (UKCTOCS): a randomised controlled trial. Lancet387, 945–956.
Johnson, W.E., Li, C., and Rabinovic, A. (2007). Adjusting batch effects in microarray expression data using empirical Bayes methods. Biostatistics
8, 118–127.
Keane, P.A., and Topol, E.J. (2018). With an eye to AI and autonomous diagnosis. NPJ Digit. Med.1, 40.
Kohlmann, A., Schoch, C., Schnittger, S., Dugas, M., Hiddemann, W., Kern, W., and Haferlach, T. (2003). Molecular characterization of acute leukemias by use of microarray technology. Genes Chromosomes Cancer37, 396–405.
Kristensen, V.N., Vaske, C.J., Ursini-Siegel, J., Van Loo, P., Nordgard, S.H., Sachidanandam, R., Sorlie, T., Warnberg, F., Haakensen, V.D., Helland, A., et al. (2012). Integrated molecular profiles of invasive breast tumors and ductal carcinoma in situ (DCIS) reveal differential vascular and interleukin signaling. Proc. Natl. Acad. Sci. U S A109, 2802–2807.
Kuo, Y.-H., Zaidi, S.K., Gornostaeva, S., Komori, T., Stein, G.S., and Castilla, L.H. (2009). Runx2 induces acute myeloid leukemia in cooperation with Cbfbeta-SMMHC in mice. Blood113, 3323– 3332.
Lavallee, V.-P., Lemieux, S., Boucher, G., Gendron, P., Boivin, I., Armstrong, R.N., Sauvageau, G., and Hebert, J. (2016). RNA-sequencing analysis of core binding factor AML identifies recurrent ZBTB7A mutations and defines RUNX1-CBFA2T3 fusion signature. Blood
127, 2498–2501.
Lavalle´e, V.-P., Baccelli, I., Krosl, J., Wilhelm, B., Barabe´, F., Gendron, P., Boucher, G., Lemieux, S., Marinier, A., Meloche, S., et al. (2015). The transcriptomic landscape and directed chemical interrogation of MLL-rearranged acute myeloid leukemias. Nat. Genet.47, 1030–1037.
Leek, J.T., Scharpf, R.B., Bravo, H.C., Simcha, D., Langmead, B., Johnson, W.E., Geman, D., Baggerly, K., and Irizarry, R.A. (2010). Tackling the widespread and critical impact of batch effects in high-throughput data. Nat. Rev. Genet.11, 733–739.
Leek, J.T., Johnson, W.E., Parker, H.S., Jaffe, A.E., and Storey, J.D. (2012). The sva package for removing batch effects and other unwanted variation in high-throughput experiments. Bioinformatics28, 882–883.
Ley, T.J., Mardis, E.R., Ding, L., Fulton, B., McLellan, M.D., Chen, K., Dooling, D., Dunford-Shore, B.H., McGrath, S., Hickenbotham, M., et al. (2008). DNA sequencing of a cytogenetically normal acute myeloid leukaemia genome. Nature456, 66–72.
Ley, T.J., Ding, L., Walter, M.J., McLellan, M.D., Lamprecht, T., Larson, D.E., Kandoth, C., Payton, J.E., Baty, J., Welch, J., et al. (2010). DNMT3A mutations in acute myeloid leukemia. N. Engl. J. Med.363, 2424–2433.
Loriaux, M.M., Levine, R.L., Tyner, J.W., Fro¨hling, S., Scholl, C., Stoffregen, E.P., Wernig, G., Erickson, H., Eide, C.A., Berger, R., et al. (2008). High-throughput sequence analysis of the tyrosine kinome in acute myeloid leukemia. Blood
111, 4788–4796.
Love, M.I., Huber, W., and Anders, S. (2014). Moderated estimation of fold change and dispersion for RNA-seq data with DESeq2. Genome Biol.15, 550.
Macrae, T., Sargeant, T., Lemieux, S., He´bert, J., Deneault, E., and Sauvageau, G. (2013). RNA-Seq reveals spliceosome and proteasome genes as most consistent transcripts in human cancer cells. PLoS One8, e72884.
Meinshausen, N., and Bu¨hlmann, P. (2010). Stability selection. J. R. Stat. Soc.72, 417–473.
Pabst, C., Bergeron, A., Lavallee, V.-P., Yeh, J., Gendron, P., Norddahl, G.L., Krosl, J., Boivin, I., Deneault, E., Simard, J., et al. (2016). GPR56 identifies primary human acute myeloid leukemia cells with high repopulating potential in vivo. Blood127, 2018–2027.
Papaemmanuil, E., Gerstung, M., Bullinger, L., Gaidzik, V.I., Paschka, P., Roberts, N.D., Potter, N.E., Heuser, M., Thol, F., Bolli, N., et al. (2016). Genomic classification and prognosis in acute myeloid leukemia. N. Engl. J. Med.374, 2209– 2221.
Parker, J.S., Mullins, M., Cheang, M.C.U., Leung, S., Voduc, D., Vickery, T., Davies, S., Fauron, C., He, X., Hu, Z., et al. (2009). Supervised Risk predictor of breast cancer based on intrinsic subtypes. J. Clin. Oncol.27, 1160–1167.
Quin˜onero-Candela, J., Sugiyama, M., Schwaighofer, A., and Lawrence, N.D. (2009). Dataset Shift in Machine Learning (MIT Press).
Robertson, A.G., Kim, J., Al-Ahmadie, H., Bellmunt, J., Guo, G., Cherniack, A.D., Hinoue, T., Laird, P.W., Hoadley, K.A., Akbani, R., et al. (2017). Comprehensive molecular characterization of muscle-invasive bladder cancer. Cell171, 540– 556.e25.
Ross, M.E., Mahfouz, R., Onciu, M., Liu, H.-C., Zhou, X., Song, G., Shurtleff, S.A., Pounds, S., Cheng, C., Ma, J., et al. (2004). Gene expression profiling of pediatric acute myelogenous leukemia. Blood104, 3679–3687.
Schoch, C., Kohlmann, A., Schnittger, S., Brors, B., Dugas, M., Mergenthaler, S., Kern, W., Hiddemann, W., Eils, R., and Haferlach, T. (2002). Acute myeloid leukemias with reciprocal rearrangements can be distinguished by specific gene expression profiles. Proc. Natl. Acad. Sci. U S A99, 10008–10013.
Sekeres, M.A., Elson, P., Kalaycio, M.E., Advani, A.S., Copelan, E.A., Faderl, S., Kantarjian, H.M., and Estey, E. (2008). Time from diagnosis to treatment initiation predicts survival in younger, but not older, acute myeloid leukemia patients. Blood113, 28–36.
The Cancer Genome Atlas Research Network (TCGA), Ley, T.J., Miller, C., Ding, L., Raphael, B.J., Mungall, A.J., Robertson, A.G., Hoadley, K., Triche, T.J., Laird, P.W., et al. (2013). Genomic and epigenomic landscapes of adult de novo acute myeloid leukemia. N. Engl. J. Med.368, 2059–2074.
Virtaneva, K., Wright, F.A., Tanner, S.M., Yuan, B., Lemon, W.J., Caligiuri, M.A., Bloomfield, C.D., de La Chapelle, A., and Krahe, R. (2001). Expression profiling reveals fundamental biological differences in acute myeloid
leukemia with isolated trisomy 8 and normal cytogenetics. Proc. Natl. Acad. Sci. U S A98, 1124–1129.
Welch, J.S., Ley, T.J., Link, D.C., Miller, C.A., Larson, D.E., Koboldt, D.C., Wartman, L.D., Lamprecht, T.L., Liu, F., Xia, J., et al. (2012). The
origin and evolution of mutations in Acute Myeloid Leukemia. Cell150, 264–278.
Yan, X.-J., Xu, J., Gu, Z.-H., Pan, C.-M., Lu, G., Shen, Y., Shi, J.-Y., Zhu, Y.-M., Tang, L., Zhang, X.-W., et al. (2011). Exome sequencing identifies somatic mutations of DNA methyltransferase
gene DNMT3A in acute monocytic leukemia. Nat. Genet.43, 309–315.
Zwiener, I., Frisch, B., and Binder, H. (2014). Transforming RNA-Seq data to improve the performance of prognostic gene signatures. PLoS One9, e85150.
iScience, Volume
23
Supplemental Information
Scalable Prediction of Acute Myeloid
Leukemia Using High-Dimensional
Machine Learning and Blood Transcriptomics
Stefanie
Warnat-Herresthal,
Konstantinos
Perrakis,
Bernd
Taschler,
Matthias
Becker, Kevin Baßler, Marc Beyer, Patrick Günther, Jonas Schulte-Schrepping, Lea
Seep, Kathrin Klee, Thomas Ulas, Torsten Haferlach, Sach Mukherjee, and Joachim L.
Schultze
Figure S1
A
78
Acute Myeloid Leukemia Chronic L Chronic Myeloid Leukemia
ymphocytic Leukemia
Acute L
ymphocytic Leukemia
Acute Megakaryoblastic Leukemia Myelodysplastic Syndrome DS
T
ransient Myeloproliferative Disorder
health
y
Breast cancer Chronic
Allogr
aft Nephropath
y
Clinically Isolated Syndrome Cystinosis Dengue f
e v er Diabetes T ype I Diabetes T ype II Endar terectom y Operation Glomer ulosclerosis Imm unosuppression Inf ection Juvenile Idiopathic Arthritis J uv enile Der matom y ositis L yme disease
Multiple Sclerosis Nephr
itis Nephropath y Nephrosclerosis Per iodontitis Plasmodium viv ax challenge
Pnemonitis Polycystic Disease Sarcoidosis schiz
ophrenia
Sepsis Systemic Lupus Erythematosus Transplant Rejection Unkno
wn Cancer Kidne y Disease V accination W egener' s Gr an ulomatosis GSE10255 0 1-5 6-10 11-20 21-50 51-100 > 100 GSE1159 GSE12417 GSE12995 GSE13425 GSE14471 GSE14895 GSE16129 GSE25571 GSE26281 GSE33315 GSE34860 GSE37642 GSE43176 GSE4698 GSE51082 GSE6269 GSE67684 GSE83449 GSE8879 GSE9006 GSE9476 unpublished GSE10358 GSE10792 GSE11083 GSE12187 GSE12662 GSE13159 GSE13351 GSE13501 GSE13576 GSE14062 GSE14468 GSE14615 GSE15061 GSE15434 GSE16015 GSE16214 GSE17855 GSE18323 GSE18497 GSE19314 GSE21029 GSE21261 GSE21545 GSE22707 GSE22762 GSE22845 GSE26713 GSE27383 GSE27562 GSE28460 GSE34205 GSE35784 GSE42038 GSE42057 GSE43777 GSE46480 GSE47051 GSE49695 GSE50772 GSE60926 GSE61804 GSE62156 GSE63270 GSE66002 GSE6751 GSE67596 GSE68720 GSE68735 GSE68790 GSE68833 GSE6891 GSE70536 GSE7440 GSE76705 GSE7757 GSE78132 GSE79545 GSE87072 GSE9960 GSE63085 GSE32874 GSE58335 GSE86884 GSE63703 GSE63646 GSE63816 GSE72790 GSE81259 GSE85712 GSE45735 GSE64655 GSE87186 GSE49642 GSE52656 GSE62190 GSE66917 GSE6703 GSE61162
Dataset 1
Dataset 2
Dataset 3
Number of samples
Other diseases
Leukemia
29 8 9 9 63 37 38 90 4 4 4 6 9 3 13 49 20 74 29 29 60 101 22 40 10 50 50 4 3 8 26 17 120 52 77 24 538 8 512 3 156 1 237 7 93 130 286 62 16 158 12 24 71 43 27 82 22 263 14 9 14 14 13 13 16 119 229 15 22 59 61 22 43 72 101 94 97 24 6 40 12 240 139 13 42 20 196 42 18 7 29 4 12 9 6 11 47 84 20 6 11 16 3 6 3 54 55 8 119 9 6 3 4 12 143 38 75 99 100 283 207 96 98 64 23 42 64 108 79 98 49 107 45 45 1 50 16 48 107 204448 76 520 74 56 39 20 36 31 109 529 18 45 280 525 100 118 190Figure S2
A
B
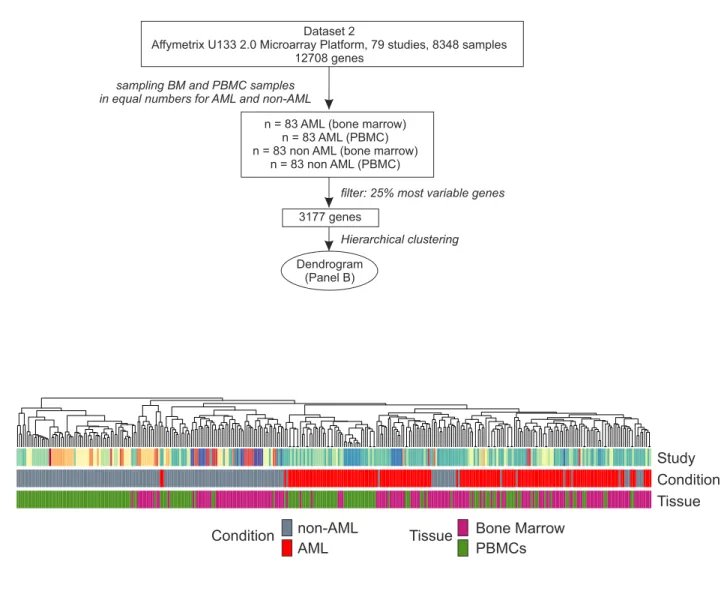
Study
Condition
Tissue
Condition
non-AML
Bone Marrow
PBMCs
AML
Tissue
1
Dataset 2
Affymetrix U133 2.0 Microarray Platform, 79 studies, 8348 samples 12708 genes
n = 83 AML (bone marrow) n = 83 AML (PBMC) n = 83 non AML (bone marrow)
n = 83 non AML (PBMC)
sampling BM and PBMC samples in equal numbers for AML and non-AML
3177 genes
filter: 25% most variable genes
Hierarchical clustering
Dendrogram (Panel B)