1
An Efficient Recommender System Using Locality Sensitive Hashing
Kunpeng Zhang University of Maryland [email protected]
Shaokun Fan Oregon State University [email protected]
Harry Jiannan Wang University of Delaware Chinese University of Hong
Kong, Shenzhen [email protected]
Abstract
Recommender systems are widely used for personalized recommendation in many business applications such as online shopping websites and social network platforms. However, with the tremendous growth of recommendation space (e.g., number of users, products, etc.), traditional systems suffer from time and space complexity issues and cannot make real-time recommendations when dealing with large-scale data. In this paper, we propose an efficient recommender system by incorporating the locality sensitive hashing (LSH) strategy. We show that LSH can approximately preserve similarities of data while significantly reducing data dimensions. We conduct experiments on synthetic and real-world datasets of various sizes and data types. The experiment results show that the proposed LSH-based system generally outperforms traditional item-based collaborative filtering in most cases in terms of statistical accuracy, decision support accuracy, and efficiency. This paper contributes to the fields of recommender systems and big data analytics by proposing a novel recommendation approach that can handle large-scale data efficiently.
1. Introduction
Recommender systems automatically identify recommendations for individual users based on historical user behaviors and have changed the way websites interact with their users [1]. Recommender systems are considered as a powerful method that allows users to filter through large volume of information. For example, Amazon and other similar online vendors strive to present each user with some recommended products that they might like to buy based their purchasing history or purchasing decisions made by other similar customers. Due to the exponential growth of big data, traditional recommender systems have been challenged for its scalability. Recently, various methods have been proposed to for the development of scalable
recommendation systems. For example, researchers proposed to use matrix factorization to map users or items to vectors of factors and reduce the number of dimensions [2]. Despite all these advances in recommender systems, the current recommender systems are still not entirely satisfactory. Current recommendation systems cannot make real-time recommendations when dealing with extremely large-scale data [3]. This paper aims to improve the efficiency of recommendation systems while preserving a similar level of accuracy.
Collaborative filtering (short for CF), especially item-based CF has been widely used in recommender systems for ecommerce websites [2]. It works by building a matrix of item preference by users. If item i similar to item j, it will be recommended to a user with high probability if the user likes item j. However, when the number of users and number of items are large, item-based CF has two fundamental challenges. The first challenge is the time complexity. Item-based CF is computationally expensive because it needs to calculate similarity scores for all pairs of items. These similarity scores will be used for predicting preferences. The second challenge is the space complexity. The original input user-item matrix in the traditional item-based CF is too large to fit in memory. These challenges become more significant nowadays as we have much bigger data on users and items than ever before. For example, Amazon has about 400 million unique products for on their website (https://www.scrapehero.com/how-many-products-are-sold-on-amazon-com-january-2017-report/). Thus, finding information of interest from big data for assisting us to make informed decisions requires computationally scalable and efficient techniques.
In this paper, we address these challenges by incorporating an efficient similarity finding algorithm (both time and space) into recommender systems. Locality sensitive hashing (short for LSH) uses signature matrix to approximately preserve similarity while significantly reducing dimension of data [4]. For binary data, we employ a well-known hashing strategy called minHash formed by minwise-independent permutations. For real-valued data, we use simHash Proceedings of the 51st Hawaii International Conference on System Sciences|2018
URI: http://hdl.handle.net/10125/49985 ISBN: 978-0-9981331-1-9
(CC BY-NC-ND 4.0)
2
formed through random-hyperplanes summarization. Further, we divide signatures into bands and hash each band into buckets of a global hash table to reduce the number of similarity calculations. Two items hashed into at least one same bucket are considered to be a similar candidate pair. We show that this band hashing method can guarantee low false positive and low false negative rates. To evaluate the LSH based CF (short for LSH-CF), we generate 6 different synthetic datasets and collect two real-world datasets from Facebook. We apply LSH-CF and traditional item-based CF to these datasets and compare their performance. We find that generally LSH-CF is more efficient than item-based CF regardless of data size and type. Especially LSH-CF is suitable for a large number of high-dimensional real-valued items.To summarize, this paper has the following contributions:
• We build a framework of recommender system that incorporates LSH into CF to improve both time and space efficiency without losing recommendation accuracy;
• We conduct experiments on both binary and real-valued data to empirically compare LSH-CF with traditional item-based CF;
• We implement both minHash and simHash and apply them to recommending Facebook interest.
2. Literature Review
In this section, we briefly review the previous research efforts related to recommender systems and locality sensitive hashing.
Recommender systems can be built through many approaches and have been successfully deployed in many businesses, such Amazon.com [5] and Netflix.com [6], social networks [7], and research papers [8]. Collaborative filtering algorithms have been widely used for recommendation systems [9]. Other technologies have also been applied to recommender systems, including Bayesian networks, clustering, and content-based methods. Bayesian networks are effective for environments where knowledge of user preferences changes slowly with respect to the time needed to build the model but are not suitable for environments where user preference models must be updated rapidly or frequently. Clustering techniques usually produce less-personal recommendations than other methods, and in some cases, the clusters have worse accuracy than nearest neighbor algorithms [10]. Despite all these efforts, the current recommender systems still require further improvement to make recommendation methods more effective and applicable [11, 12]. The recommendation algorithms
mentioned above are not suitable for real-time response when an extremely large-scale data needs to be processed.
The fundamental problem in recommender systems is to find similar items. There are various similarity-based techniques developed for similarity identification, including cosine similarity, correlation similarity, etc. Locality sensitive hashing is one of the state-of-the-art efficient algorithms that approximately preserving similarity but with significant dimension reduction. Minwise-independent permutations form an LSH for Jaccard coefficient, which was originally proposed in 1998 [13]. It was later used for similarity search in high dimensional data [14]. The basic idea is to hash the data points so as to ensure that the probability of collision is much higher for objects that are close to each other than for those that are far apart. Researchers introduced the idea of using random-hyperplanes to summarize items in a way that respects the cosine distance for real-valued data [15]. It was also suggested that random hyperplanes plus LSH could be more accurate at detecting similar documents than minhashing plus LSH [16]. Techniques for summarizing data points in a Euclidean space are covered in [17]. Their scheme works directly on points in the Euclidean space without embedding and their experiments show that their data structure is up to 40 times faster than kd-tree. As data becomes huge, the distributed layered LSH scheme focusing on the Euclidean space under l2 norm was proposed [18]. It can exponentially decrease the network cost while maintaining a good load balance between different machines.
In addition to theoretical contributions in LSH, researchers from various domains used LSH to solve many real applications. For example, LSH was used to compute image similarity and then detected loop closures by using visual features directly without vector quantization as in Bag-of-Words approach [19]. Researchers also used collaborative filtering through minHash clustering for generating personalized recommendations for users of Google News [20]. LSH techniques had also been used to quickly and accurately index a large collection of images [21].
3. Overall Framework
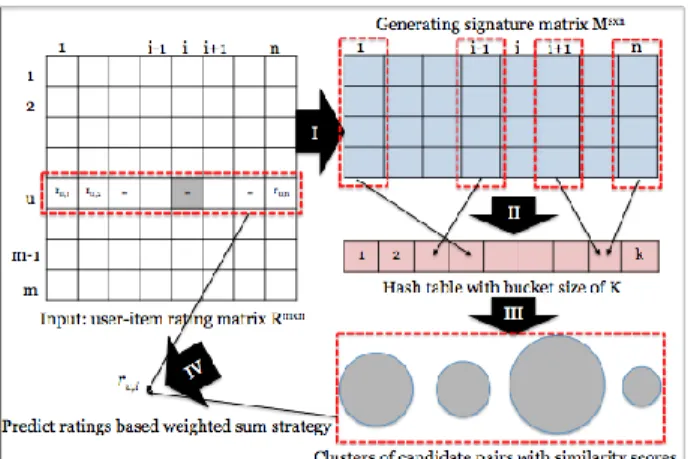
Figure 1 shows the entire framework of the LSH-CF recommender system. The input of the system is the user-item rating matrix Rm×n and a user ID. The
output is the top-N recommended items for that user based on predicted preference scores.
3
Figure 1. The LSH-CF FrameworkThere are four major steps in our framework:
Step I: minHash or simHash is used to create signature matrix Ms×n depending on whether data are binary or
real values.
Step II: Signatures are hashed into a hash bucket.
Step III: If signatures of two vectors are hashed into the same bucket at least once, these two vectors are likely to be similar therefore we consider them as a candidate pair.
Step IV: Recommendations are generated using the weighted sum strategy. Rather than using similarity scores from all other items, we only focus on similarity scores from candidate pairs. The clusters of candidate pairs allow us to reduce the number of similarity calculations to calculate preference scores for unknown entries and increase time and space efficiency.
The details of each step are discussed in the next section.
4. Methodology
In this section, we first formally define item-based CF approach and its disadvantages (especially the time and space complexity for large-scale data). Then, we explain the details of the four steps described in Section 3.
4.1. Item-based Collaborative Filtering
The goal of an item-based collaborative filtering is to predict the utility or preference of a certain item for a given user based on user’s previous likes, ratings, or opinions on other similar items. In a typical CF recommender system, there is a list of m users U={u1,
u2, …, um} and a list of n items I={i1, i2, …, in}, where
usually m>>n. Each user ui can express opinions on a
subset of items. Each item ik can also receive opinions
from multiple users. Opinions can be explicitly represented by the continuous rating scores within a certain numerical scale or can be implicitly derived
from the raw data, for example, the number of purchasing records for the pair of (user, product), the browsing time length for a pair of (user, webpage), the sentiment of comments for the pair of (user, Facebook page), etc. It is possible to have users who never rate any items and items which never receive any ratings. This is called “cold-start” problem that will not be discussed in this paper. Traditional item-based CF systems aims to find items that a given user prefers with high probability.
Item-based CF systems receive the entire
user-item rating matrix R as input and a user ID. Each entry ri,j in R denotes the preference score (ratings) of
the user ui on item ij. ri,j is unknown if item j has not
been rated by user i. The first important step is to calculate similarity scores for all pairs of items S={s1,2,
s1,3, …, si,j, …, sn-1,n}, where |S|=n(n-1)/2. To calculate
similarity of two items (i, j), we could choose various vector distance measures such as cosine-based (see Equation 1), correlation-based (see Equation 2), etc. The second important step is to predict the value of each unknown entry using weighted sum strategy (used in this paper due to its simplicity, see Equation 3) or regression-based method. (1)
U u u j j U u ui i U u ui i u j j j ir
r
r
r
r
r
r
r
S
2 , 2 , , , ,)
(
)
(
)
)(
(
(2)
k items similar all , k items similar all , , ,)
(
*
k i k u k i i uS
r
S
P
(3)The most time consuming operations in item-based CF is similarity calculation for all pairs of items, especially when the number of items (n) becomes large. Once we obtain similarity scores, it is fast to recommend items for a given user. The time complexity of item-based CF is approximately O(n*n*m) where m is the number of users. It is infeasible to deploy this algorithm directly in a real-time system because n is in a magnitude of thousands in practice. For a real system, it usually caches all similarity scores that can be computed offline and only needs to be updated if needed when the matrix R changes. On the other hand, the size of the user-item rating matrix is too large to fit in memory. For example, for a small matrix R with 100,000 users and 10,000 items (compared with Amazon with more than 300 million users and 400 million items), it approximately takes about 8 Gigabytes memory size when read these double numbers in Java. One possible solution to this memory overflow issue is that using
4
sparse matrix representation to avoid storage from unknown entries. It is helpful for mid-size and highly sparse matrix rather than large-scale and dense matrices. Another practical solution is partial read, meaning that only read entries related to two items for calculating their similarity. But it requires many extra computations such as filtering operation, frequent file I/O, etc.4.2.
Signature Generation Using Hashing
Locality sensitive hashing is an algorithm for solving the approximate nearest neighbor search in high dimensional spaces. It is an approach of transforming the data item to a low dimensional representation, or equivalently a short code consisting of a sequence of bits. It is based on the definition of LSH family H (see formal definition below), a family of hash functions mapping similar vectors to the same hash code with higher probability than dissimilar vectors. One of the most popular LSH methods (minHash) invented in 1997 is extensively studied in theory and widely used in practice in various applications (clustering, duplicate detection, etc.), especially for large-scale data [22]. There are two aspects focused by researchers in LSH community: (1) developing LSH family for various distances or similarities. In this paper, we describe two commonly used hashing algorithms for data transformation: Jaccard similarity based minHash for binary data and cosine similarity based simHash for general real-valued data [15]; (2) exploring the theoretical boundary (both time and space) for LSH family under specific distances or similarities. Since the main topic of this paper is improving the efficiency of item-based CF by incorporating LSH without lowering performance, we will not discuss too much about theoretical boundary, which can be found in [15].
Definition: Locality Sensitive Hashing A family H is called (d1, d2, p1, p2)-sensitive if for any two
vectors
x
,
y
Î
R
mand h chosen uniformly from H satisfies the following two conditions.(1) If similarity score sim(x, y) >= d1, then PrH(h(x) = h(y)) >= p1
(2) If similarity score sim(x, y) <= d2, then PrH(h(x) = h(y)) <= p2
The distance can be obtained through similarity via D(x, y) = 1 – sim(x, y). These parameters especially d1 and d2 can be adjusted based on the application. We can make d1 and d2 as close as we wish. Then the penalty is that typically p1 and p2 are close as well. It is
possible to drive p1 and p2 apart while keeping d1 and d2 fixed.
4.2.1 minHash for Binary Data. For binary data, Jaccard similarity is usually used to measure how close sets are, although it is not really a distance measure. That is, the closer sets are, the higher the Jaccard similarity. It is defined as the ratio of the sizes of the intersection and union of two sets A and B: JS(A, B) = . For example, two binary (0 or 1 for each element) vectors A=(0,0,1,1,1,0,0,1) and B=(0,1,1,1,1,1,0,0), their Jaccard similarity is 3/8.
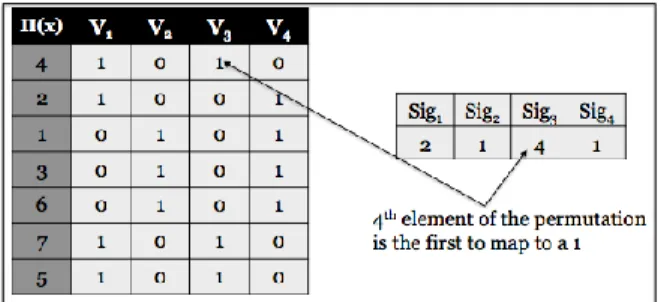
Figure 2. minHash Signature Example We want to find a hash function h to transform our data into a low-dimension vector such that (1) if two data items (x, y) are similar under some similarity measures, then with high probability h(x)=h(y), and (2) if (x, y) are dissimilar, then with high probability h(x)≠h(y). minHash is suitable hash function for Jaccard similarity. It is defined as “hπ(x) = the number of the first row, in the permuted order, in which the column x has value 1”. Let’s take four vectors V1, V2, V3, and V4 shown in Figure 2 for example, if the permutation ( ) vector of rows is (4, 2, 1, 3, 6, 7, 5)T
(‘T’: transpose), then (V1) = 2, (V2) = 1, (V3)=4, and (V4) = 1. There is a remarkable connection between minhash and Jaccard similarity of two vectors that are minhashed.
Theorem 1: The probability that the minhash function for a random permutation of rows produces the same value for two vectors C1 and C2 equals the Jaccard similarity of those sets, which is Pr[hπ(C1) = hπ(C2)] = sim(C1, C2).
Proof: For two column vectors C1 and C2, rows can be divided into the following three types:
(1) Type I rows have 1 in both columns.
(2) Type II rows have 1 in one of the columns and 0 in the other.
(3) Type III rows have 0 in both columns.
Since the matrix is sparse, most rows are of type III. Let x rows of type I and y rows of type II. Then similarity of C1 and C2 sim(C1, C2)=x/(x+y). x is the
size of the intersection of C1 and C2 and x+y is the size of C1 union C2.
Now let’s consider the probability that hπ(C1) =
hπ(C2). If we image the rows permuted randomly, and
5
we scan all rows from the top, the probability that we shall meet a type I row before we meet a type II row is x/(x+y). If we meet a type II row, then we know hπ(C1)≠ hπ(C2). For type III rows, they are irrelevant to
minhash. We conclude the probability that hπ(C1) =
hπ(C2) is x/(x+y), which is also the Jaccard similarity of
C1 and C2.
Based on the definition of LSH, the family of
minhash functions is a (d1, d2, 1-d1, 1-d2)-sensitive family for any d1 and d2, where . We can use s different permutations (minhash functions) to create a signature vector for each item vector and consequently result in a signature matrix associating to the original input matrix, where n is the number of column vectors. This signature matrix also significantly reduces the data size from m*n integers to s*n integers that can be easily fit into memory. As we all know that permuting rows even once is prohibitive. Our solution is using row hashing and we develop a one-pass implementation shown in Algorithm 1.4.2.2 simHash for Real-Valued Data. minHash is used for binary data, however, most applications have real-valued data and the distance between two vectors are measured by cosine similarity. simHash does similar process to minHash but for real-valued data. It randomly projects high-dimensional vector to low dimensional bit signatures such that cosine distance is approximately preserved.
The following steps describe the generation of bit signatures Sig1, Sig2 for two high-dimensional vectors V1, V2 . V1 and V2 can form a hyperplane P and they make an angle θ between them.
(1) Uniformly randomly pick s hyperplanes {h1, h2, …,
hs} in the dimensional space that is orthogonal to
P and intersect P at the origin.
(2) For each hyperplane hi, if the projection of vector
onto hi is positive, we generate a bit 0, 1 otherwise.
Intuitively, if two vectors are similar (the angle θ is small), then it is likely to have same bits for most hyperplanes. The large size of bit signatures can reduce the error between true cosine from original vectors and approximate cosine from two-bit signatures while at the cost of computing time. To find a balance between cheap and accurate, the typical size of bit signature is 64 in real practice. Let’s look at an example of generating 8-bit signatures for two-dimension vectors as shown in Figure 3. For two-dimension vector, if it locates above the line, the corresponding bit is 0, 1 if below.
Figure 3. simHash Bit Signature Example simHash originates from the concept of sign random projections (SRP) [23]. Given two vectors V1 and V2, SRP utilizes a random vector w from a random hyperplane with each component generated from i.i.d. Gaussian distribution and only stores the sign of the projected data. The collision under SRP satisfies the following equation in [reference]: Pr(hw(V1) = hw(V2))
= , where . The term
is the cosine similarity for V1 and V2. Since is monotonic with respect to cosine similarity,
simHash is a (d1, d2, , ,)
or a (d1, d2, 1-d1/180, 1-d2/180)-sensitive family of hash functions. The simple simHash algorithm is implemented in Algorithm 2. In addition, this signature matrix also significantly reduces the size from m*n integers to s*n bits (1 integers = 32 bits in Java) that can be easily fit into memory for fast processing in later steps.
6
4.3. Hashing Signature and Finding Candidate
Pairs
The signature matrix created from hashing significantly reduces the dimensionality of vectors while approximately preserving similarities. But it still needs O(n2) time for comparing all pairs of
signature columns to find similar vectors, which is not efficient enough for real-time recommendation. In this section, we will discuss the second important component of LSH to efficiently find candidate similar pairs. It basically involves three operations: partition, hashing, and counting. Before these operations, we define a hash table HT with k buckets. We could make k as large as possible for avoiding hash collision. The pictorial example to describe these steps is shown in Figure 4.
Figure 4. Example of Hashing Band
• Partition: we first divide M into b bands of r rows each: {b1, b2, …, bb}, the last band may have less
than r rows. B and r are parameters and they can
be tuned based on the threshold of vector similarity (sim).
• Hashing: For each band, hash its portion of each column to HT.
• Counting: Count the number of times two columns are hashed into the same bucket. The higher the count, the more confident we can say two vectors are very similar. In practice, candidate column vectors are those that hash to the same bucket for at least 1 band.
Another question we have not answered yet is that what is the mechanism to adjust parameters based on the similarity threshold. To simplify the problem, we make an assumption that there are enough buckets that columns are unlikely to hash to the same bucket unless they are identical in a particular band. Let’s denote t to be similarity score of two vectors V1 and V2 (t = sim(V1, V2)).
Theorem 2: The probability that at least 1 band identical is 1-(1-tr)b.
Proof: Now we pick any band bi (r rows).
The probability that all rows in bi are equal is tr.
The probability that at least one row in bi is unequal is
1 – tr.
The probability that no bands are identical is (1 – tr)b.
The probability that at least 1 band is identical is 1-(1-tr)b.
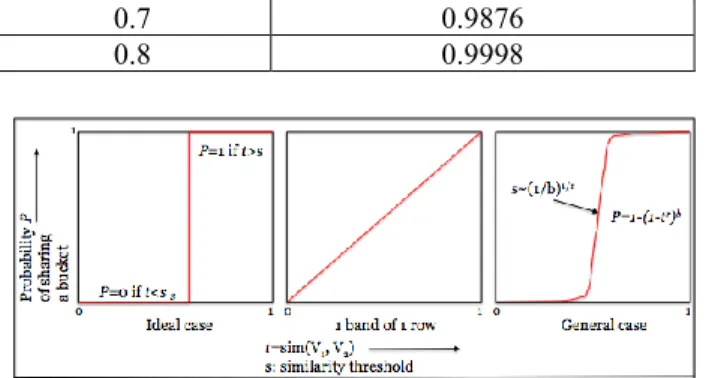
Three sub-figures in Figure 5 show the ideal case, 1 band of 1 row, and a general case, respectively. For example, the signature matrix has 64 rows (64 minhash signatures or 64 bit signatures from simhash). We divide it into b=16 bands of r=4 rows each. The similarity threshold s is set to 0.8. Then from the Table 1, we could find that 99.98% pairs of truly similar document if they have at least one band hashed into the same bucket. It is about 1/5,000th of the 80%-similar column pairs are false negative. Similarly, The false positive is also low. Approximately 2.53% pairs of items with similarity 0.2 end up becoming candidate pairs. These false positive can be removed during the following similarity calculation process for recommendation use (if the similarity score of two candidate vectors is less than the threshold, they are false positive).
Table 1. Example of probability of sharing a bucket given a similarity threshold
Similarity threshold s P=1-(1-s r)b 0.1 0.0016 0.2 0.0253 0.3 0.1220 0.4 0.3396 0.5 0.6439 0.6 0.8915 Page 785
7
0.7 0.9876
0.8 0.9998
Figure 5. Analysis of LSH for Different Cases
4.4. Prediction and Recommendation
Traditional item-based CF is not efficient (both in time and space) for large-scale data, regardless of binary or real-valued. The most time-consuming part is similarity calculation for all pairs of items. LSH solves the approximate in a high-dimension space by creating low-dimension signatures while preserving similarity. After LSH, we obtain all candidate pairs. Then we calculate their similarity scores. In this section, we discuss how to incorporate LSH into item-based CF for efficient recommendation without losing performance.
In item-based CF system, for any item Ii, we have a
list of similarity scores from all other items: {S1,i, S2,i,
…, Sn-1,i, Sn,i}. In our recommendation system, we also
have a list for each item: L = {Sk,i | }. The
size varies for different items and is much less than n for most items. Each element in this list together with Ii
forms a candidate pair from the LSH process. During the recommendation step, we use top-N nearest neighbors to calculate predicted values for unknown entries. Suppose we want to calculate the rating score for user Uu on item Ii using weighted sum strategy. The
following equation 4 is used.
otherwise
S
r
S
N
L
if
S
r
S
r
N k i k N k k u i k L k i k L k k u i k i u 1 ' , 1 ' , ' , 1 , 1 , , ,*
*
(4)Where
S
k',iis the kth similarity score in the list L in adescending order,
r
u',kis the corresponding rating from user u on the corresponding item. To output the binary ratings, we use the threshold of 0.5. If the predictedrating is large than threshold, we change it to 1, 0 otherwise.
5. Evaluation
To show the efficiency and accuracy of LSH-CF, we use both synthetic and real-world data to run computational experiments. We compare results from traditional item-based CF with those from LSH-CF recommender system in terms of three aspects: running time consumed, memory spaces to store the matrix, and the accuracy of recommended items to users. All our experiments were implemented using Python and Apache Mahout machine learning package. We ran all our experiments on an OS X based Mac PC with Intel Core i7 processor having speed of 3.4GHz and 16GB of RAM.
5.1 Datasets
Synthetic data. We first randomly generate three matrices with different dimensionalities for binary and real-valued data, respectively. For binary data, each column vector (denoting an item) is generated under the binomial distribution Bin(m, 0.7), where 0.7 is the probability of getting 1s. This also determines the
sparsity level (SL): .
For real-valued data, we first fix the SL and then non-zero elements are randomly generated under a Gaussian distribution. To make these numbers relevant to star ratings on a five-point scale, we first generate matrix use N(2.5, 1) and then change 0 elements to 1.
Facebook data. Our real-world data is collected from a popular social media platform: Facebook. We use Facebook Graph API to download data from about 13,000+ public pages in different categories, such as celebrities, sport teams, food/beverages, retailers, etc. On each page, we get user-page interaction information, including users’ “likes”, “comments”, and “shares” for all posts from the first day when the page was founded on Facebook to January 1, 2013. Each page is considered as an item. “Likes” is the only information used for deriving binary data. If user u likes a page i, then ru,i=1 regardless of the number of
times he/she liked. An item never liked by a user leads to an unknown entry. For the real-valued user-item matrix in Facebook, we use the number of historical activities to represent user’s preference on a page. This is actually considered to be a Facebook public page (or interest) recommender system. For both, we choose 1,000 pages (items) and 10,000 users at random. As we mentioned before, we do not consider cold-start
8
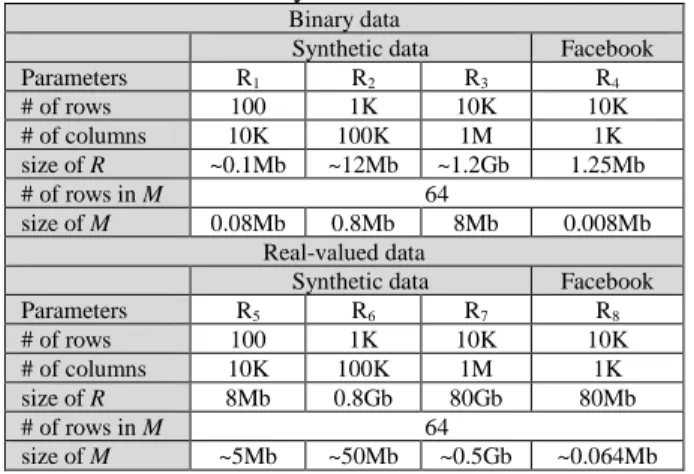
problem in this paper. The summary of our datasets (see Table 2) shows that each signature matrix can significantly reduce the size of the data up to 1,200+ times.Table 2. Summary of datasets Binary data
Synthetic data Facebook
Parameters R1 R2 R3 R4 # of rows 100 1K 10K 10K # of columns 10K 100K 1M 1K size of R ~0.1Mb ~12Mb ~1.2Gb 1.25Mb # of rows in M 64 size of M 0.08Mb 0.8Mb 8Mb 0.008Mb Real-valued data
Synthetic data Facebook
Parameters R5 R6 R7 R8 # of rows 100 1K 10K 10K # of columns 10K 100K 1M 1K size of R 8Mb 0.8Gb 80Gb 80Mb # of rows in M 64 size of M ~5Mb ~50Mb ~0.5Gb ~0.064Mb
LSH can approximately keep similarity after dimension reduction. In the section of analysis of LSH, we already show that false positive and false negative based on parameters are low. We check the difference between similarity scores from original item vectors and signature vectors to check how good the approximation is. Therefore, we randomly choose 1,000 different item pairs and their corresponding signature vectors from two big matrices R3 and R7, respectively. It is not easy to show 1,000 pairs in a plot. We then further randomly pick 100 out of 1,000 pairs to show their similarities (see Figure 6). It tells us that the difference is small regardless of data format (binary or real-valued), data size, and similarities within data. The average difference of all 1,000 pairs is 0.058 and 0.067 for R3 and R7, respectively.
Figure 6. Signature similarity and vector similarity from R3 and R7
5.2 Evaluation Metrics
Researchers have employed many types of measures for evaluating the quality of a recommender system. They are mainly falling into two categories: statistical accuracy and decision support accuracy (DSA).
Statistical accuracy evaluates the accuracy of a system by comparing the numerical/binary recommendation scores against the actual user ratings. Mean Absolute Error (MAE) is widely used and measuring the deviation of predicted values from their true values. It calculates the average on all absolute errors of rating-prediction pair <ru,i, pu,i>. Formally,
where N is the number of pairs, ru,i is the actual
rating from user u on item i, and pu,i is the
corresponding predicted rating. The lower the MAE, the more accurately the recommender system makes predictions. For the binary data, we use the Jaccard similarity accuracy (JSA) to measure the predicted preference and the actual preferences. The recommender system with higher JSA is better.
Decision support accuracy evaluates how effective the recommender system is at helping users select preferred items. It measures whether users really choose items with high predicted ratings and really not select items with low predicted ratings. For our real data, we first divide our data into training (January 1, 2009 - May 1, 2012) and testing portion (May 2, 2012 - January 1, 2013). We then randomly select K (e.g., 100) users and recommend each m (e.g., 10) items that are not in their interest lists during the training period. Then we count the number of items (denoted as Ni) the
ith user is interested in the testing period. “Interested”
means that they have activities (“like”, “comment”, or “share”) on that item. Formally, DSA is . The higher the DSA, the better quality our recommender system achieves. In addition, we use weighted sum strategy to predict ratings for each unknown entry. In this experiment, we use top 30 similar items instead of all other items.
In addition, we especially want to show the efficiency of our recommender system. It can be measured by the running time.
5.3 Results
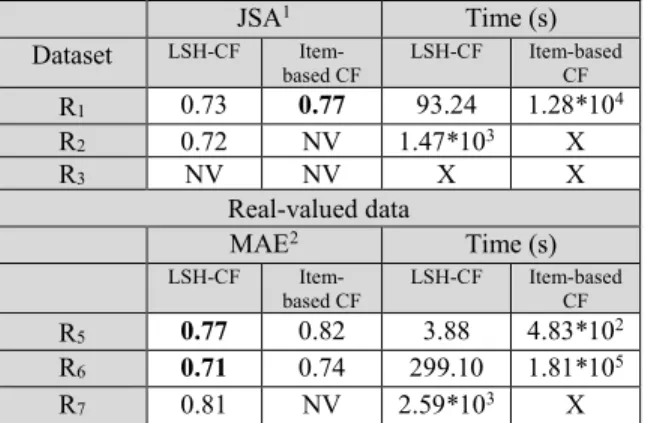
We apply both traditional item-based CF and the proposed LSH-CF to the eight datasets. The experiment results mainly include two parts: accuracy and efficiency. For accuracy, we randomly hide 1,000 existing ratings for each matrix and calculate corresponding MAE and JSA. We find that LSH-CF significantly improves efficiency over item-based CF in most cases regardless of data, which can be up to in a magnitude of thousand times (see Table 3 and Table 4).
Table 3. Comparisons for statistical accuracy and time
Synthetic data
9
JSA1 Time (s) Dataset LSH-CF Item-based CF LSH-CF Item-based CF R1 0.73 0.77 93.24 1.28*104 R2 0.72 NV 1.47*103 X R3 NV NV X X Real-valued data MAE2 Time (s) LSH-CF Item-based CF LSH-CF Item-based CF R5 0.77 0.82 3.88 4.83*102 R6 0.71 0.74 299.10 1.81*105 R7 0.81 NV 2.59*103 X‘X’ means the calculation cannot finish within a day and ‘NV’ means no values because we could not finish them. For binary synthetic data, JSA of LSH-CF is slightly lower than item-based CF because we convert our numerical predicted ratings to binary and probably lose some accuracy. For real-valued synthetic data, LSH-CF obtains lower MAE than item-based CF. For Facebook data, both algorithms get low DSA because user historical activity may not be a good indicator of his/her future interest. LSH-CF has higher DSA than item-based CF, because it only focuses on potentially similar items for preference prediction. However, item-based CF uses top-N similar items for preference calculation no matter how similar these N items to the focal item. In addition, LSH-CF is much faster for real-valued data than binary data because set operations when calculating Jaccard similarity are slow comparing to cosine similarity for two real-valued vectors. We further find that item-based CF performs faster than LSH-CF for small number of binary high dimensional data as indicated by R4 in Table 4, because permutation operations take time for binary data. However, item-based CF becomes less efficient if the number of items increases.
Table 4. Comparisons for decision support accuracy and time
DSA3 Time (s) Dataset Item-based CF LSH-CF Item-based CF LSH-CF Facebook binary: R4 0.63 0.58 415.26 888.17 Facebook Real-valued: R8 0.73 0.76 144.80 25.73
6. Conclusions
Traditional item-based collaborative filtering techniques are not suitable for real-time
1 The higher JSA, the better the system is. 2 The lower MAE, the better the system is. 3 The higher DSA, the better the system is.
recommendation when dealing with large-scale data. This paper proposed an efficient recommender system by incorporating hashing strategies, which can approximately preserve similarities after significant dimension reduction. Two hashing methods, minhash for binary data and simhash for real-valued data, and similar candidate pair identification were used to increase the efficiency of similarity computing, which is the most time-consuming task for traditional CF-based recommender systems. We used generate synthetic data and collected real-world data from Facebook to evaluate the proposed LSH-CF method. The experimental results showed that LSH-CF generally outperforms item-based CF in terms of statistical accuracy, decision support accuracy, and efficiency regardless of data size and format. Specifically, LSH-CF outperforms item-based CF when the number of items is in a magnitude of thousands.
The method proposed in this paper can significantly improve the accuracy and efficiency of large-scale recommendation systems. Ecommerce platforms with huge number of items or users can utilize the method to provide users with near better recommendations. Traditional recommendation systems computes user similarity or item similarity offline and assume the similarities do not change frequently. However, this is not realistic for real businesses. Hundreds of transactions may happened in an Ecommerce website per second. Without considering the most recent transactions, the recommendation result may not reflect the best interest of users. The LSH-CF computes all similarities in real time and thus provides accurate results in a dynamic business environment. For users of Ecommerce websites or social media websites, they can benefit from the proposed method and receive recommendations that are computed based on their real-time activities.
Distributed computing using Hadoop is a good alternative and has been successfully deployed by industries. Implementing LSH-CF using MapReduce or Spark is one of our future work to further improve the performance of recommender systems. In addition, finding other locality sensitive hashing families for other distance measures and incorporating content or external knowledge (attributes of items, item-item networks, etc.) into LSH-CF can also be thought as a way to improve the accuracy of recommender systems.
7. References
[1] Bigdeli, E., and Bahmani, Z. "Comparing accuracy of cosine-based similarity and correlation-based similarity algorithms in tourism recommender systems," 4th IEEE
10
International Conference on (21-24 2008) Management of Innovation and Technology, pp. 469-474, 2008.[2] Koren, Y., Bell, R., and Volinsky, C. "Matrix factorization techniques for recommender systems," Computer, Vol. 42, Issue 8, pp. 30-37, 2009.
[3] Schnabel, T., Bennett, P. N., Dumais, S. T., & Joachims, T. "Using shortlists to support decision making and improve recommender system performance. " In Proceedings of the 25th International Conference on World Wide Web (pp. 987-997), 2016.
[4] Ding, K., Huo, C., Fan, B., Xiang, S., & Pan, C. In Defense of Locality-Sensitive Hashing. IEEE transactions on neural networks and learning systems, 99, pp. 1-17, 2017. [5] Smith, B., & Linden, G., Two Decades of Recommender Systems at Amazon. com. IEEE Internet Computing, 21(3), 12-18, 2017.
[6] Gomez-Uribe, C.A. and Hunt, N., "The netflix recommender system: Algorithms, business value, and innovation." ACM Transactions on Management Information Systems (TMIS), 6(4), p.13, 2016.
[7] Buettner, Ricardo. "A Framework for Recommender Systems in Online Social Network Recruiting: An Interdisciplinary Call to Arms." 2014 47th Hawaii International Conference on System Sciences (HICSS), IEEE, 2014.
[8] Beel, J., Gipp, B., Langer, S., and Breitinger, C. Research-paper recommender systems: a literature survey. International Journal on Digital Libraries, 17(4), 305-338, 2016.
[9] Li, C., & He, K., CBMR: An optimized MapReduce for item‐based collaborative filtering recommendation algorithm with empirical analysis. Concurrency and Computation: Practice and Experience, 29(10), 2017.
[10] Breese, J. S., Heckerman, D., and Kadie, C. "Empirical analysis of predictive algorithms for collaborative filtering," In proceedings of the 14th conference on Uncertainty in Artificial Intelligence, pp. 43-52, 1998.
[11] Adomavicius, G., and Tuzhilin, A. "Toward the next generation of recommender systems: a survey of the state-of-the-art and possible extensions," IEEE Transaction on Knowledge and Data Engineering, Vol. 17 Issue 6, pp. 734-749, 2005.
[12] Lu, J.
,
Wu D., Mao M., Wang W., Zhang G., "Recommender system application developments: A survey." Decision Support Systems Vol. 74, pp. 12-32, 2015. [13] Broder, A. Z., Charikar, M., Frieze, A. M., and Mitzenmacher, M. "Min-wise independent permutations,"ACM Symposium on Theory of Computing, pp. 327-336, 1998.
[14] Gionis, A., Indyk, P., and Motwani, R. "Similarity search in high dimensions via hashing," In proceedings of International Conference on Very Large Databases, pp. 518-529, 1999.
[15] Charikar, M. "Similarity estimation techniques from rounding algorithms," ACM Symposium on Theory of Computing, pp. 380-388, 2002.
[16] Henzinger, M. "Finding near-duplicate web pages: a large-scale evaluation of algorithms," In Proceedings of 29th SIGIR Conference, pp. 284-291, 2006.
[17] Datar, M., Immorlica, N., Indyk, P., and Mirrokni, V. S. "Locality-sensitive hashing scheme based on p-stable distributions," Symposium on Computational Geometry, pp. 253-262, 2004.
[18] Bahmani, B., Goel, A., and Shinde, R. "Efficient distributed locality sensitive hashing," In Proceedings of the 21st ACM International Conference on Information and Knowledge Management, pp. 2174-2178, 2012.
[19] Shahbazi, H., and Zhang, H. "Application of locality sensitive hashing to realtime loop closure detection," IEEE/RSJ International Conference on Intelligent Robots and Systems, pp. 1228-1233, 2011.
[20] Das, A., Datar, M., and Garg, A. "Google news personalization: scalable online collaborative filtering," In Proceedings of the 16th International Conference on World Wide Web, pp. 271-280, 2007.
[21] Aly, M., Munich, M. and Perona, P. "Indexing in large scale image collections: scaling properties and benchmark," In IEEE Workshop on Applications of Computer Vision (WACV), pp. 418-425, 2011.
[22] Broder, A. "On the resemblance and containment of documents," In Proceedings of the Compression and Complexity of Sequences, pp. 21-29, 1997.
[23] Shrivastava, A., and Li, P. "In defense of minhash over simhash," In proceedings of AISTATS, pp. 886-894, 2014.
![Figure 3. simHash Bit Signature Example simHash originates from the concept of sign random projections (SRP) [23]](https://thumb-us.123doks.com/thumbv2/123dok_us/1458079.2695048/5.918.119.818.95.1071/figure-simhash-signature-example-simhash-originates-concept-projections.webp)