SOCIALLY RESPONSIBLE INVESTING, UPDATED
presented by Cejay A. Kim and Terence WaiThesis Project submitted in Partial Fulfilment of the Requirements for the degree of Master of Business Administration
In the Global Asset and Wealth Management Program of the Faculty of
Business Administration
© Cejay A. Kim and Terence Wai 2009 SIMON FRASER UNIVERSITY
Fall 2009
All rights reserved. However, in accordance with the Copyright Act of Canada, this work may be reproduced, without authorization, under the conditions for Fair Dealing. Therefore, limited reproduction of this work for the purposes of private study, research, criticism, review and news reporting is likely to be in accordance
2
Approval
Name: Cejay A. Kim and Terence Wai
Degree: Master of Business Administration Title of Project: Socially Responsible Investing, Updated
Supervisory Committee: __________________________________________________________ Dr. Peter Klein Senior Supervisor __________________________________________________________ Dr. Jijun Niu Second Reader Date Approved: __________________________________________________________
3
Abstract
This paper extends Statman (2000) by applying his methodology and the Fama-French three factor model to different time periods. For this paper, we have also applied Statman (2000) methodology to an alternate benchmark to explore how our results may be affected by the choice of market proxy. Our results are consistent with Statman (2000), showing that when using Jensen’s Alpha, the FTSE KLD 400 Social Index (KLD400), Formerly the KLD's Domini 400 Social Index, performed better than the S&P 500 index for the periods 1990-1998, 1998-2009, and for the full sample period of 1990-2009. Once again, the excess returns for each period were statistically insignificant. The results were somewhat supported when the Fama-French three factor model was used. The KLD400 outperformed the S&P 500 during the period of 1990-1998. However, it underperformed during the period of 1998-2009. Overall, the KLD400 generated excess returns over the S&P 500 for the full period of 1990-2009. One important difference in the Fama-French three factor model results was the KLD400’s alpha during the first period of 1990-1998 was statistically significant, while the other two periods remained statistically
insignificant. Finally, we applied Jensen’s Alpha to KLD Research & Analytics Inc.’s published benchmark, the FTSE All World USA Index (FTS1US). While we were unable to replicate the sample period, the results were in line with the previous analysis. The time period of 1994-1998 resulted in the KLD400 generating alpha; no excess returns for 1998-2009; and excess returns during the full period of 1994-2009. Once again, the alphas generated during all time periods were statistically insignificant.
4
Acknowledgments
We would like to thank our senior supervisor Dr. Peter Klein for his patience and support. We would also like to thank Dr. Jijun Niu for generously offering his time to be our second reader.
5
Table of Contents
APPROVAL………2 ABSTRACT………3 ACKNOWLEDGMENTS………..4 TABLE OF CONTENTS………5 INTRODUCTION……….………6 LITERATURE REVIEW………...8THE FTSE KLD 400 SOCIAL INDEX (KLD400)………..14
DATA AND SUMMARY STATISTICS………...15
METHODOLOGY……….17
APPLYING AN ALTERNATE BENCHMARK………26
ALPHA DURING KLD400’S INITIATION……….29
WHAT ARE THE REASONS FOR THIS OUTPERFORMANCE?...33
CONCLUSION……….………35
BIBLIOGRAPHY………..37
6 Introduction
“The world is a dangerous place, not because of those who do evil, but because of those who look on and do nothing.”
-Albert Einstein
“Action springs not from thought, but from a readiness for responsibility.” -Dietrich Bonhoeffer
“Every person is responsible for all the good within the scope of his abilities, and for no more.”
- Mary Abigail Dodge
…Just a few inspiring quotes from a fairly diverse group of influential people. A topic that has been debated throughout the generations, social responsibility has the effect of appealing to a very wide audience. Not surprisingly, investment styles and products were created that appealed to the investor using the basis of ‘the greater good’ and higher returns as incentive.
Socially responsible investing (SRI) is a style of investing that combines asset management with corporate responsibility and societal concerns. Though not entirely a new concept, SRI has gained tremendous momentum since the late 1990s, and now accounts for almost 11 percent of assets under management in the United States or $2.71 trillion (2007). The Social Investment Forum defines three ways an investor is able to utilize SRI in their investment decisions:
1. Screening (positive or negative), the process of evaluating portfolios or funds on a social, environmental, or corporate governance criterion.
2. Shareholder advocacy, when investors take an active role as stakeholders or owners in pressuring companies on issues of social, environmental, and corporate governance concerns.
7 3. Community investing, the process of directing capital from investors to communities that are underserved by traditional financial institutions. In Statman (2000), the raw returns and the risk-adjusted returns of the Domini Social Index (now the KLD400) were higher than the S&P 500 during the period of 1990-1998. It is important to note that the difference was not statistically
significant. Statman implied that socially responsible investors would like to satisfy their moral conscience without sacrificing returns, and investing in SRI funds do not fall short of either. Thus, answering the obvious question of whether investing according to SRI principles and in a restricted investment universe has a cost. Nevertheless, his analysis was somewhat limited and we chose to extend it by applying some robustness tests for this outperformance. We chose to extend Statman’s paper (2000) as his initial analysis only encompassed the period 1990-1998. We extended his methodology, Jensen’s Alpha, to cover the period 1990-2009, and investigated the updated results. Moreover, we applied Fama and French’s three factor model to the data to ensure our results were consistent and introduced a new benchmark to further reinforce our findings. Hence, the different
methodologies, time periods, and benchmarks were essentially the robustness tests in determining the validity of SRI’s outperformance.
The KLD400 data was available via KLD Research & Analytics’ website, data for the Fama and French three factor model was obtained from Kenneth r. French’s
website, and the S&P 500, T-Bill, and FTSE All World USA Index data were all retrieved from Bloomberg.
8 Literature Review
As mentioned earlier, the topic of socially responsible investing has been an academic issue investigated deeply. The guide of this paper is Statman (2000); however, there are other studies that should be highlighted for a more
comprehensive understanding of this issue.
In 2005, Zakri Y. Bello published a paper entitled “Socially Responsible Investing and Portfolio Diversification” to compare socially responsible funds to conventional funds. Bello tested whether SRI funds are less diversified than conventional funds, or if SRI funds have greater market risk. For his data, he used 42 SRI funds and 84 conventional funds from the time period January 1994 to March 2001, and
calculated his results using Residual Variance, the Sharpe ratio and eSDAR. In the analysis of variance and regression analysis, residual variance is the component that cannot be attributed to specific causes, in this case market risk.
To calculate Residual Variance, the following formulas were used:
Rp,t =αp+βpRm,t +εp,t (1)
Where:
Rp,t= Return to a portfolio p at time t
αp= Alpha of portfolio p
βp= Beta of portfolio p
Rm,t= Return to the market at time t
εp,t= Error term
σp2 =β
p
2σ
9 Where:
σp2= Variance of portfolio returns
σm2= Variance of market returns (σε2p/n)= Variance of the error term
Accordingly, the Residual Variance as a fraction of the total variance is calculated as:
RV =1−(βp2σ
m2)/σp2 (3)
The RV should be greater if the SRI Funds had greater unsystematic risk relative to conventional funds.
The Sharpe Ratio is a measure that explains whether excess returns in a portfolio are due to superior investment decisions or simply a result of taking on excess risk. The greater the Sharpe Ratio, the better its risk-adjusted performance has been in the past. Bello calculated the ratio as:
Sp =(Rp,t−Rm,t)/σD (4)
Where:
σD= Standard deviation of the differential return
Bello also used the eSDAR in his analysis; however, we will expand on this formula later on in the paper as it was one of the tools Dr. Statman used in his own analysis.
Bello’s results indicated that the risk-adjusted returns of the SRI funds were
indistinguishable relative to the returns of conventional funds. Moreover, the beta of SRI funds was not significantly higher than conventional funds when the S&P 500 was used as the benchmark. Lastly, the residual variance of SRI funds was not higher
10 than the residual variance of conventional funds. To summarize, Bello did not find conclusive evidence that SRI funds were any different from conventional mutual funds.
Another paper that investigates the performance of SRI funds is Bauer, Derwall, and Otten’s piece, “The Ethical Mutual Fund Performance Debate: New Evidence from Canada” (Bauer et al. 2007). Bauer et al. compared eight ethical funds to 267 conventional mutual funds from the period January 1994 to January 2003. Strictly using Canadian data, Bauer et al. used Jensen’s Alpha and Fama and French’s multi factor model in their methodology. We explain Jensen’s Alpha in greater detail in our methodology; however, Bauer et al. used a variation of Fama and French’s multi factor model that is worth explaining. Using the average ethical and conventional mutual fund data, they estimated the following equations:
Rit−Rft =αi+β0i(Rm−Rft)+β1iSMBt +β2iHMLt+β3iMOMt+εit (5) And Rit−Rft =αi+β0i(Rm−Rft)+β1iSMBt+β2iHMLt+β3iMOMt+β4iUSt+εit (6) Where:
Rit = Return on mutual fund i in month t
Rft = Risk-free rate at t measured by the 30-day T-Bill rate
αi = Jensen’s Alpha
β0i = Market risk exposure of the fund
Rm = Return on the market proxy in month t
β1i = Beta of historical excess returns of small cap companies over big cap
companies
SMBt = Small (market capitalization) minus big (market capitalization) returns
β2i = Beta of historical excess returns of high book-to-price ratio companies over
11
HMLt = High (book-to-price ratio) minus low (book-to-price ratio) returns β3i = Beta of the return difference between a portfolio of winners and losers
MOMt = Return difference between a portfolio of past 12-month winners and a
portfolio of past 12-month losers in month t
β4i = Beta of the excess returns of the CAD over the S&P 500
USt = Excess Canadian dollar return on the S&P500 index at t
εit = Error term
Using Jensen’s Alpha, Bauer and company found no significant difference in the performance between ethical and conventional mutual funds. Moreover, their single factor model containing a standard market proxy had more explanatory power than the ethical equity index. This result questions the unique component of ethical mutual funds. Bauer et al. also found no significant difference in the performance between ethical and conventional mutual funds when using a multi factor model.
A frequently cited paper is Geczy, Stambaugh, and Levin (2005), “Investing in Socially Responsible Mutual Funds”. In their analysis, Geczy et al. used 35 no-load SRI funds and 859 no-load traditional mutual funds from a time period of July 1963 through to December 2001. In their methodology they select and combine domestic mutual funds to form portfolios with optimal ex-ante Sharpe ratios. Each investor constrains their investment universe to those funds that practice socially
responsible investing. Geczy et al. then evaluate the cost of this constraint by
comparing the optimal portfolio under the SRI constraint to those of portfolios with no constraints at all.
Geczy et al. conclude that there is a trade-off between returns and social moral depending on what fraction of a portfolio is restricted to SRI funds and the prior
12 beliefs of pricing models and manager skill. Geczy and company found that the cost of the SRI constraint is 1 or 2 basis points per month, but only when an investor believes strongly in the CAPM and maintains a disbelief in the skill of a manager; or when their allocation to SRI funds is small. When an investor believes strongly in a multi factor model, or in the skill of a manager, or when the majority of an investor’s fund is allocated to SRI funds, the costs of the SRI constraint can be economically significant. Thus, when funds are allocated to SRI funds, there are lower returns; however, the difference is significant under certain conditions.
An additional paper we reviewed was Galema, Plantinga, and Scholtens’ work (2009): “The Stocks at Stake: Return and Risk in Socially Responsible Investment.” In their investigation they used the DSI Index as well; however, used a shorter sample period of July 1992–June 2006. Galema and company used the same
methodology as Bauer et al, and also employed a variation. Firstly, they used Fama-French’s three factor model expanded with the Carhart momentum factor:
Rt,i−RFt =
α
i+β
i(RMt−RFt)+siSMBt +hiHMLt+miMOMt+ε
t,i (7)In addition to testing individual portfolio returns, Galema et al. also tested the returns on a differenced portfolio:
Rt,i,s−Rt,i,c=
α
i+β
i(RMt −RFt)+siSMBt+hiHMLt+miMOMt +ε
t,i (8)Where:
Rt,i,s = Return on one of the six strength portfolios
13 Galema et al. sought out to clarify the existing difference between SRI funds and stock returns as the majority of the literatures do not find a significant relationship. They suggest two potential reasons of this result. First, the SRI scores’ aggregate analysis may eliminate any relationship of individual factors of SRI have opposite effects on its performance. There is almost no evidence for this explanation. Second, the analysis of stock returns, most researchers use the Fama and French regression to control risk, namely the HML factor. Because SRIs result in lower book-to-market ratios, the alphas do not capture all of the SRI effects. Finally, Galema and company establish that SRIs that have a positive score in diversity, environment and product have a significant impact on stocks.
Finally, we will briefly mention Statman (2000): “Socially Responsible Mutual Funds”; however, will not go too far in depth as his research is mentioned several times throughout this paper. Statman examined 31 SRI funds and 62 traditional funds using the time period 1990-1998. Applying Jensen’s Alpha and eSDAR, Statman found that SRI funds had higher returns; however, not statistically significant.
Though academically debated throughout the world, apparently researchers still cannot agree on the relationship between SRI and conventional stock returns. However, there seems to be an ongoing consensus of favourable methodologies to use in regression analysis. Moreover, as the time period for the data increases, one
14 would expect accuracy to increase and different approaches to be more eagerly utilized.
The FTSE KLD 400 Social Index (KLD400)
Formerly the Domini 400 Social Index, the KLD400 is an index of socially
responsible stocks introduced by KLD Research & Analytics Inc. in May 1990. It was the first benchmark index that used environmental, social and governance factors and is arguably the recognized benchmark for socially responsible investing. The KLD400 is a common stock index of US equities that is market capitalization-weighted and float-adjusted.
According to KLD Research & Analytics Inc.’s website, the index is a composition of holdings at approximately 90 percent large cap companies, 9 percent mid cap companies chosen for sector diversification, and 1 percent small cap companies with exemplary social and environmental records.
Companies will not be eligible for the KLD400 if they are involved in alcohol, tobacco, firearms, gambling, nuclear power, and military weapons. Moreover, companies that do not meet specific financial screens will also be excluded.
For the KLD400, companies are selected if they have positive social and environmental records based on the following criteria: community relations, diversity, employee relations, human rights, product quality and safety,
15 environment and corporate governance. Companies may be removed due to
corporate actions, violations of exclusionary screens or poor social or environmental performance.
Data and Summary Statistics
As mentioned previously, data for this paper was obtained primarily from three sources: KLD Research & Analytics, Inc.’s website, Kenneth R. French’s website and from Bloomberg. In line with Statman (2000), the data used in this paper was all monthly. The analysis was primarily for three different time periods: 1990-1998 (Statman’s original sample period), 1998-2009, and 1990-2009.
The calculation of Jensen’s Alpha included: KLD400’s historical performance
obtained from KLD Research & Analytics, Inc’s website, and S&P 500 and T-Bill data retrieved from Bloomberg.
The calculation of Fama and French’s three factor model included S&P 500 and T-Bill data from Bloomberg, KLD400 data from KLD Research & Analytics, Inc.’s website, and portfolio data from Kenneth R. French’s website.
As stated on Kenneth R. French’s website, the portfolios used in the formation of their three factor model were constructed at the end of each June, and were the intersections of five portfolios formed on size (market equity), and five portfolios formed on the ratio of book equity to market equity. The size breakpoints for year t
16 were the NYSE market equity quintiles at the end of June of t. BE/ME for June of year t is the book equity for the last fiscal year end in t-1 divided by ME for
December of t-1. The BE/ME breakpoints are NYSE quintiles. The portfolios for July of year t to June of t+1 include all NYSE, AMEX, and NASDAQ stocks for which we have market equity data for December of t-1 and June of t, and (positive) book equity data for t-1.
When we applied the FTSE All World USA Index as the alternative benchmark, all data was retrieved from Bloomberg.
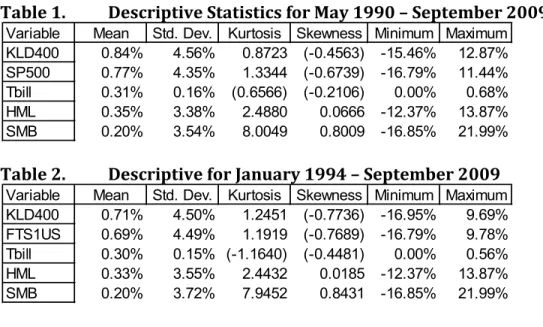
Table 1. Descriptive Statistics for May 1990 – September 2009
Table 2. Descriptive for January 1994 – September 2009
For the sample period of May 1990 – September 2009, the KLD400 had a higher mean of 0.84 percent versus 0.77 percent of the S&P 500. The KLD400 had a slightly higher standard deviation of 4.56 percent relative to the benchmark of 4.35 percent. The minimum and maximum of monthly returns for the KLD400 were better than the respective returns of the S&P 500, with a minimum of -15.46 percent compared
Variable Mean Std. Dev. Kurtosis Skewness Minimum Maximum KLD400 0.84% 4.56% 0.8723 (-0.4563) -15.46% 12.87% SP500 0.77% 4.35% 1.3344 (-0.6739) -16.79% 11.44% Tbill 0.31% 0.16% (0.6566) (-0.2106) 0.00% 0.68% HML 0.35% 3.38% 2.4880 0.0666 -12.37% 13.87% SMB 0.20% 3.54% 8.0049 0.8009 -16.85% 21.99% Variable Mean Std. Dev. Kurtosis Skewness Minimum Maximum KLD400 0.71% 4.50% 1.2451 (-0.7736) -16.95% 9.69% FTS1US 0.69% 4.49% 1.1919 (-0.7689) -16.79% 9.78% Tbill 0.30% 0.15% (-1.1640) (-0.4481) 0.00% 0.56% HML 0.33% 3.55% 2.4432 0.0185 -12.37% 13.87% SMB 0.20% 3.72% 7.9452 0.8431 -16.85% 21.99%
17 to -16.79 percent, and a maximum of 12.87 percent compared to 11.44 percent. From Table 1, using the S&P 500 as the benchmark, the KLD400 appeared to be the better investment, with greater returns and less downside.
In Table 2, using the FTSE All World USA Index as the benchmark, the KLD400 performed almost the same for the period of January 1994 – September 2009. The mean return for the KLD400 was 0.71 percent relative to the benchmark of 0.69 percent. The risk was almost the same with the KLD400 at 4.50 percent, and the benchmark at 4.49 percent. The minimum and maximum of monthly returns were better for the benchmark than the KLD400. The FTS1US index had a range of -16.79 percent to 9.78 percent, while the KLD400’s returns had a range of -16.95 percent to 9.69 percent.
Methodology
Table 3. The Performance of the KLD400 Relative to the S&P 500 using Jensen’s Alpha, May 1990 - September 1998; October 1998 - September 2009; May 1990 - September 2009
(t-statistics in parentheses)
*The annualized arithmetic returns are less than the geometric means because rather than compounded, the monthly returns are multiplied by 12. The annualized standard deviation return was calculated as the monthly standard deviation multiplied by the square root of 12.
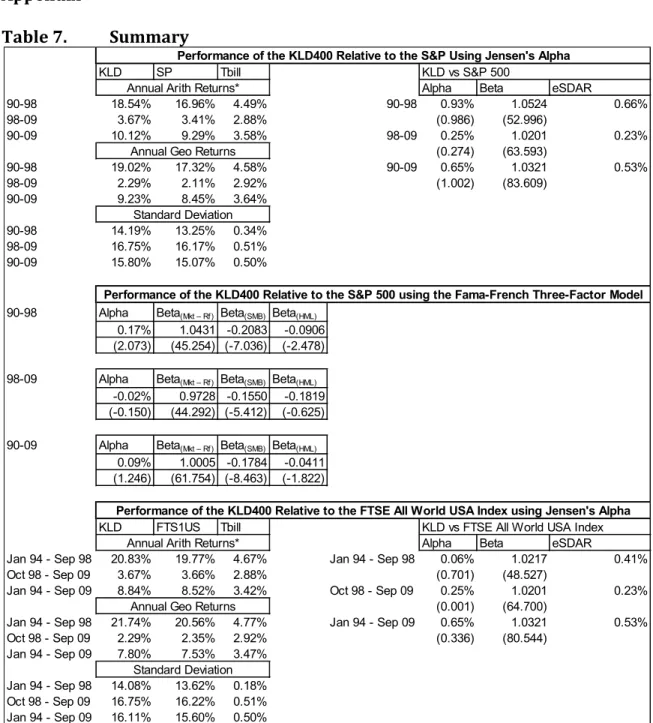
18 The results in Table 3 are a combination of Statman’s research and an extension of the same research using additional time periods. The results of Statman’s research for the period of May 1990 – September 1998 showed the KLD400 had annual arithmetic and geometric returns of 18.54 percent and 19.02 percent, and a standard deviation of 14.19 percent. The S&P 500 had annual arithmetic and geometric returns of 16.96 percent and 17.32 percent, and a lower standard deviation of 13.25 percent. Statman’s research showed SRI funds have slightly higher returns with a higher level of risk for that period. There are many theories and arguments surrounding the outperformance of the SRI funds compared to generic mutual funds, these issues will be discussed later in the paper. This section will focus on our theory that excess returns for SRI funds should diminish over time. The results in the extension of Statman’s research support this theory.
When we applied the Statman’s methodology to the period of October 1998 – September 2009, the annual arithmetic and geometric returns for the KLD400 were 3.67 percent and 2.29 percent, and the standard deviation was 16.75 percent. The S&P 500 for the same period had annual arithmetic and geometric returns of 3.41 percent and 2.11 percent, with a standard deviation of 16.17 percent. The
outperformance of the SRI funds is clearly diminished for the more recent 11-year period.
For further analysis, we extended Statman’s research for the full period of May 1990 – September 2009. The annual arithmetic and geometric returns for the KLD400
19 were 10.12 percent and 9.23 percent, and the standard deviation was 15.80 percent. The S&P 500 for the same period had annual arithmetic and geometric returns of 9.29 percent and 8.45 percent, with a standard deviation of 15.07 percent. We continue to see the overall performance of SRI funds to be slightly higher than the S&P 500, but the magnitude of the outperformance has clearly lessened than in the period of Statman’s research.
Statman’s research used Jensen’s Alpha as another measure of the performance of SRI funds. Jensen’s alpha (also known as Jensen’s Performance Index, ex-post alpha) is used to determine the excess returns of a portfolio over the expected return of the portfolio. In this case, the expected return was the KLD400 and the benchmark was the S&P 500. The formula used was:
RKLD −RF =αKLD +βKLD(RSP −RF)+εKLD (9)
Where:
= Monthly return of the 30-day US T-bill
RKLD = Monthly return of the KLD
RSP = Monthly return of the S&P 500
αKLD = Excess returns of the KLD
βKLD = Beta of KLD to the S&P 500 εKLD = Residual
We first examined our results over Statman’s sample period of May 1990 – September 1998. The beta was 1.0524, indicating that the KLD400 was slightly riskier than the S&P 500. This was in line with the volatility results in Table 3. The alpha between the same periods was 0.94 percent, though not statistically
significant. Using Jensen’s alpha, we saw a positive excess return from the
20 regression model, but the low t-statistic of the alpha term questioned the SRI
products as a superior investment product over the S&P 500.
Applying the same method to the period of October 1998 – September 2009, the beta of the KLD400 against the S&P 500 was 1.0201; though smaller than the previous period, the KLD400 remained slightly riskier than the S&P 500. The alpha has decreased to 0.25 percent, remaining statistically insignificant. Again, the results may not be meaningful, but looking at the alpha terms alone, the decrease in the period of 1998-2009 further supports the theory that excess returns for SRI funds are slowly diminishing with time.
Finally, we looked at the full period of May 1990 – September 2009. The beta was 1.0321, with a statistically insignificant alpha of 0.65 percent. Once again, the alpha and beta have decreased since Dr. Statman’s initial analysis. One argument for the superior performance in the early periods is when SRIs first became popular in the 1990s, the initial surge in volume to KLD400 stocks could have accounted for the excess returns. Evaluating current data, the excess returns have decreased,
indicating that the market has been pricing the increase in volume. We will continue to explore this phenomenon later on in the paper.
Statman’s analysis also used a risk measure called the “excess standard-deviation-adjusted return,” or eSDAR. This risk measure is essentially a modified version of
21 the Sharpe ratio (Statman 1987; Modigliani and Modigliani 1997) and is
represented by:
eSDAR=RF +
[
(
RKLD−RF)
/SDKLD]
SDSP−RSP (10)Where:
= Monthly return of the 30-day US T-bill = Monthly return of the KLD
= Monthly return of the S&P 500
SDKLD = Standard deviation of the return of the KLD
SDSP = Standard deviation of the return of the S&P 500
In Figure 1, the annualized arithmetic return for the KLD400 and the S&P 500 in the period of October 1998 – September 2009 was 3.67 percent and 3.41 percent,
respectively. The KLD400 performed slightly better, however, its standard deviation of 16.75 percent was also higher than the S&P 500’s of 16.17 percent. Thus, the eSDAR of the KLD400 was 0.23 percentage points a year, indicating that the
KLD400’s higher returns added to its performance more so than its higher standard deviation.
RF
RKLD
22 Figure 1.
The eSDAR of the KLD400 for the period of May 1990 – September 2009 is shown in Figure 2. The annualized arithmetic return for the KLD400 and the S&P 500 was 10.12 percent and 9.29 percent. The annualized standard deviation of returns for the KLD400 and the S&P 500 is 15.80 percent and 15.07 percent. Once again, the return and the inherent risk of the KLD400 are higher than the S&P 500.
Nevertheless, the eSDAR of the KLD400 is 0.53 percentage points a year showing that the KLD400’s higher returns added more to its performance than its higher standard deviation.
23 Figure 2.
When the KLD400 is leveraged to match the S&P 500’s standard deviation, the eSDAR of the KLD400 is the excess return over the S&P 500. In Table 3, we see the eSDAR results of 0.66 percent from Statman’s research for the initial period of May 1990 – September 1998. For the subsequent period of October 1998 – September 2009, the eSDAR was 0.23 percent. The full period of May 1990 – September 2009 had an eSDAR of 0.53 percent. Again, the risk adjusted excess return is lower for the recent period and much higher for the earlier period when the KLD400 was first introduced.
24 To support our results, we expanded our analysis and applied the Fama-French three factor model to see if the excess returns correspond with the results described earlier. While Jensen’s alpha only uses one factor, beta, to compare excess returns, Fama-French used two additional factors: the historical excess returns of small cap companies over big cap companies, and the historical excess returns of value companies over growth companies. The Fama-French three factor model is:
RKLD −RF =αKLD+βKLD(RSP−RF)+βSMBSMB+βHMLHML (11)
Where:
RF = Monthly return of the 30-day US T-bill
RKLD = Monthly return of the KLD
RSP = Monthly return of the S&P 500
αKLD = Excess returns of the KLD
βKLD = Beta of KLD to the S&P 500
βSMB = Beta of historical excess returns of small cap companies over big cap
companies
SMB = Small (market capitalization) minus big (market capitalization) returns
βHML = Beta of historical excess returns of high book-to-price ratio companies over
low book-to-price ratio companies
HML = High (book-to-price ratio) minus low (book-to-price ratio) returns Table 4. The Performance of the KLD400 Relative to the S&P 500 using
the Fama-French Three-Factor model for the periods May 1990 - September 1998, October 1998 - September 2009, May 1990 - September 2009
25 Comparing the Fama-French three factor model to Jensen’s Alpha, the results were fairly similar. For the initial period in Statman’s research, May 1990 – September 1998, the alpha was 0.17 percent with a statistically significant result. This further supports Statman’s research in showing that the KLD400 was slightly superior to conventional investments. Nevertheless, the return was picayune when transaction costs and taxes are taken into account. The market beta of 1.0431 validated the higher volatility in SRI investments during this period.
For the next period of October 1998 – September 2009, the results were notably different. Although insignificant, the alpha term was -0.02 percent with a market beta of 0.9728. Both methods showed a drop in alpha compared to the initial
sampling period when comparing the result to Jensen’s Alpha. Once again, it may be a sign of diminishing returns for the KLD400.
The full period of May 1990 – September 2009 continued with our theorized trend. Although an insignificant alpha of 0.09 percent, the beta was 1.0005, which was almost perfectly correlated to the market. These results provided no support that investing in socially responsible stocks equated to excess returns. The apparent time to take advantage of SRI was during the KLD400 initiation. Arguments could be drawn in this research for data mining, but that is plausible. However, the time periods were selected based on comparing the results of Statman’s research to a more recent period. Similar analysis could be carried out using different time
26 periods, but we expect to see similar results of diminishing excess returns in socially responsible investments.
Applying an Alternate Benchmark
KLD Research & Analytics Inc.’s benchmark for the KLD400 is the FTSE All World USA Index. To enrich our analysis, we have derived the alphas, betas, and eSDAR for the KLD400 using the FTSE All World USA Index as the benchmark. Table 5
contains the results for the extended analysis. Data for the FTSE All World USA Index was unavailable for the same time periods used in Statman’s research. Therefore we used the period of January 1994 – September 2009 as the sampling period.
Using a different index than the S&P 500, the results again complemented our view on excess returns in socially responsible investing. In the period of January 1994 – September 1998, the annual arithmetic and geometric returns were 20.83 percent and 21.74 percent, compared to the benchmarks returns of 19.77 percent and 20.56 percent. Yet again, there are higher returns for socially responsible investments for the initial sampling period. Looking at the volatilities, the standard deviation of the KLD400 was 14.08 percent while the benchmark was 13.62 percent.
The results in the later sampling period of October 1998 – September 2009 were in line with our expectations. The KLD400 arithmetic and geometric returns were 3.67 percent and 2.29 percent annually, while FTSE All World USA Index returns were
27 3.66 percent and 2.35 percent annually. It is clear there was little to no excess
returns for this more recent 11-year period. Moreover, the standard deviation of the KLD400 was higher at 16.75 percent compared to the benchmark of 16.22 percent. The socially responsible investment was riskier and performed no better than the index. Would not the index be a better investment especially since indexing
provides a much lower management fee? As stated in Geczy et al.’s research, we saw the higher costs of socially responsible investing, and this was definitely not a positive attribute to the returns observed in this period.
The full period of January 1994 – September 2009 netted excess returns, but these excess returns have declined since the initial sampling period. The KLD400 had annual arithmetic and geometric returns of 8.84 percent and 7.80 percent, while the FTSE All World USA Index had 8.52 percent and 7.53 percent. The standard
deviations were consistent with the subsample period analysis, higher for the
KLD400 at 16.11 percent, and lower for the benchmark at 15.60 percent. Comparing the full period returns to the initial period, we saw a decrease in the excess returns of socially responsible investments.
28 Table 5. The Performance of the KLD400 Relative to the FTSE All World
USA Index using Jensen’s Alpha, Jan 1994- September 1998; October 1998- September 2009; Jan 1994- September 2009 (t-statistics in parentheses)
*The annualized arithmetic returns are less than the geometric means because rather than compounded, the monthly returns are multiplied by 12. The annualized standard deviation return was calculated as the monthly standard deviation multiplied by the square root of 12.
Applying Jensen’s Alpha to the KLD400 against the FTSE All World USA Index, the initial period of January 1994 – September 1998 showed little difference between the two. The regression resulted in an insignificant alpha of 0.06 percent and a beta of 1.0217 and does not support any excess returns for socially responsible investing. However, adjusting for the risk differences, the excess standard-deviation-adjusted return (eSDAR) is 0.41 percent. Once again, the higher volatility of SRI and the introduction of this new investment style could have attracted investors and slightly inflated returns.
Would our theory apply to the more recent 11-year period? The answer was yes; we saw not only a decline in excess returns, but also none according to the
29 KLD400 had a statistically insignificant alpha of 0.00 percent, and was slightly
riskier than the market with a beta of 1.0173. For the first time in our analysis, the KLD400’s eSDAR was negative at -0.02 percent indicating for this time period the higher standard deviation investment netted below benchmark returns.
Lastly, for the overall period of January 1994 – September 2009, the KLD400 had a statistically insignificant alpha of 0.02 percent and a beta of 1.0191. Not much support from the regression results, but the eSDAR for the KLD400 index was 0.11 percent, which showed a decline from the initial sample period.
Alpha During KLD400’s Initiation Table 6. Annualized Alpha Table
*Not mentioned in the paper, however, noted for comparability
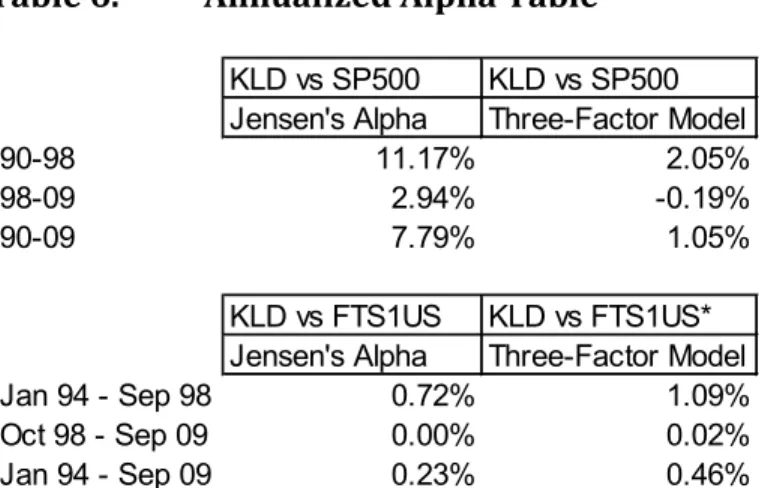
It is evident there were excess returns in the initiation years of socially responsible investing. However, applying the same methodologies as Statman’s research to the different periods and benchmarks, the enthusiasm for socially responsible investing seems to be slowing down. Table 6 contains the annualized alphas from our
KLD vs SP500 KLD vs SP500 Jensen's Alpha Three-Factor Model
90-98 11.17% 2.05%
98-09 2.94% -0.19%
90-09 7.79% 1.05%
KLD vs FTS1US KLD vs FTS1US* Jensen's Alpha Three-Factor Model
Jan 94 - Sep 98 0.72% 1.09%
Oct 98 - Sep 09 0.00% 0.02%
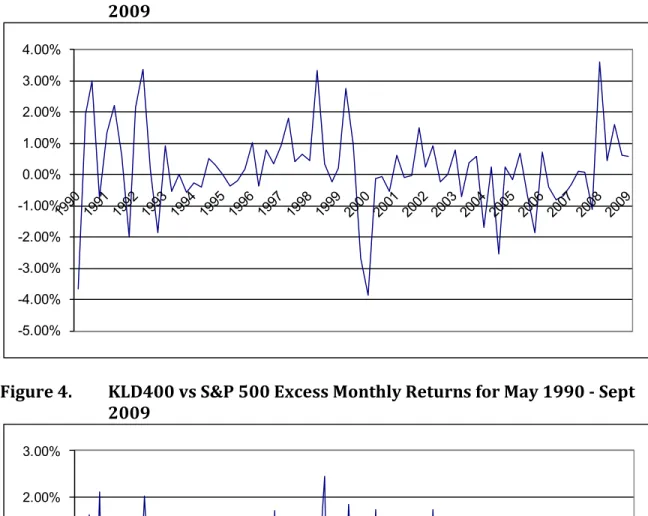
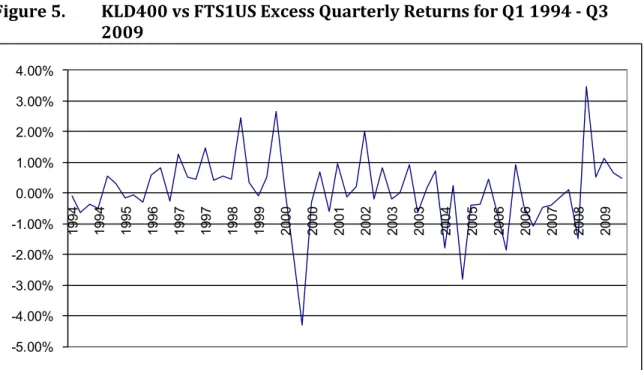
30 analysis and we can see a substantial decrease in the excess returns. Nevertheless, it is important to note that the majority of the alphas were statistically insignificant. To further expand our analysis, we have graphed alpha trends, shown in Figures 3, 4, 5, and 6, to illustrate the quarterly and monthly excess returns of the KLD400 relative to the benchmarks the S&P 500 and FTSE All World USA Index. The figures do not show any signs of continuous positive excess returns. Moreover, the periods of positive excess returns seem to be followed by a similar period of negative excess returns. There is no evidence of any strong trends of movement in one direction. The past ten years did show signs of decreasing excess returns; however, there seems to be an inconsistency during the recent recession of September 2008. All markets have decreased significantly since the fourth quarter of 2008 and could have skewed the analysis for that period. It is very possible that we have not reached the end of the socially responsible investing hype, and hence the results in the analysis cannot yet provide any conclusive evidence.
But is the analysis just a coincidence of the data we used, or was it just too good to be true? Even if a new style of investing were able to generate excess returns, everyone in the market would begin investing the same way and taking any excess returns. Essentially, it is the same concept of how arbitrage opportunities do not persist. Only at the right time, will certain investments be superior to the rest of the market. And not to forget, transaction costs will definitely play a part in further reducing any excess returns.
31 Figure 3. KLD400 vs S&P 500 Excess Quarterly Returns for Q3 1990 - Q3
2009
Figure 4. KLD400 vs S&P 500 Excess Monthly Returns for May 1990 - Sept 2009 -5.00% -4.00% -3.00% -2.00% -1.00% 0.00% 1.00% 2.00% 3.00% 4.00% -3.00% -2.00% -1.00% 0.00% 1.00% 2.00% 3.00% 1990 1991 1992 1992 1993 1994 1995 1996 1997 1997 1998 1999 2000 2001 2002 2002 2003 2004 2005 2006 2007 2007 2008 2009
32 Figure 5. KLD400 vs FTS1US Excess Quarterly Returns for Q1 1994 - Q3
2009
Figure 6. KLD vs FTS1US Excess Monthly Returns for Jan 1994 - Sept 2009 -5.00% -4.00% -3.00% -2.00% -1.00% 0.00% 1.00% 2.00% 3.00% 4.00% 1994 1994 1995 1996 1997 1997 1998 1999 2000 2000 2001 2002 2003 2003 2004 2005 2006 2006 2007 2008 2009 -3.00% -2.00% -1.00% 0.00% 1.00% 2.00% 3.00% 1994 1994 1995 1996 1997 1997 1998 1999 2000 2000 2001 2002 2003 2003 2004 2005 2006 2006 2007 2008 2009
33 What are the Reasons for this Outperformance?
One reason was the ‘hype’ surrounding this new financial product at its release. Social responsibility was the competitive edge, and investors flocked to these products as a way to satisfy their moral concerns. Using the S&P 500 as a proxy, the universe of socially responsible stocks is held within the S&P 500 universe, as depicted by Figure 7.
Figure 7. SRI Stock Universe within the S&P 500 Stock Universe
Because the amount of investable socially responsible stocks is smaller than the S&P 500 as a whole, the surge of additional volume can account for the artificially
inflated prices; thus, the outperformance of the KLD400 before 1998. Socially responsible investors only invest in a set of stocks, and regular S&P 500 investors overlap this subset of stocks. Intuitively, the market has begun to price the premium of SRI stocks, and the alpha has diminished. This is supported by Statman’s research (2002) where the shift of a company’s capital supply will directly affect the
34 company’s profits. When socially responsible investors withdraw their capital from non-SRI stocks, the cost of capital for these companies will increase to entice further investment. Reducing capital for these companies will delay growth and most likely reduce profits. Nevertheless, as time passes, investors loyal to non-SRI stocks will provide the equivalent capital and eventually eliminate excess returns from SRI stocks.
Another argument on the enduring debate of SRI is that companies with good corporate governance have overall higher returns. A joint study conducted by the Institutional Shareholder Services (ISS) and Georgia State University analyzed the returns of companies using the ISS Corporate Governance Quotient (CGQ).
According to ISS’ website, the CGQ is a tool for monitoring and comparing corporate governance structures. The rating is comprised of eight core factors: 1. Board
structure and composition, 2. Audit issues, 3. Charter and bylaw provisions, 4. Laws of the state of incorporation, 5. Executive and director compensation, 6. Qualitative factors, 7. D&O stock ownership, and 8. Director education. They found that best-governed companies had returns on investment and equity that were 18.7 percent and 23.8 percent higher than companies with poor corporate governance structures (Brown and Calylor 2004). We believe during the initial period of socially
responsible investing, corporate governance of companies was not immediately priced in to the stock. Thus, leading to the positive alpha generated by the KLD400 from the underlying companies with superior corporate governance. However, in recent periods, most, if not all companies are aware of good corporate governance
35 and investors are pricing this into stocks. Therefore, the competitive edge that these companies had is now being priced into the market and excess returns are being eliminated.
Lastly, the alpha generated by the KLD400 may be the result of a premium investors are willing to pay for investing in SRI companies. In a survey conducted by McKinsey & Co. in 2000, over 80 percent of investors said they pay a premium for companies that practice good corporate governance compared to companies with poor
corporate governance. In the United States and the United Kingdom, investors were willing to pay up to an 18 percent premium, while in Southeast Asia and Latin America the premium raises to 23 and 28 percent (McKinsey 2000). Because investors are willing to pay a premium for SRI companies, one would expect companies with good corporate governance to be awarded with higher valuations; hence, the apparent alpha generated in the initiation of the KLD400. As mentioned previously, good corporate governance is now being priced into the market
resulting in diminished returns. Conclusion
“The choice of a common stock is a single act, its ownership is a continuing process. Certainly there is just as much reason to exercise care and judgment in being a shareholder as in becoming one.”
-Benjamin Graham and David Dodd
An investor’s willingness to assume social responsibility is apparent with the tremendous rise and use of SRI products. However, can financial institutions really
36 market these products on the basis of higher returns? In our findings, there is no concrete evidence that suggests that SRI itself results in higher returns.
The KLD400 did generate alpha prior to 1998; however, the majority of the results were statistically insignificant. Subsequent periods showed no excess returns using both Jensen’s alpha and the Fama-French three factor model. Switching the analysis from the S&P 500 to the FTSE All World USA Index did not show different results. Alphas were higher in the period of 1990 – 1998, and this provided a boost to the overall excess returns for the full sample period of 1990 – 2009. Excess standard deviation adjusted returns is a useful tool in comparing the KLD 400 index to the benchmarks. Direct comparisons would be comparing apples to oranges, but the eSDAR is a more leveled comparison. Using different methodologies, returns comparison tools, time periods, and benchmarks, our findings support our theory that excess returns of socially responsible investing was high in the initiation periods and have since diminished with time.
Dr. Statman quoted a Yankelovich survey in his original paper, saying that 80 percent of investors would not consider investing in socially responsible mutual funds unless their returns were at least equal to those of conventional mutual funds (Krumsiek 1997). The evidence and the robustness of our theory supports that the returns of SRI are no different from the market. Institutions can definitely use SRI as a marketing tool, however, cannot use higher gains as incentive as well.
37 Bibliography
Bauer, Rob. Derwall, Jeroen. and Otten, Rogér (2007). "The Ethical Mutual Fund Performance Debate: New Evidence from Canada." Journal of Business Ethics, 70:2, 111-124. Online publication date: 4-Feb-2007.
Bello, Zakri Y. (2005). "Socially Responsible Investing and Portfolio Diversification." Journal of Financial Research, 28:1, 41-57. Online publication date: 1-Apr-2005. Bhagat , Sanjai, and Bolton, Brian J. (2007). “Corporate Governance and Firm Performance.” working paper (June 2007).
Brown, Lawrence D. and Caylor, Marcus (2004). “Corporate Governance Study: The Correlation between Corporate Governance and Company Performance.”
(Institutional Shareholder Services, 2004).
Galema , Rients. Plantinga, Auke. and Scholtens, Bert (2009). “The Stocks at Stake: Return and Risk in Socially Responsible Investment.” Journal of Banking & Finance. Online publication date: 12-Jul-2009.
Geczy, Christopher C. Stambaugh, Robert F. and Levin, David (2005). “Investing in Socially Responsible Mutual Funds.” Unpublished manuscript, under review by Journal of Financial Economics.
Governance Analytics. Quotient Rating. Retrieved in 2009 from http://www.isscgq.com/abouttheratings.htm
Social Investment Forum (2007). “2007 Report on Socially Responsible Investing Trends in the United States.” Executive summary.
http://www.socialinvest.org/pdf/SRI_Trends_ExecSummary_2007.pdf Statman, Meir (2000). “Socially Responsible Mutual Funds.” Association for Investment Management and Research. Financial Analysts Journal, May/June
38 Appendix
Table 7. Summary
*The annualized arithmetic returns are less than the geometric means because rather than compounded, the monthly returns are multiplied by 12. The annualized standard deviation return was calculated as the monthly standard deviation multiplied by the square root of 12.
KLD SP Tbill KLD vs S&P 500
Alpha Beta eSDAR
90-98 18.54% 16.96% 4.49% 90-98 0.93% 1.0524 0.66% 98-09 3.67% 3.41% 2.88% (0.986) (52.996) 90-09 10.12% 9.29% 3.58% 98-09 0.25% 1.0201 0.23% (0.274) (63.593) 90-98 19.02% 17.32% 4.58% 90-09 0.65% 1.0321 0.53% 98-09 2.29% 2.11% 2.92% (1.002) (83.609) 90-09 9.23% 8.45% 3.64% 90-98 14.19% 13.25% 0.34% 98-09 16.75% 16.17% 0.51% 90-09 15.80% 15.07% 0.50% 90-98 Alpha Beta(Mkt – Rf) Beta(SMB) Beta(HML)
0.17% 1.0431 -0.2083 -0.0906 (2.073) (45.254) (-7.036) (-2.478) 98-09 Alpha Beta(Mkt – Rf) Beta(SMB) Beta(HML)
-0.02% 0.9728 -0.1550 -0.1819 (-0.150) (44.292) (-5.412) (-0.625) 90-09 Alpha Beta(Mkt – Rf) Beta(SMB) Beta(HML)
0.09% 1.0005 -0.1784 -0.0411 (1.246) (61.754) (-8.463) (-1.822)
KLD FTS1US Tbill KLD vs FTSE All World USA Index Alpha Beta eSDAR
Jan 94 - Sep 98 20.83% 19.77% 4.67% Jan 94 - Sep 98 0.06% 1.0217 0.41% Oct 98 - Sep 09 3.67% 3.66% 2.88% (0.701) (48.527)
Jan 94 - Sep 09 8.84% 8.52% 3.42% Oct 98 - Sep 09 0.25% 1.0201 0.23% (0.001) (64.700)
Jan 94 - Sep 98 21.74% 20.56% 4.77% Jan 94 - Sep 09 0.65% 1.0321 0.53% Oct 98 - Sep 09 2.29% 2.35% 2.92% (0.336) (80.544)
Jan 94 - Sep 09 7.80% 7.53% 3.47% Jan 94 - Sep 98 14.08% 13.62% 0.18% Oct 98 - Sep 09 16.75% 16.22% 0.51% Jan 94 - Sep 09 16.11% 15.60% 0.50%
Performance of the KLD400 Relative to the S&P Using Jensen's Alpha
Performance of the KLD400 Relative to the S&P 500 using the Fama-French Three-Factor Model
Performance of the KLD400 Relative to the FTSE All World USA Index using Jensen's Alpha Annual Arith Returns*
Annual Geo Returns
Standard Deviation
Annual Arith Returns*
Annual Geo Returns
39 Table 8. Outperformance Chart
KLD400 vs S&P 500 Excess Quarterly Returns KLD400 vs FTS1US Excess Quarterly Returns Q3 1990 - Q3 2009 Q1 1994 - Q3 2009 9/30/1990 -3.67% 3/31/1994 -0.08% 12/31/1990 1.95% 3/31/2003 -0.22% 6/30/1994 -0.65% 9/30/2006 0.92% 3/31/1991 2.98% 6/30/2003 -0.01% 9/30/1994 -0.38% 12/31/2006 -0.43% 6/30/1991 -0.72% 9/30/2003 0.78% 12/31/1994 -0.51% 3/31/2007 -1.09% 9/30/1991 1.33% 12/31/2003 -0.70% 3/31/1995 0.57% 6/30/2007 -0.46% 12/31/1991 2.20% 3/31/2004 0.38% 6/30/1995 0.30% 9/30/2007 -0.41% 3/31/1992 0.64% 6/30/2004 0.57% 9/30/1995 -0.17% 12/31/2007 -0.14% 6/30/1992 -2.00% 9/30/2004 -1.67% 12/31/1995 -0.05% 3/31/2008 0.10% 9/30/1992 2.14% 12/31/2004 0.24% 3/31/1996 -0.31% 6/30/2008 -1.47% 12/31/1992 3.36% 3/31/2005 -2.54% 6/30/1996 0.60% 9/30/2008 3.47% 3/31/1993 0.15% 6/30/2005 0.25% 9/30/1996 0.81% 12/31/2008 0.51% 6/30/1993 -1.86% 9/30/2005 -0.17% 12/31/1996 -0.28% 3/31/2009 1.14% 9/30/1993 0.91% 12/31/2005 0.70% 3/31/1997 1.26% 6/30/2009 0.64% 12/31/1993 -0.54% 3/31/2006 -0.66% 6/30/1997 0.53% 9/30/2009 0.48% 3/31/1994 0.00% 6/30/2006 -1.86% 9/30/1997 0.46% 6/30/1994 -0.56% 9/30/2006 0.71% 12/31/1997 1.48% 9/30/1994 -0.28% 12/31/2006 -0.38% 3/31/1998 0.41% 12/31/1994 -0.40% 3/31/2007 -0.79% 6/30/1998 0.55% 3/31/1995 0.52% 6/30/2007 -0.66% 9/30/1998 0.46% 6/30/1995 0.32% 9/30/2007 -0.34% 12/31/1998 2.46% 9/30/1995 0.00% 12/31/2007 0.12% 3/31/1999 0.34% 12/31/1995 -0.37% 3/31/2008 0.07% 6/30/1999 -0.11% 3/31/1996 -0.21% 6/30/2008 -1.13% 9/30/1999 0.53% 6/30/1996 0.18% 9/30/2008 3.59% 12/31/1999 2.65% 9/30/1996 1.04% 12/31/2008 0.45% 3/31/2000 0.24% 12/31/1996 -0.36% 3/31/2009 1.61% 6/30/2000 -2.13% 3/31/1997 0.80% 6/30/2009 0.64% 9/30/2000 -4.32% 6/30/1997 0.35% 9/30/2009 0.58% 12/31/2000 -0.29% 9/30/1997 0.92% 3/31/2001 0.68% 12/31/1997 1.82% 6/30/2001 -0.59% 3/31/1998 0.40% 9/30/2001 0.95% 6/30/1998 0.67% 12/31/2001 -0.11% 9/30/1998 0.45% 3/31/2002 0.21% 12/31/1998 3.35% 6/30/2002 2.03% 3/31/1999 0.36% 9/30/2002 -0.19% 6/30/1999 -0.24% 12/31/2002 0.81% 9/30/1999 0.22% 3/31/2003 -0.18% 12/31/1999 2.74% 6/30/2003 -0.01% 3/31/2000 0.95% 9/30/2003 0.92% 6/30/2000 -2.67% 12/31/2003 -0.63% 9/30/2000 -3.86% 3/31/2004 0.19% 12/31/2000 -0.14% 6/30/2004 0.71% 3/31/2001 -0.07% 9/30/2004 -1.79% 6/30/2001 -0.52% 12/31/2004 0.24% 9/30/2001 0.62% 3/31/2005 -2.83% 12/31/2001 -0.11% 6/30/2005 -0.39% 3/31/2002 -0.03% 9/30/2005 -0.35% 6/30/2002 1.49% 12/31/2005 0.46% 9/30/2002 0.25% 3/31/2006 -0.75% 12/31/2002 0.91% 6/30/2006 -1.86%
40 Table 9. Outperformance Chart
KLD400 vs S&P 500 Excess Monthly Returns May 1990 - Sept 2009 5/31/1990 1.22% 6/30/1990 -0.08% 1/31/1994 -0.78% 8/31/1997 -0.07% 3/31/2001 -0.08% 10/31/2004 0.02% 5/31/2008 0.34% 7/31/1990 -2.33% 2/28/1994 0.89% 9/30/1997 0.06% 4/30/2001 -1.15% 11/30/2004 0.00% 6/30/2008 -0.56% 8/31/1990 -0.75% 3/31/1994 -0.12% 10/31/1997 0.21% 5/31/2001 -0.19% 12/31/2004 0.22% 7/31/2008 1.08% 9/30/1990 -0.59% 4/30/1994 -0.21% 11/30/1997 1.50% 6/30/2001 0.82% 1/31/2005 -0.55% 8/31/2008 1.53% 10/31/1990 -0.42% 5/31/1994 -0.56% 12/31/1997 0.11% 7/31/2001 0.97% 2/28/2005 -1.64% 9/30/2008 0.98% 11/30/1990 1.62% 6/30/1994 0.21% 1/31/1998 1.00% 8/31/2001 -0.03% 3/31/2005 -0.34% 10/31/2008 1.33% 12/31/1990 0.75% 7/31/1994 -0.56% 2/28/1998 0.26% 9/30/2001 -0.32% 4/30/2005 0.03% 11/30/2008 -0.60% 1/31/1991 0.97% 8/31/1994 0.27% 3/31/1998 -0.87% 10/31/2001 -0.64% 5/31/2005 1.07% 12/31/2008 -0.28% 2/28/1991 -0.09% 9/30/1994 0.02% 4/30/1998 -0.32% 11/30/2001 1.14% 6/30/2005 -0.85% 1/31/2009 -0.04% 3/31/1991 2.10% 10/31/1994 -0.42% 5/31/1998 -0.11% 12/31/2001 -0.61% 7/31/2005 1.12% 2/28/2009 0.82% 4/30/1991 -0.26% 11/30/1994 0.94% 6/30/1998 1.10% 1/31/2002 1.10% 8/31/2005 -0.39% 3/31/2009 0.83% 5/31/1991 -0.18% 12/31/1994 -0.93% 7/31/1998 0.60% 2/28/2002 -1.42% 9/30/2005 -0.90% 4/30/2009 1.00% 6/30/1991 -0.28% 1/31/1995 0.78% 8/31/1998 -0.35% 3/31/2002 0.28% 10/31/2005 1.23% 5/31/2009 -0.96% 7/31/1991 0.86% 2/28/1995 0.22% 9/30/1998 0.20% 4/30/2002 1.45% 11/30/2005 0.23% 6/30/2009 0.60% 8/31/1991 0.77% 3/31/1995 -0.48% 10/31/1998 0.74% 5/31/2002 0.63% 12/31/2005 -0.75% 7/31/2009 0.82% 9/30/1991 -0.30% 4/30/1995 -0.45% 11/30/1998 0.87% 6/30/2002 -0.59% 1/31/2006 -0.46% 8/31/2009 0.02% 10/31/1991 -0.31% 5/31/1995 -0.11% 12/31/1998 1.74% 7/31/2002 0.29% 2/28/2006 0.55% 9/30/2009 -0.26% 11/30/1991 1.08% 6/30/1995 0.87% 1/31/1999 2.44% 8/31/2002 -0.55% 3/31/2006 -0.75% 12/31/1991 1.43% 7/31/1995 0.09% 2/28/1999 -1.42% 9/30/2002 0.51% 4/30/2006 -0.96% 1/31/1992 0.92% 8/31/1995 0.10% 3/31/1999 -0.65% 10/31/2002 1.72% 5/31/2006 -0.55% 2/29/1992 0.33% 9/30/1995 -0.19% 4/30/1999 -1.34% 11/30/2002 -0.31% 6/30/2006 -0.35% 3/31/1992 -0.61% 10/31/1995 0.56% 5/31/1999 0.23% 12/31/2002 -0.49% 7/31/2006 -0.50% 4/30/1992 -2.14% 11/30/1995 0.17% 6/30/1999 0.87% 1/31/2003 -0.12% 8/31/2006 0.76% 5/31/1992 0.61% 12/31/1995 -1.10% 7/31/1999 0.30% 2/28/2003 -0.06% 9/30/2006 0.44% 6/30/1992 -0.47% 1/31/1996 -0.26% 8/31/1999 0.35% 3/31/2003 -0.04% 10/31/2006 0.41% 7/31/1992 0.57% 2/29/1996 0.82% 9/30/1999 -0.43% 4/30/2003 0.11% 11/30/2006 -0.74% 8/31/1992 0.58% 3/31/1996 -0.77% 10/31/1999 0.53% 5/31/2003 0.08% 12/31/2006 -0.05% 9/30/1992 0.98% 4/30/1996 0.32% 11/30/1999 1.84% 6/30/2003 -0.19% 1/31/2007 0.53% 10/31/1992 2.01% 5/31/1996 -0.01% 12/31/1999 0.37% 7/31/2003 1.07% 2/28/2007 -0.25% 11/30/1992 0.77% 6/30/1996 -0.13% 1/31/2000 -0.37% 8/31/2003 -0.37% 3/31/2007 -1.07% 12/31/1992 0.58% 7/31/1996 -0.07% 2/29/2000 0.60% 9/30/2003 0.08% 4/30/2007 0.13% 1/31/1993 0.55% 8/31/1996 0.86% 3/31/2000 0.72% 10/31/2003 0.69% 5/31/2007 -0.29% 2/28/1993 -0.57% 9/30/1996 0.25% 4/30/2000 -1.68% 11/30/2003 -0.48% 6/30/2007 -0.50% 3/31/1993 0.17% 10/31/1996 -0.49% 5/31/2000 -2.08% 12/31/2003 -0.90% 7/31/2007 0.21% 4/30/1993 -2.14% 11/30/1996 0.26% 6/30/2000 1.09% 1/31/2004 0.25% 8/31/2007 0.28% 5/31/1993 0.38% 12/31/1996 -0.14% 7/31/2000 -0.23% 2/29/2004 -0.35% 9/30/2007 -0.83% 6/30/1993 -0.11% 1/31/1997 1.23% 8/31/2000 -2.66% 3/31/2004 0.47% 10/31/2007 0.77% 7/31/1993 0.42% 2/28/1997 -0.10% 9/30/2000 -0.97% 4/30/2004 -0.01% 11/30/2007 -0.02% 8/31/1993 0.18% 3/31/1997 -0.33% 10/31/2000 1.72% 5/31/2004 0.65% 12/31/2007 -0.63% 9/30/1993 0.32% 4/30/1997 1.69% 11/30/2000 0.08% 6/30/2004 -0.07% 1/31/2008 0.11% 10/31/1993 -0.17% 5/31/1997 -0.65% 12/31/2000 -1.94% 7/31/2004 -0.67% 2/29/2008 -0.92% 11/30/1993 -0.13% 6/30/1997 -0.69% 1/31/2001 0.92% 8/31/2004 -0.20% 3/31/2008 0.88% 12/31/1993 -0.23% 7/31/1997 0.94% 2/28/2001 -0.90% 9/30/2004 -0.80% 4/30/2008 -0.91%
41 Table 10. Outperformance Chart
KLD vs FTS1US Excess Monthly Returns Jan 1994 - Sept 2009 1/31/1994 -0.73% 2/28/1994 0.93% 9/30/1997 0.13% 4/30/2001 -1.37% 11/30/2004 -0.02% 6/30/2008 -0.64% 3/31/1994 -0.28% 10/31/1997 0.06% 5/31/2001 -0.06% 12/31/2004 0.21% 7/31/2008 1.05% 4/30/1994 -0.34% 11/30/1997 1.60% 6/30/2001 0.83% 1/31/2005 -0.65% 8/31/2008 1.47% 5/31/1994 -0.42% 12/31/1997 -0.18% 7/31/2001 1.26% 2/28/2005 -1.69% 9/30/2008 0.95% 6/30/1994 0.11% 1/31/1998 1.11% 8/31/2001 0.05% 3/31/2005 -0.49% 10/31/2008 1.49% 7/31/1994 -0.82% 2/28/1998 0.22% 9/30/2001 -0.36% 4/30/2005 0.00% 11/30/2008 -0.46% 8/31/1994 0.46% 3/31/1998 -0.91% 10/31/2001 -0.67% 5/31/2005 0.77% 12/31/2008 -0.52% 9/30/1994 -0.02% 4/30/1998 -0.57% 11/30/2001 1.07% 6/30/2005 -1.16% 1/31/2009 -0.18% 10/31/1994 -0.44% 5/31/1998 0.24% 12/31/2001 -0.52% 7/31/2005 1.04% 2/28/2009 0.45% 11/30/1994 0.76% 6/30/1998 0.88% 1/31/2002 1.19% 8/31/2005 -0.44% 3/31/2009 0.87% 12/31/1994 -0.83% 7/31/1998 0.58% 2/28/2002 -1.27% 9/30/2005 -0.96% 4/30/2009 0.88% 1/31/1995 0.43% 8/31/1998 -0.19% 3/31/2002 0.29% 10/31/2005 1.13% 5/31/2009 -0.82% 2/28/1995 0.33% 9/30/1998 0.07% 4/30/2002 1.66% 11/30/2005 0.12% 6/30/2009 0.59% 3/31/1995 -0.19% 10/31/1998 0.73% 5/31/2002 0.58% 12/31/2005 -0.79% 7/31/2009 0.79% 4/30/1995 -0.63% 11/30/1998 0.66% 6/30/2002 -0.21% 1/31/2006 -0.61% 8/31/2009 0.00% 5/31/1995 -0.05% 12/31/1998 1.07% 7/31/2002 -0.34% 2/28/2006 0.77% 9/30/2009 -0.31% 6/30/1995 0.98% 1/31/1999 2.38% 8/31/2002 -0.51% 3/31/2006 -0.91% 7/31/1995 0.16% 2/28/1999 -1.41% 9/30/2002 0.66% 4/30/2006 -0.87% 8/31/1995 0.07% 3/31/1999 -0.64% 10/31/2002 1.66% 5/31/2006 -0.59% 9/30/1995 -0.40% 4/30/1999 -1.47% 11/30/2002 -0.42% 6/30/2006 -0.40% 10/31/1995 0.38% 5/31/1999 0.29% 12/31/2002 -0.43% 7/31/2006 -0.32% 11/30/1995 0.29% 6/30/1999 1.07% 1/31/2003 -0.15% 8/31/2006 0.78% 12/31/1995 -0.72% 7/31/1999 0.33% 2/28/2003 0.04% 9/30/2006 0.46% 1/31/1996 -0.23% 8/31/1999 0.53% 3/31/2003 -0.08% 10/31/2006 0.35% 2/29/1996 0.53% 9/30/1999 -0.32% 4/30/2003 0.15% 11/30/2006 -0.83% 3/31/1996 -0.61% 10/31/1999 0.28% 5/31/2003 0.06% 12/31/2006 0.05% 4/30/1996 0.30% 11/30/1999 1.88% 6/30/2003 -0.22% 1/31/2007 0.30% 5/31/1996 0.28% 12/31/1999 0.49% 7/31/2003 1.11% 2/28/2007 -0.33% 6/30/1996 0.02% 1/31/2000 -0.80% 8/31/2003 -0.28% 3/31/2007 -1.06% 7/31/1996 -0.15% 2/29/2000 0.18% 9/30/2003 0.10% 4/30/2007 0.34% 8/31/1996 0.64% 3/31/2000 0.86% 10/31/2003 0.71% 5/31/2007 -0.28% 9/30/1996 0.33% 4/30/2000 -1.41% 11/30/2003 -0.66% 6/30/2007 -0.51% 10/31/1996 -0.21% 5/31/2000 -1.72% 12/31/2003 -0.68% 7/31/2007 0.18% 11/30/1996 0.28% 6/30/2000 1.00% 1/31/2004 0.13% 8/31/2007 0.23% 12/31/1996 -0.35% 7/31/2000 -0.30% 2/29/2004 -0.38% 9/30/2007 -0.82% 1/31/1997 1.23% 8/31/2000 -2.67% 3/31/2004 0.43% 10/31/2007 0.65% 2/28/1997 0.20% 9/30/2000 -1.35% 4/30/2004 0.02% 11/30/2007 -0.14% 3/31/1997 -0.17% 10/31/2000 1.48% 5/31/2004 0.66% 12/31/2007 -0.65% 4/30/1997 1.96% 11/30/2000 -0.08% 6/30/2004 0.03% 1/31/2008 0.04% 5/31/1997 -0.76% 12/31/2000 -1.69% 7/31/2004 -0.64% 2/29/2008 -0.96% 6/30/1997 -0.68% 1/31/2001 0.92% 8/31/2004 -0.29% 3/31/2008 1.02% 7/31/1997 0.74% 2/28/2001 -0.51% 9/30/2004 -0.85% 4/30/2008 -0.92% 8/31/1997 -0.41% 3/31/2001 0.27% 10/31/2004 0.05% 5/31/2008 0.09%