DIFFERENTIAL IMPACT OF PRIMARY EDUCATION DEVELOPMENT PROGRAMMES ON IMPROVING ACCESS, RETENTION AND
PERFORMANCE OF PUPILS FROM ECONOMICALLY DIFFERENT COMMUNITIES IN MOROGORO, TANZANIA
ANDREW CALEB RANDA
A THESIS SUBMITTED IN FULFILLMENT OF THE REQUIREMENTS FOR THE DEGREE OF DOCTOR OF PHILOSOPHY OF
THE OPEN UNIVERSITY OF TANZANIA 2018
CERTIFICATION
This is to certify that we have read and hereby recommends for acceptance by the Open University of Tanzania a thesis titled: “Differential Impact of Primary Education
Development Programmes on Improving Access, Retention and Performance of Pupils from Economically Different Communities in Morogoro, Tanzania” in fulfillment of the requirements for Degree of Doctor of Philosophy of the Open University of Tanzania.
……….……… Professor Issa Mcholo Omari
Principal Supervisor
……….……… Date
……….……… Professor Cornelia Koku Muganda
Second Supervisor
……….……… Date
COPYRIGHT
No part of this thesis may be reproduced, stored in any retrieval system, or transmitted in any form by any means, electronic, mechanical, photocopy, recording or otherwise without prior written permission of the author or the Open University of Tanzania in that behalf.
DECLARATION
I, Andrew Caleb Randa, hereby declare that this thesis is my own original work and that it has not been submitted and will not be submitted for a similar degree or any other award in any other University or higher learning institution.
………….……… Signature
………….……… Date
DEDICATION
I dedicate this thesis to the everlasting God, the LORD, the Almighty, and the Creator of the earth. The LORD is my strength and my salvation.
ACKNOWLEDGEMENTS
I extend my sincere thanks to all people who made this study a success. My gratitude is due to those who, in one way or another, supported me through design, research undertaking and editing of this thesis. I am profoundly grateful to my two supervisors, Professor I. M. Omari and Professor C. K. Muganda for their dedication and encouragement. In addition, I extend my sincere thanks to them for their insightful comments and directions throughout the writing process.
My sincere thanks are extended to head teachers, education officers and administrative officials who willingly and wholeheartedly participated as well as greatly contributed to the study.
I extend my sincere thanks to my employer, the Institute of Social Work for giving me permission and financial support for my studies. I am particularly indebted to former Leaders of the Institute, Dr. A. Mvungi, the Rector; Dr. Z. Mabeyo, Deputy Rector for Planning, Finance and Administration and Dr. N. Ng‟ondi, Deputy Rector for Academic, Research and Consultancy, whose assistance and encouragement were valuable throughout of my studies.
Lastly, I am grateful to my mother Esther Harun Nyagori, my wife Jaelly Sospeter Onyango, and my children, Caleb, Filigona, and Esther, „Thank you for your love, patience and support.‟
ABSTRACT
The purpose of this research was to determine the differential impact of Primary Education Development Programmes (PEDPs) on improving access, retention and performance of pupils from economically different communities in Morogoro, Tanzania. The researcher used survey research design. Purposive sampling procedure was used to select 12 primary schools from rural and urban settings. The objectives of study were to examine the differential enrolment rates, retention rates, dropout rates, and the academic performance of pupils. Data analysis was done with assistance of Statistical Package for Social Sciences (SPSS) for windows 22 Version. The t-test at 0.05 significance level was used to establish the relationship between pupils‟ academic performances across time and place. Findings were presented by using frequency tables, graphs, and percentages. The study revealed that these programmes led to differential impacts on pupils‟ enrolment such that between years 2002 and 2006, it increased by 18.4 percent for boys and 16.8 percent for girls, dropout rate throughout the programmes was low as 1.17 percent for Morogoro Rural and Urban Districts, retention rates of girls were higher in Morogoro Urban District (95.7) than Morogoro Rural District (80.4), and the same trend was observed among boys, where retention in Morogoro Urban District was 93.9 and Morogoro Rural District was 78.5. There was no significant difference in boys‟ academic performance between the PEDP 1 and II as p Value = 0.240 > 0.05, while in girls‟ performance, there was significant difference as P Value = 0.002 < 0.05. The study concluded that Primary Education Development Programmes, through capitation grants, had direct and significant impact on pupils‟ enrolment, retention and performance in schools. However, equity and quality issues need to be addressed between rural and urban schools, boys as well as girls.
TABLE OF CONTENTS CERTIFICATION ... ii COPYRIGHT ... iii DECLARATION ... iv DEDICATION ... v ACKNOWLEDGEMENTS... vi ABSTRACT ... vii
LIST OF TABLES ... xiii
LIST OF FIGURES ... xv
LIST OF ANNEXES ... xvii
LIST OF ABBREVIATIONS ... xviii
CHAPTER ONE ... 1
1.0 THE PROBLEM AND ITS CONTEXT ... 1
1.1 Introduction to the Chapter ... 1
1.2 Background to the Study ... 1
1.2.1 International Conventions and Declarations on Education ... 2
1.2.2 Problems of Education in the Twenty First Century World-Wide ………4
1.2.3 Economic Situation Before and During Implementation of Primary Education Development Programmes I and II ... 6
1.2.4 Enrolment Trends in Primary Schools Before Implementation Primary Education Development Programme in 2001 ... 7
1.2.5 Government of Tanzania Initiatives on Improving Primary Education Delivery ... 8
1.2.6 Objectives of Primary Education Development Programme I:
2002 – 2006 ... 9
1.2.7 Objectives of Primary Education Development Programme II: 2007 – 2011 ... 11
1.2.8 Budgets for Primary Education Development Programmes I and II ... 13
1.3 Statement of the Problem ... 19
1.4 Objectives of the Study ... 21
1.4.1 The Main Objective of the Study ... 21
1.4.2 Specific Objectives ... 21
1.4.3 Research Tasks ... 22
1.4.4 Research Questions ... 23
1.4.5 Research Hypotheses... 24
1.5 Significance of the Study ... 24
1.6 Scope of the Study... 25
1.7 Limitation of the Study ... 26
1.8 Delimitation of the Study ... 26
1.9 Definition of Key Terms and Concepts... 27
1.10 Conceptual Framework ... 27
1.11 Structure of the Thesis... 33
CHAPTER TWO ... 34
2.0 LITERATURE REVIEW ... 34
2.1 Introduction to the Chapter ... 34
2.2 Educational Reforms in Tanzania Since Independence ... 34
2.4 Primary Education Development Programmes and Enrolment Trends ... 43
2.5 Primary Education Development Programmes and Dropout Trends ... 44
2.6 Primary Education Development Programmes and Pupils‟ Academic Performance ... 48
2.7 Differential Impacts of Reforms in Education ... 59
2.8 Chapter Summary and the Research Gap ... 64
CHAPTER THREE ... 68
3.0 RESEARCH METHODOLOGY ... 68
3.1 Introduction to the Chapter ... 68
3.2 Study Paradigm ... 68
3.3 Research Approach ... 69
3.4 Research Design ... 74
3.5 Geographical Area of Study ... 75
3.6 Population of Study ... 79
3.7 Sample and Sampling Procedures ... 79
3.8 Data Collection Methods ... 82
3.9 Research Tools ... 84
3.10 Procedures for Data Collection ... 86
3.11 Data Analysis Plan ... 86
3.12 Reliability and Validity of Instruments ... 88
3.12.1 Reliability of Instruments ... 88
3.12.2 Validity of Instruments... 88
3.13 Ethical Issues Addressed ... 88
4.0 DATA ANALYSIS AND PRESENTATION ... 91
4.1 Introduction to the Chapter ... 91
4.2 School Categories and Participants‟ Profile ... 91
4.2.1 School Categories ... 91
4.2.2 Participants‟ Demographic Characteristics ... 92
4.3 Funding of Primary Education Development Programmes ... 94
4.3.1 Funding of Primary Education Development Programmes I and II... 94
4.3.2 Modalities of Transferring Programme Funds ... 95
4.3.3 Funding of Schools in Primary Education Development Programme - I ... 99
4.3.4 Funding of Schools in Primary Education Development Programme II ... 101
4.4 The Main Findings by Objectives of the Study... 103
4.4.1 Enrolment Rates of Girls, Boys and Children with Disabilities ... 103
4.4.2 Retention Rates of Girls, Boys and Children with Disabilities ... 118
4.4.3 Dropout Rates of Girls, Boys and Children with Disabilities ... 127
4.4.4 Academic Performance of Girls, Boys and Children with Disabilities ... 135
4.4.5 Strategies to Improve Enrolment, Retention and Academic Performance of of Pupils ... 152
4.4.6 The Dilemma of Children with Disabilities in Education ... 158
4.5 Synthesis of the Findings ... 159
CHAPTER FIVE... 160
5.0 DISCUSSION OF FINDINGS ... 160
5.1 Introduction to the Chapter ... 160
5.2 Discussion of Findings ... 161
5.2.2 Retention Rates by Gender ... 164
5.2.3 Dropout Rates by Gender ... 168
5.2.4 Academic Performance by Gender ... 170
5.2.5 Strategies to Improve Enrolment, Retention and Academic Performance ……174
5.2.6 Differential Impacts of PEDP on Enrolments, Retention and Performance ... 175
5.3 What Next after Ending the Primary Education Development Programmes? ... 178
5.4 Synthesis of the Findings ... 179
CHAPTER SIX ... 181
6.0 SUMMARY, CONCLUSIONS, AND RECOMMENDATIONS ... 181
6.1 Introduction to the Chapter ... 181
6.2 General Summary ... 181 6.3 Summary of Findings ... 182 6.3.1 Enrolment Rates ... 183 6.3.2 Retention Rates ... 184 6.3.3 Dropout Rates ... 185 6.3.4 Academic Performance ... 186
6.3.5 Strategies to Improve Enrolment, Retention and Academic Performance... 187
6.4 Conclusions ... 187
6.5 Recommendations ... 189
6.5.1 Recommendations for Policy ... 189
6.5.2 Recommendations for Actions ………..189
6.5.3 Recommendation for Further Research... 190
REFERENCES ... 191
LIST OF TABLES
Table 1.1 : Primary Education Enrolment by Year and Sex: 1990-2001 ... 8
Table 1.2 : Primary Education Development Programme I Budget ... 14
Table 1.3 : Primary Education Development Programme I Budget Details ... 14
Table 1.4 : Primary Education Development Programme II Budget ... 15
Table 1.5 : Primary Education Development Programme II Budget Details... 17
Table 3.1 : Socio-Economic Status of Morogoro Rural and Urban Population. ... 78
Table 3.2 : Primary Schools in Morogoro Urban and Rural Districts ... 80
Table 3.3 : Sampling of Schools for the Study ... 82
Table 4.1 : Number of Head Teachers by Gender ... 92
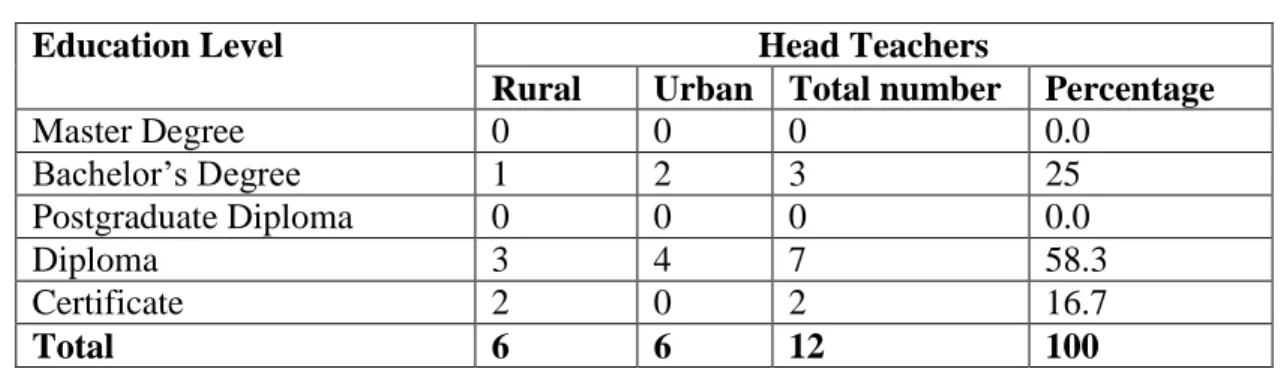
Table 4.2 : Head Teachers‟ Education Level ... 93
Table 4.3 : Number of Years of Head Teachers‟ Work Experience ... 93
Table 4.4 : Capitation Grant Supposed to be Given to Schools ... 98
Table 4.5 : Primary Education Development Programme I:Funds Offered to Schools ... 100
Table 4.6 : Primary Education Development Programme II: Funds Offered to Schools ... 102
Table 4.7 : Enrolment Rates and Gender in Rural and Urban Schools ... 105
Table 4.8 : Criteria for Admission into Primary School under PEDP I ... 109
Table 4.9 : Enrolment of Children with Disabilities by Sex in All Sampled Schools ... 114
Table 4.11 : Retention Pattern of Children with Disabilities During PEDP I
and II ... 124
Table 4.12 : Dropout Rates by Sex and Year ... 127
Table 4.13 : Dropout of Children with Disabilities by Sex and Year ... 134
Table 4.14 : T-Test on Pupils‟ Academic Performance in PEDP I and PEDP II ... 141
Table 4.15 : T-test on Boys‟ Academic Performance in PEDP I and PEDP II ... 147
Table 4.16 : T-test on Girls‟ Academic Performance in PEDP I and PEDP II ... 147
Table 4.17 : T-test on Academic Performance of Girls Before and After PEDPs ... 148
Table 4.18 : T-test on Boys‟ Academic Performance Before PEDP I and II and After PEDP II ... 149
LIST OF FIGURES
Figure 1.1 : Objectives of PEDP I and PEDP II ... 10
Figure 1.2 : Conceptual Framework for the Study ... 29
Figure 1.3 : Components of Stufflebeam‟s (2003) CIPP Model. ... 30
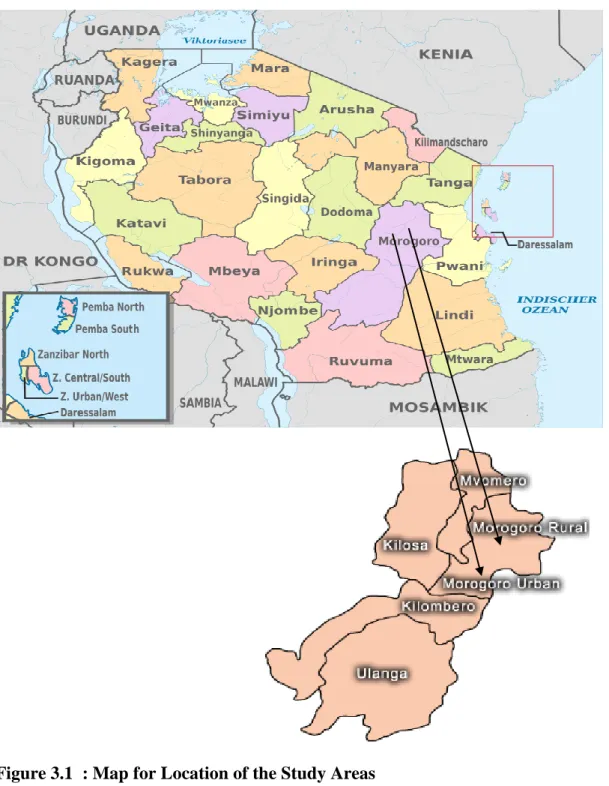
Figure 3.1 : Map for Location of the Study Areas ... 77
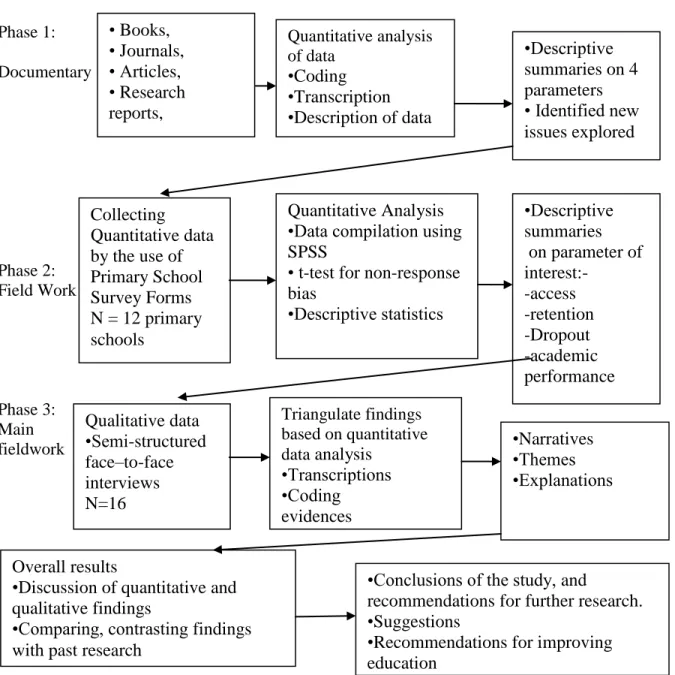
Figure 3.2 : Methods and Expected Outcomes ... 85
Figure 4.1 : Percentage Change in the Enrolment of Pupils by Sex ... 106
Figure 4.2 : Total Enrolment Trend of Pupils During PEDP – I and II ... 107
Figure 4.3 : Enrolment Trends and Gender ... 110
Figure 4.4 : Enrolment Trend of Pupils in Rural and Urban During PEDP I and II ... 112
Figure 4.5 : Retention Trends by Ecology and Sex During PEDP I and II in Numbers ... 120
Figure 4.6 : Retention Trends by Sex During PEDP I and II in Thousands („000) ... 121
Figure 4.7 : Retention Rates of Pupils by Percentage During PEDP I and II ... 122
Figure 4.8 : Percentage Change of Retention of Children with Disabilities During PEDP I and II ... 124
Figure 4.9 : Dropout Trends for Boys and Girls: 2000 – 2013 in Percentages ... 128
Figure 4.10: Dropout Trends for Rural and Urban Girls: 2000 – 2013 in Percentages ... 129
Figure 4.11: Dropout Trends for Rural and Urban Boys: 2000 – 2013 in Percentages ... 129
Figure 4.12 : PSLE Performance Level Trends for Male Pupils in Rural
and Urban Areas, 2000 – 2013 ... 136
Figure 4.13 : PSLE Performance Level Trends for Female Pupils in Rural and Urban Areas, 2000 – 2013 ... 137
Figure 4.14 : Females‟ Performance in PSLE During PEDP I and II ... 142
Figure 4.15 : Males‟ Performance in PSLE During PEDP I and II ... 143
Figure 4.16 : Academic Performance Trends for Female Pupils: 2000 – 2013 ... 144
Figure 4.17 : Academic Performance Trends for Male Pupils: 2000 – 2013 ... 144
Figure 4.18 : PSLE Performance Trends for Rural Pupils: 2000 -2013 ... 145
Figure 4.19 : PSLE Performance Trends for Urban Pupils: 2000 -2013 ... 145
LIST OF ANNEXES
Annex 1 : Official List of MDG Indicators... 212
Annex 2 : Primary School Enrolment Survey Form ... 216
Annex 3 : Primary School Retention Survey Form ... 218
Annex 4 : Primary School Dropout Survey Form... 219
Annex 5 : Primary School Performance Survey Form ... 220
Annex 6 : Primary School Fund Tracking Form... 222
Annex 7 : Strategies to Improve Primary School Education Delivery ... 224
Annex 8 : Research Clearance from Directorate of Research and Postgraduate Studies ... 226
Annex 9 : Letter from Morogoro Regional Administrative Secretary ... 227
Annex 10: Letter from District Administrative Secretary (DAS) - Morogoro (Rural) ... 228
Annex 11: Letter from District Administrative Secretary (DAS) - Morogoro – Municipal ... 229
Annex 12: Letter from District Executive Director (DED): Morogoro (Urban) ... 230
Annex 13: Letter from District Executive Director (DED): Morogoro (Rural) ... 231
Annex 14: Photograph Showing Pupils‟ Performances and Capitation Grants ... 232
LIST OF ABBREVIATIONS AIDS Acquired Immune Deficiency Syndrome BEDC Basic Education Development Committee BEST Basic Education Statistics in Tanzania CIPP Context, Input, Process, Product
COBET Complementary Basic Education in Tanzania CSOs Civil Society Organizations
DAS District Administrative Secretary DED District Executive Director DEO District Education Officer
DR Dropout Rate
EFA Education for All
ESDP Education Sector Development Programme ETP Education and Training Policy
FCS Foundation for Civil Society
FEDP Folk Education Development Programme GER Gross Enrolment Ratio
GDP Gross Domestic Product
HIV Human Immune Deficiency Virus
ICBAE Integrated Community Based Adult Education IDCA International Development Centre for Africa LGAs Local Government Authorities
MDG Millennium Development Goals
MoEC Ministry of Education and Culture
MoVT Ministry of Education and Vocational Training NBS National Bureau of Statistics
NER Net Enrolment Ratio NFE Non-Formal Education OMR Optical Marking Reader
NGOs Non-Governmental Organization
PEDP Primary Education Development Programme PPA Participatory Poverty Assessment
PR Promotion Rate
PSABH Primary School Action for Better Health PSLE Primary School Leaving Examinations PTR Pupils - Teacher Ratio
RAS Regional Administrative Secretary
RR Repetition Rate
SCR Student - Classroom Ratio
SEDP Secondary Education Development Programme SPSS Statistical Package for the Social Sciences TASAF Tanzania Social Action Fund
TBA Tanzania Building Agency TEA Tanzania Education Authority
TIMSS Trends in International Mathematics and Science Studies UPE Universal Primary Education
UNESCO United Nations Educational Scientific and Cultural Organization UNGEI United Nations Girls‟ Education Initiative
UNICEF United Nations Children Fund URT United Republic of Tanzania WEC Ward Education Coordinator WEO Ward Education Officer
CHAPTER ONE
1.0 THE PROBLEM AND ITS CONTEXT
1.1 Introduction to the Chapter
The primary education in Tanzania for long time faced problems of enrolment, retention and poor performance in Primary School Leaving Examinations, which enhanced the Primary Education Development Programmes (PEDP) to be introduced. This study assessed differential impact of PEDP on improving enrolment, retention and performance of pupils from economically different communities in Morogoro Rural District and Morogoro Urban District. The study also suggested strategies to improve primary education delivery in Tanzania. This chapter analyzes the problem and its context, where it is divided into ten sections. The first section presents background information to the study. The second section focuses on the statement of the problem. The objectives of the study are covered in the third section. The fourth section deals with the significance of the study. The subsequent sections cover: scope of the study, limitation of the study, delimitation of the study, definition of key terms and concepts, and conceptual framework.
1.2 Background to the Study
Education is considered as the foundation of all human development and very important means for growth of a nation. It is acknowledged all over the world that education forms the basis for economic, social and political development of any nation (World Bank, 1998). Everyone is obliged to invest in education since by so doing, it promotes
economic development hence, it increases production in terms of socio-economic development and reduce social disparity (World Bank, 1998). Education is treated as one of key indicators of a country‟s development level (UNESCO, 2005). Education is also recognized as a basic human right adopted by the UN in 1948.
The right to education was adopted in Tanganyika (now Mainland Tanzania) in 1961 when the nation became a UN member after obtaining its independence (Omari and Mosha, 1987). Since 1948 when the United Nations recognized education as a basic human right, there has been a number of conventions and declarations on education at international and national levels with the aim of improving access to quality education.
1.2.1 International Conventions and Declarations on Education
The United Nations in the year 1990 declared eight Millennium Development Goals (MDG) and the goals were supposed to be achieved in the year 2015 (Annex 1). The following were Millennium Development Goals (MDGs): to eradicate extreme poverty and hunger, to achieve universal primary education; to promote gender equality and empower women, to reduce child mortality, to improve maternal health, to combat Human Immunodeficiency Virus/Acquired Immunodeficiency Syndrome (HIV/AIDS), malaria and other diseases, to ensure environmental sustainability, and to develop a global partnership for development (UN, 2003). The second MDG was related to education, “Achieve universal primary education.” In target three, it was stated that “ensure that, by 2015, children everywhere, boys and girls alike, were able to complete a full course of primary schooling” (United Nations, 2003, pg. x).
In 1990, about 150 delegates from many countries around the world joined together in Jomtien, Thailand and carried out the World Conference known as Education for All (EFA). The main purposes were to make primary education become right to every child worldwide and reduce illiteracy rates (UNESCO, 2000), with purposes of meeting basic learning needs, shaping the vision, universalizing access and promoting equity in education, focusing on learning attainment, broadening the means and scope of basic education, improving learning the environment, strengthening partnerships among players in education, developing a supporting policy context for education, mobilizing resources and strengthening international solidarity in education (UNESCO, 2000). Thereafter, Tanzania, like other countries, decided to implement decisions made in the Jomtien World Conference on Education for All (UNESCO, 2000a). To achieve EFA goals, the government developed Education and Training Policy of 1995 (ETP, 1995). Its major objectives were to increase and improve enrolments expansion, improve access to education, quality improvements, expansion of education and optimum utilization of facilities (URT, 1995).
Another World Education Forum was held in 2000 in Dakar, Senegal, which emphasized on the need for meeting ‘Education for All Goals’ by the year 2015 (UNESCO, 2005). The Dakar Framework for Action had the following goals: expanding and developing a complete early childhood care and education, ensure that by 2015 all children had access, complete, free and compulsory primary education, ensure learning needs were met, achieve a 50 percent improvement in levels of adult literacy by 2015, eradicate gender inequalities in all primary as well as secondary schools by 2005
and lastly, improve aspects of quality education provision, especially in literacy, numeracy and essential life skills (UNESCO, 2005). The government of Tanzania also adopted the 2000 ‘Dakar Framework for Action’ (UNESCO, 2000b). In 1997, the government of Tanzania initiated Education Sector Development Programme (ESDP) as context for investments in education with the following objectives: to use education in achieving the nation‟s development, to facilitate poverty alleviation through education, to establish relationship and coordination system in provision of education as well as training; and to promote partnership among government, civil society organizations and private sectors (URT, 2001).
1.2.2 Problems of Education in the Twenty First Century World-Wide
In this twenty first century, the education sector has continued to face a lot of problems despite efforts done worldwide in solving them. In year 2014 for example, it was found that a right to education was not offered to millions of children in the world and approximately 72 million children who had to start learning were not enrolled to primary schools (Humanium, 2014). Worldwide, it was reported that 250 million children fail to reach Grade 4 or reach it without learning to read or write, whether they had been to school or not. Furthermore, the number of illiterate adults remained stubbornly high at 774 million (UNESCO, 2014).
Great discrepancies in access and completion rates of pupils exist within and between countries, between rural and urban areas, boys and girls as well as people with disabilities. It was stated that fifty five percent (55%) of children not enrolled in primary
schools were girls and 4 out of 5 who were not enrolled in schools lived in rural areas mainly in Sub-Saharan Africa and in southern as well as western Asia (UNESCO, 2009). It was claimed that child labour, poor health and physical disabilities were some of the major barriers to Universal Primary Education. Furthermore, it was noted that children with physical disabilities were marginalized and not allowed to go to school (UNESCO, 2009).
On other side, the 2010 Millennium Development Goals (MDG) Report noted that children with disabilities continued to be left behind despite overall increases in school participation over the past decade (UN, 2013). In Africa alone, fewer than 10 percent of disabled children were in school. It was also found that disability had greater effect on access to schooling than those obtained from socio-economic status, gender or urban/rural settings (Filmer, 2005). The Education for All Global Monitoring Report (2007) estimated that majority of children with disabilities in Africa did not go to school. Of the 72 million primary aged children, worldwide, that were out of school, one third had disabilities (UNESCO, 2007). In Sub-Saharan Africa, 48 percent of children did not complete primary school. Many of them were children in fragile and conflict-affected countries, children in rural areas, children with disabilities and girls who were the hardest to reach (UNESCO, 2014).
These identified problems made the government of Tanzania to introduce Primary Education Development Programmes (PEDP) in year 2002 – 2011, with the aims of enabling children from economically different communities and children with
disabilities to enroll in primary schools. In following subsections elaborate prevailing economic situation of the country before and during implementations of PEDP, enrolment trends in primary schools before and during their implementations of PEDP, initiatives of government to improving primary education delivery, objectives of PEDP and budgets of PEDP.
1.2.3 Economic Situation Before and During Implementation of Primary Education Development Programmes I and II
In the years 1983 to 1989, before the introduction of PEDP, the country of Tanzania faced different economic crises which affected education delivery. The economic crises during the Structural Adjustment Programme (1983-85) and Economic Recovery Programme (1986-1989) which were experienced in the country (Maliyamkono and Bagachwa, 1990) increased the cost of schooling for many families, thus led to a delay in sending children to school.
The Primary Education Development Programmes were implemented in different periods of times when the country was in economic hardship and mostly affected areas were rural communities (National Bureau of Statistics, 2002). In 2002, the country‟s per capita Gross Domestic Product (GDP) stood at around US$ 300, placing Tanzania as 188th of 208 countries (World Bank, 2006). It was also estimated that about 36 percent of the population lived below the poverty line. Poverty was highly prevalent among rural areas, where 87 percent of the poor lived although they account for 67 percent of the population (World Bank, 2006). According to the Household Budget Surveys of 2000/01
(National Bureau of Statistics, 2002), almost half (48 %) of Tanzania‟s population of 36 million people was unable to meet basic food and nonfood needs. The rural population who made almost 87 percent was poor, and they lived largely on subsistence agriculture, heavily dependent on staple foods such as banana, maize, potato or cassava (National Bureau of Statistics, 2002). For poor families, their incomes were not enough even for day-to-day survival. Such families were usually unable to afford direct costs of schooling and as a result, their children did not enroll in schools (National Bureau of Statistics, 2002). Even if poor families tried to enroll children in schools, the financial burden was much greater because parents were forced to spend large percentage of household incomes in meeting costs for education (Mason and Rozelle, 1998).
1.2.4 Enrolment Trends in Primary Schools Before Implementation Primary Education Development Programme in 2001
Due to economic crises experienced in the country between 1983 to 1989, the number of pupils who enrolled in primary school at the age of seven years declined from 27 per cent of all school entrants in 1981 to 14 per cent in 1990 (UNICEF, 1990). Although in early 1990s, there was expansion in education such that the enrolment number increased from 3.3 million pupils in 1990 to 4.8 million pupils in 2001 for primary education (MoEVT, 2011). However, such enrolments in primary school did not keep pace with growth of population aged between 5 and 14 in Tanzania, hence caused many children to fail to enroll in primary education. For example in 1991, about 50 percent of the population aged 5-14 was enrolled in primary schools, while the remaining 50 percent of the same age did not enroll in schools. But by 2000, enrolment rate had fallen to about
46 percent (Akabayash and Psacharopoulous, 1999). Table 1.1 is used as a baseline data to show national picture of primary education before introduction of the mentioned programmes.
Table 1.1 : Primary Education Enrolment by Year and Sex: 1990-2001
1990 1991 1992 1993 1994 1995 1996 1997 1998 1999 2000 2001 M 1705235 1778336 1833908 1899305 1923062 1961879 1992739 2044098 2033281 2099655 2212475 2474344 F 1673765 1734011 1769580 1837429 1873768 1915764 1950149 2013867 2009287 2090161 2169937 2407244 F/M Propotion 0.98155 0.97508 0.96492 0.96742 0.97437 0.97649 0.97863 0.98521 0.9882 0.99547 0.98077 0.97288 Total 3379000 3512347 3603488 3736734 3796830 3877643 3942888 4057965 4042568 4189816 4382410 4881588 Source: MoEC (2005).
1.2.5 Government of Tanzania Initiatives on Improving Primary Education Delivery
The government of Tanzania in order to improve Primary education delivery introduced Primary Education Development Programme (PEDP) in year 2002. PEDP was mainly intended for increasing enrolment of pupils, as well as attaining equity and quality education (MOEC, 2001). The primary education sector in the country had many challenges and problems which were not solved. Thus, from year 2002, serious initiatives were implemented to solve challenges related to provision of quality education and enrolment of pupils in primary schools in Tanzania. The aim was to make sure that every child was not denied access to education either due to being poor, disabled or because of his or her gender. Other factors which should not refrain them from attending school were like not having school uniforms, school fees or school contributions (for security charges, examinations preparations) or not having school
facilities used in teaching and learning or having scarcity of teachers (MOEC, 2001). Also it aimed at tackling problems of non-attendance, dropout rates and poor performance in examinations (Sekwao, 2004).
Therefore, in the year 2002, the government of Tanzania initiated Primary Education Development Programme (PEDP). The PEDP had to be put into operation in two five-year periods. The first started from 2002 to 2006 and the second continued from 2007 to 2011 (URT, 2012). Generally, the government aimed at increasing enrolment of pupils in primary schools, which was low, improve students‟ retention and improve academic performance (URT 2001, 2006, 2012).
1.2.6 Objectives of Primary Education Development Programme I: 2002 – 2006 Primary Education Development Programme I had the following four strategic objectives (Figure 1.1): enrolment expansion with equity, quality improvement, capacity building in governance and management, and better utilizing human, material as well as financial resource (URT, 2001; BEDC, 2001; Sumra, 2003).
The stated four PEDP objectives were constructed with strategic priorities. The PEDP set the priority of increasing in general gross and net enrolment of girls as well as boys in all primary schools in Tanzania. In order to achieve this, the following strategies were used: increasing enrolment to all groups of children, using teachers and classrooms more effectively, recruiting new teachers and constructing new classrooms, and finally, expanding complementary education programmes for out-of school children and youth
(BEDC, 2001). For successful implementation of the programme, four supporting sub-components were developed around these strategies. Those strategies were enrolment and access, teacher recruitment and deployment, construction, out-of-school children, and youth (URT, 2001).
No. Objectives PEDP I PEDP II
1. Enrolment expansion with equity √ √
2. Quality improvement √ √
3. Capacity building (in governance and management) √ √ 4. Better utilizing human, material and financial
resource
√ √
5. Addressing Cross-cutting issues × √
6. Support educational research × √
7. Carry out educational monitoring and evaluation × √
Key: √ - implemented objective. × - not included. Figure 1.1 : Objectives of PEDP I and PEDP II
Source: URT (2001) and (2006).
The first priority was on enrolment and access that aimed at increasing enrolment of all groups of children (BEDC, 2001). The priority had three objectives, which were to be implemented. They included to enroll all children who were between 7 and 12 years old into standard one by 2005, to ensure that the formal school system catered for the bulk of school age children, and lastly, to ensure that all girls and boys from disadvantaged groups including AIDS orphans are enrolled to formal education (URT, 2001; Mbelle, 2008).
The second priority in PEDP was on quality improvement. The priority aimed at revitalizing and improving the quality of primary education, while focusing on the
following three main components: to improve teachers‟ instruction styles and methods in the classroom, to ensure availability of quality learning and teaching materials, and to ensure that educational standards are maintained through offering important support (BEDC, 2001). The major purpose was to get better academic performance of all pupils regardless of their genders in the primary education examinations results. Academic performance refers to pupils‟ learning outcome levels to be successfully completed (BEDC, 2001). In achieving this, the government had to strengthen in-service and pre-service teacher training together with teaching and learning materials provision (URT, 2001; Mbelle, 2008).
The third primary education policy strategy was to support institutional capability and competency of the central as well as local government authorities and school levels (URT, 2001). It was done through system-wide management improvements whereby a range of capacity building efforts were applied (BEDC, 2001). It involved pre-service teacher training, and offer financial as well as management training to head teachers, school committees, ward education coordinators, inspectors, local government authorities, regional staff and national staff (URT, 2001; Sumra, 2003; Mbelle, 2008).
1.2.7 Objectives of Primary Education Development Programme II: 2007 – 2011 The PEDP II had seven programme areas or objectives (Figure 1.1). The objectives that had to be implemented were enrolment expansion, quality improvement and strengthening capacity in governance as well as management (URT, 2006). Other
remaining four were cross-cutting issues, conducting educational research and carrying out educational monitoring as well as evaluation (URT, 2006).
In regard to enrolment expansion, the major focus was to ensure that all pupils get access and equal chances to enroll in primary schools. The commitment was on ensuring that pre-primary education becomes the basic right and accessible to every child who was entitled to that. The government was also obliged to ensure that all school-age children are enforced to enroll at primary schools and attend frequently at studies. Moreover, the government had to give special attention to equity by ensuring that Other Vulnerable Children (OVC) like the girl child, disabled children, street children, victims of child labour, children living in poor families, children of pastoralist and hunter-gatherer societies are enrolled, attend regularly at schools and complete primary education (URT, 2006). Other groups, which had to be given compulsory primary education, were orphans and children living in difficult conditions as well as hard to reach areas (URT, 2006).
In regard to quality improvement, the programme aimed at improving quality of teaching and learning processes by providing quality services, which would bring positive results on learning outcomes to pupils (URT, 2006). Factors that decided on quality of teaching and learning processes were training and upgrading of teachers, adequate numbers and quality of human resources required to manage research, teach, monitor as well as evaluate education process (URT, 2006).
The third priority in PEDP II was on strengthening capacity in governance, management and monitoring for the purpose of strengthening capacity and competences of all education actors at all levels (URT, 2006). The process facilitated attainment of desired efficiency in provision of basic education to learners. At the same time, it aimed at ensuring that training on good governance, management and accountability were offered to all education actors at all levels. Other major issues dealt with in training involved internal efficiency and quality (URT, 2006).
In regard to PEDP II, Cross Cutting Issues involved HIV and AIDS, Environmental Education and Gender Equality (URT, 2006). For HIV and AIDS awareness, PEDP II was focused to children and youths in schools and teachers‟ colleges. While in regard to environmental education, it was integrated in study programmes offered in pre-primary schools, primary schools, secondary schools, Teachers‟ Training Colleges and Vocational Training Colleges. Lastly, in addressing gender issues, the major goals were on access, quality and equity (URT, 2006).
1.2.8 Budgets for Primary Education Development Programmes I and II
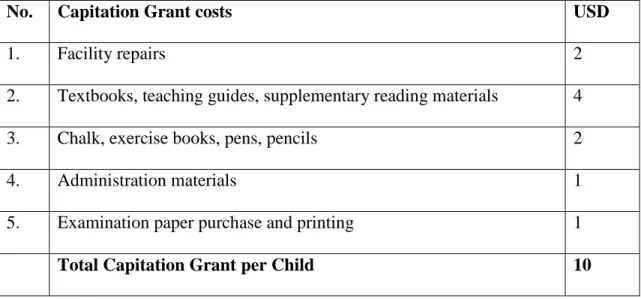
Successful implementation of these programmes depended mostly on funds. In order to implement them, the government of Tanzania had to allocate funds to enable objectives of each programme to be met. In PEDP 1, acquired funds were divided into three categories: Development funds, Personal emoluments and funds for Other Charges that were further subdivided into capitation grants and general other charges. PEDP set the capitation grant at United States of America dollars (US $) 10 at the beginning of the
programme to meet pupils‟ needs regardless of their economic backgrounds. The money was sent directly to schools and had to be spent as follows: 40 percent for textbooks, 20 percent for rehabilitation of school buildings, 20 percent for purchase of school materials, 10 percent for examination and 10 percent for school administration (URT, 2001). The summary of budget for PEDP I is presented in Table 1.2 while analysis of the budget for PEDP I is provided in Table 1.3.
Table 1.2 : Primary Education Development Programme I Budget
mill. Tsh 2002 2003 2004 2005 2006 Total Recurrent budget 199,831.6 234,774.8 271,989.2 296,292.2 312,642.5 1,315,530.3 Development budget 99,633.0 88,274.0 92,424.0 48,330.0 43,608.0 372,269 Total PEDP budget 299,464.6 323,048.8 364,413.2 344,622.2 356,250.5 1,687,799.3 Source: URT (2006).
Table 1.3 : Primary Education Development Programme I Budget Details
2002 2003 2004 2005 2006 TOTAL A. RECURRENT BUDGET Cost (mill. Tsh) Primary Education Recurrent Budget
Non Formal Education
Recurrent Budget 197,530. 0 2,301.6 227,870. 0 6,904.8 259,330. 4 12,658.8 276,733. 4 19,558.8 286,581. 5 26,061.0 1,248,045.3 67,485 TOTAL RECURRENT BUDGET 199,831. 6 234,774. 8 271,989. 2 296,292. 2 312,642. 5 1,315,530.3 B. DEVELOPMENT BUDGET 1. CONSTRUCTION Classrooms 57,551 55,594 58,942 28,197 24,205 224,489
Teacher Housing 12,086 11,675 12,378 5,921 5,083 47,143
Staff Rooms Construction 76,637 74,269 78,320 34,118 29,288 292,632
2. CAPACITY BUILDING School Committee 5,337 5,436 5,535 5,643 5,751 27,702 District 4,731 4,731 4,731 4,731 4,731 23,655 Region 830 830 830 830 830 4,150 Central 1,660 1,660 1,660 1,660 1,660 8,300 Technical Assistance 448 448 448 448 448 2,240
Staff and Stakeholders Capacity Building 13,006 13,105 13,204 13,312 13,420 66,047 3. INFORMATION, EDUCATION AND COMMUNICATION 2,000 900 900 900 900 5,600 4. TEACHER REDEPLOYMENT 7,990 -- -- -- -- 7,990 GOVT TOTAL DEVELOPMENT BUDGET 99,633.0 88,274.0 92,424.0 48,330.0 43,608.0 372,269
TOTAL PEDP BUDGET 299,464.6 323,048.8 364,413.2 344,622.2 356,250.5 1,687,799.3
Source: URT, 2006
In PEDP II, the programme was mainly funded through the National Budget whereby funds were to support pupils‟ learning in terms of enrolment, retention, completion and achievement. The funds were allocated to recurrent and development as directed by the government (URT, 2006). See Table 1.4 for the summary of budget.
Table 1.4 : Primary Education Development Programme II Budget
Cost (mill. Tsh) 2006/07 2007/08 2008/09 2009/10 2010/11 Total Recurrent Budget 591,763 621,169 660,216 687,551 735,585 3,296,284 Development Budget 96,079 345,787 348,458 350,803 284,366 1,425,493 Total PEDP Budget 687,842 966,956 1,008,674 1,038,354 1,019,951 4,721,777 Source: URT, 2011
As it is observed in the budgets presented for PEDP I and PEDP II, distribution of resources within and between the two categories of recurrent and development budgets almost doubled from that of PEDP I to PEDP II. The total budget increased from 1,687,799.3 million Tanzanian shillings in PEDP I to 4,721,777 million Tanzanian shillings in PEDP II (Table 1.2 and 1.4). Table 1.5 lays out details of budget for PEDP II in terms of recurrent, development and total in each of the five years. By looking at these budgets, it implies that government allocated a large amount of money for primary education in PEDP I and II.
Since these were large investments made in primary education in terms of government funding, therefore evaluations of their impacts were inevitable. Although these programmes existed since 2002 to 2011, there are no comprehensive researches which have been done to assess their impacts on improving primary education delivery in the country. Research endeavours had to be done also for the purpose of either nullifying or proving out an increasing worry that existed for a long time in the country that many pupils completed their primary school education without attaining sufficient learning levels. Moreover, research had to be done on PEDP I and II for the purpose of revealing out if the programme‟s academic achievements were met (URT, 2006). Therefore by conducting this study, it helps to unveil impact of PEDP on improving enrolment, retention and performance of pupils in PSLE from economically different communities in Morogoro Rural District and Morogoro Urban District. The results of the study are expected to contribute significant knowledge and give experiences on educational programme planning, implementation, monitoring and evaluation.
2006/07 2007/08 2008/09 2009/10 2010/11 TOTAL A. RECURRENT BUDGET
Primary Enrolment
1. Salaries……… 2. Other Charges……… 3. Capitation Grants for Primary………… 4. Capitation Grants for Pre- Primary…… 5 Capitation Grants for students with special learning
needs………. 6. Capacity building (Training)……… 7. Capacity building (Logistic support)…… 8. Teacher Training……….. 9. Information Education Communication…... 10. Education management Information System……
11. Special Needs Education……… 12. Non Formal Education……… 13. Technical Assistance……… 14. Incentive to teachers Involved in Double Shift…
15. Examinations and Assessment………… 16. Curriculum Development……… 17. Cross-Cutting Issues……… 18. School Inspection……… 19. Monitoring and Evaluation, Reviews and Audits
20. Maintenance Costs (3% of Development budget) 8,217,328 362,518 42,716 82,173 7,916 380 14,924 8,263 39,532 900 1,307 3,241 5,692 224 565 7,995 1,290 404 6,073 3,492 2,158 8,213,523 367,615 44,831 82,135 10,334 387 15,093 8,357 51,292 910 1,321 3,278 5,756 227 520 8,086 1,305 409 6,141 3,532 9,639 7,970,167 407,729 45,678 79,702 13,991 395 14,814 8,205 49,207 893 1,297 3,217 5,650 222 464 7,936 1,281 401 6,028 3,467 9,639 7,849,615 432,440 47,236 78,496 18,943 403 15,334 8,176 44,980 925 1,342 3,330 5,849 230 421 8,215 1,326 415 6,240 3,588 9,660 8,088,516 469,819 51,108 80,885 20,440 411 16,085 8,525 46,382 970 1,408 3,493 6,135 241 399 8,618 1,391 436 6,545 3,764 8,531 40,339,149 2,040,121 231,569 403,391 71,624 1,976 76,250 41,526 231,393 4,598 6,675 16,559 29,082 1,144 2,369 40,850 6,593 2,065 31,027 17,843 39,627
B. DEVELOPMENT BUDGET
Pre- Primary Class rooms Construction…… Primary Class rooms‟ Construction ………… Pre- Primary Toilets………. Primary Toilets………. Pre- Primary Desks……… Primary Desks………. Pre- Primary, Primary Teachers Houses construction costs ………. Construction of Water Tanks (for 30% of
Primary schools)………. - 11,000 - 39,550 - 3,390 18,000 24,139 31,526 59,142 8,025 12,505 4,814.9 7,873 197,424 24,478 31,526 59,142 8,025 12,505 4,814.9 7,873 197,424 27,149 31,526 59,142 8,025 12,505 4,814.9 8,572 197,424 28,794 3,784 59,142 963 12,505 577.9 9,971 197,424 - 98,362 247,568 25,038 89,570 15,022.6 37,679 807,696 104,560 GOV TOTAL DEVELOPMENT BUDGET 96,079 345,787 348,458 350,803 284,366 1,425,493 TOTAL PEDP BUDGET 687,842 966,956 1,008,674 1,038,354 1,019,952 4,721,777
1.3 Statement of the Problem
As indicated in the background to the study, the problems that education was facing worldwide were also faced by Tanzania. Among the problems identified were poor enrolments of pupils in rural primary schools as were in Sub-Saharan Africa and southern and western Asia (UNESCO, 2009), children with disabilities not being enrolled in primary schools (UNESCO, 2007), dropout from studies (UNESCO, 2014) and even pupils to complete their studies with poor performances (UNESCO, 2005).
To solve these problems, Tanzania adopted conventions and declarations made on education like United Nations Declaration of Human Rights of year 1948, Jomtien World Conference on Education for All, the World Education Forum, and the Millennium Development Goals. Tanzania had also initiated Education Sector Development Programme (ESDP) in year 2000. Tanzania also took country-wide initiatives by introducing Primary Education Development Programmes (PEDP) in year 2002 – 2011, with the aims of enabling children from economically different communities and children with disabilities, to enroll in primary schools, to stay and study throughout and at the end, sit and pass Primary School Leaving Examinations (PSLE). Through PEDP initiative, Tanzania was supposed to achieve key indices as per Millennium Development and Dakar Framework for Actions Goals in terms of participation rates, gender parity, dropout rates, completion rates, and pass rates to all pupils especially those from economically different communities. Economically different communities in the context of this study means social groups of any size, whose members are living in either rural or urban areas and having either low or high
incomes. The PEDP also aimed at improving the teaching and learning situation at primary schools by increasing the number of text and reference books for pupils through capitation grants.
Although primary education delivery seemed to acquire some improvements, but still there were questions which emerged and needed answers. Thus, at the end of implementation of PEDP I and II in year 2011, there were several unanswered questions, which sparked in stakeholders‟ minds. Did the programmes achieve intended objectives as planned? Did money allocated for education assist in improving quality of education in the country in terms of enrolment, retention and academic performance of pupils? How did the programmes help children with disabilities in their learning?
Apart from different scholars to evaluate the said programmes (PEDP I and II) in Tanzania in different years, for instance, HakiElimu (2007, 2009), Mushi et. al., (2008, 2012) and Mbelle (2008), none of these researches focused on the impact of PEDP I and II on enrolment, retention and academic performance of pupils in Morogoro Region. For example, the study by Mushi (2008), was conducted in Kilimanjaro, Rukwa and Lindi; while study by Mushi (2012) was conducted in Shinyanga, Manyara, Kigoma, Tanga, Pwani and Mtwara. Therefore, there was need to conduct another study which could answer above questions of stakeholders while focusing on the impact of programmes in Morogoro Region.
Also there had been very little systematic assessment of the extent of PEDP effectiveness on improving education for specific groups of children including boys, girls, and children with disabilities from rural or urban areas in Tanzania. This study intended to unravel this research gap. In addition, the study intended to identify strategies to apply in order to tackle barriers which hindered boys, girls, and children with disabilities from rural and urban areas to study well.
1.4 Objectives of the Study
1.4.1 The Main Objective of the Study
The main objective of this study was to assess differential impact of primary education development programmes on improving enrolment, retention and performance of pupils from economically different communities in Morogoro Urban District and Morogoro Rural District in Morogoro Region.
1.4.2 Specific Objectives
This study had the following specific objectives:-
i. To examine possible differential enrolment rates for school girls, boys and children with disabilities before, during and after PEDP I and II for primary schools located in economically different communities in Morogoro Urban District and Morogoro Rural District;
ii. To examine possible differential retention rates for girls, boys and children with disabilities before, during and after PEDP I and II for schools located in rural and urban communities in Morogoro Rural District and Morogoro Urban District;
iii. To assess possible differential dropout rates for girls, boys and children with disabilities before, during and after PEDP I and II for primary schools in rural and urban communities in Morogoro Rural District and Morogoro Urban District;
iv. To examine academic performance of girls, boys and children with disabilities in PSLE from diverse economic communities in Morogoro Urban District and Morogoro Rural District before, during, and after PEDP I and II; and
v. To find out strategies used in addressing problems of enrolment, retention and academic performance of girls, boys and children with disabilities in Morogoro Rural District and Morogoro Urban District.
1.4.3 Research Tasks
This study was guided by the following research tasks:-
i. To demonstrate how enrolment of girls, boys and children with disabilities before, during, and after PEDP I and II differed significantly in Morogoro Urban District and Morogoro Rural District;
ii. To show the manner in which retention trends for girls, boys and children with disabilities in primary education differed before, during, and after PEDP I and II in Morogoro Urban District and Morogoro Rural District; iii. To demonstrate if the number of girls, boys and children with disabilities
differed in dropout rates before, during, and after PEDP I and II in Morogoro Urban District and Morogoro Rural District;
iv. To demonstrate if the number of girls, boys and children with disabilities differed in academic performance before, during, and after PEDP I and II in Morogoro Urban District and Morogoro Rural District; and
v. To identify strategies to use in addressing problems of enrolment, retention and academic performance of girls, boys and children with disabilities in Morogoro Rural District and Morogoro Urban District.
1.4.4 Research Questions
The study was guided by the following research questions:-
i. Was there any differential increase in enrolment trend of girls, boys and children with disabilities in primary schools during PEDP I and II in Morogoro Urban District and Morogoro Rural District?
ii. What was differential retention trends of girls, boys and children with disabilities in primary education during PEDP I and II in Morogoro Urban District and Morogoro Rural District?
iii. How many girls, boys and children with disabilities dropped out from studies during PEDP I and II in Morogoro Urban District and Morogoro Rural District?
iv. How many girls, boys and children with disabilities passed PSLE during PEDP I and II in Morogoro Urban District and Morogoro Rural District? v. What strategies were used to address problems of enrolment, retention
and academic performance of girls, boys and children with disabilities in Morogoro Rural District and Morogoro Urban District?
1.4.5 Research Hypotheses
The research had the following hypotheses:-
i. Enrolment for girls, boys, and children with disabilities in primary schools differentially increased in PEDP I and II in Morogoro Urban District and Morogoro Rural District;
ii. Retention rate of pupils by sex and children with disabilities differentially increased during PEDP I and II in Morogoro Urban District and Morogoro Rural District;
iii. Dropout rates of girls, boys, and children with disabilities differentially decreased during PEDP I and II in Morogoro Urban District and Morogoro Rural District;
iv. Academic performance of girls, boys, and children with disabilities in PSLE differentially improved during PEDP I and II in Morogoro Urban District and Morogoro Rural District; and
v. Viable strategies improve enrolment, retention and academic performance of girls, boys and children with disabilities in Morogoro Rural District and Morogoro Urban District.
1.5 Significance of the Study
It was hoped that results of this study would provide valuable information to the government, head teachers of primary schools, development partners and the communities on the impacts of PEDP on improving enrolment, retention and academic
performance education of boys, girls and children with disabilities in the Tanzanian education system.
The findings of the study could provide planners, educators, administrators and other educational stakeholders with strategies to improve provision of quality education to boys, girls and children with disabilities living in economically different communities in the country.
The results of the study contribute significant knowledge on educational planning, implementation, monitoring and evaluation. This knowledge may be used by practitioners, policy makers, education planners, managers and stakeholders to improve future programmes and provision of quality education in Tanzania.
1.6 Scope of the Study
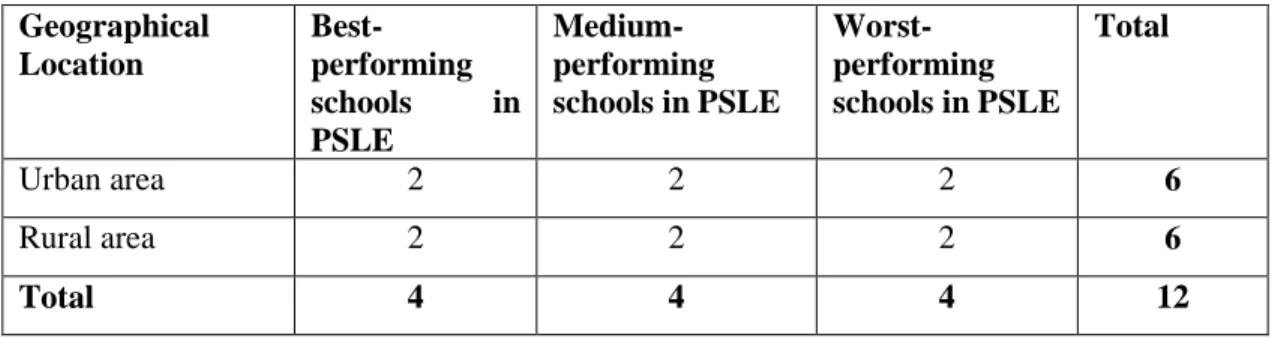
The study was carried out in Morogoro Urban and Rural Districts in Morogoro Region, Tanzania. It addressed the impacts of primary education development programmes on improving enrolment, retention and performance of pupils from economically different communities in Morogoro. Researcher applied purposive sampling procedure to select 12 primary schools (2 best-performing schools, 2 medium-performing schools, and 2 worst-performing schools in PSLE results). These primary schools were selected to represent 98 schools in Morogoro Urban District and 149 schools Morogoro Rural District. 6 schools were selected from Morogoro Urban District, which were typically in urban areas and other 6 schools from Morogoro Rural District. Furthermore, the head
teachers of all 12 schools, 2 district education officers as well as 2 bursars of both districts were involved in follow-up interviews that led to a total of 16 interviewees.
1.7 Limitation of the Study
This study purposively selected twelve primary schools basing on their performances in PSLE without considering direct economic status indices of local communities. Therefore, this could limit the generalization of results and findings. Moreover, data collection procedures which required head teachers to fill survey forms limited the study‟s findings because it happened that some of the schools‟ records were not well kept, damaged or misplaced by former head teacher who retired, demoted or transferred to another school. This situation made researcher to use head teachers‟ reports sent from these primary schools to DEO offices so as to get data required.
1.8 Delimitation of the Study
The study was confined only to twelve selected primary schools located in two districts in Morogoro region. These selected primary schools were few and they could not be totally representative of others. Another delimitation of the study was that, geographical scatterings of these selected primary schools compelled the researcher to extend a bit more time for survey so as to reach everyone in the sample. Lastly, the study focused only to head teachers while excluding pupils who were targeted in these programmes. In this case, pupils were not interviewed to give their opinions on impacts of programmes on their studies.
1.9 Definition of Key Terms and Concepts
The following key terms were defined within the context of study:-
Access refers to the extent to which children of specified schools are able to enter into a particular level or cycle of education (UNESCO, 1989).
Retention refers to situation, which occurs when primary school children who have been enrolled to be provided opportunities to stay in study programme and complete a full cycle of schooling without dropping out after being admitted (Hagedorn 2006). Dropout refers to students who stay away from school more than given number of days or all those who either do not enter to school or leave school before completion of education cycle (Rumberger, 2001).
Academic performance refers to pupils‟ learning outcome levels acquired after their successful completion of primary education (Chowdhuryand Pati, 1997).
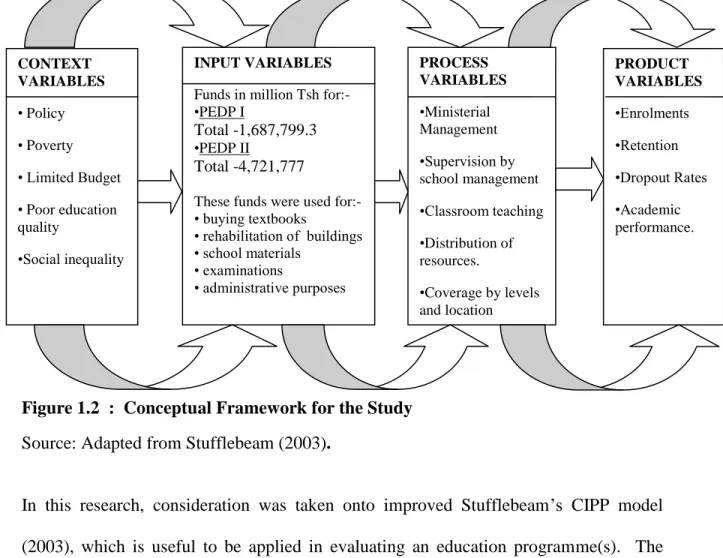
1.10 Conceptual Framework
The study was guided by Stufflebeam‟s (2003) Context, Input, Process, and Product (CIPP) Model, which best fitted in this research. It was a well-constructed framework as components of the model match with the purposes of this study. The CIPP is an acronym which represents the four main components of the model of evaluation, where C – stands for Context, I – stands for Input, P – stands for Process, and P – stands for Product. The CIPP evaluation model developed by Stufflebeam (2003) was prepared to be utilized by evaluators in collecting the data on programme effectiveness, which could at the end help managers in judging programme worthiness. Finally, the decision makers were
expected to use evaluation report, which had to supply them with information of either to go on with, adjust or terminate an education or training programme in whole or part of it (Worthern and Sanders, 1998). One of additional strengths of the CIPP evaluation model was that it might be used for making evaluation in either formative or summative decisions (Worthern and Sanders, 1998).
The CIPP model provided the basis for understanding the PEDP‟s priority investment by showing and describing the mutual relationship among its core constituent elements on improving primary education provision. It further helps to assess requirements, difficulties, assets, and prospects to assist decision-makers in defining purposes and precedence as well as facilitate the large group of consumers‟ to judge out objectives, priorities, and results (Fitzpatrick et. al., 2011). Determining what needs to be addressed by a programme helps in defining objectives for the programme (Worthern and Sanders, 1998). Therefore, before 2001, context evaluation was done and identified problems facing primary education, which included poverty, low budget provision, poor education and inequality in education provision that led to policy formulation. In input evaluation, the government took alternative approaches of implementing PEDP I and II to meet targeted needs as well as achieve goals. The practice involved giving priority in improving investments by expanding enrolment while focusing on increasing number of enrolment rates of pupils, construction of classroom, making teacher engagement and deployment of teacher, quality improvement, encompassing human resources, and provision of teaching and learning resources, and improvements of wide management system, throughout a range of capacity building, in-service and pre-service teacher
training. These in combination are summarized to give PEDP conceptual framework presented in Figure 1.2.
Figure 1.2 : Conceptual Framework for the Study Source: Adapted from Stufflebeam (2003).
In this research, consideration was taken onto improved Stufflebeam‟s CIPP model (2003), which is useful to be applied in evaluating an education programme(s). The CIPP evaluation model (Figure 1.3) is a framework for conducting evaluations of developed programmes, implemented projects and their products, institutions, personnel, and evaluation systems (Stufflebeam, 2003). The Stufflebeam‟s (2003) CIPP Model was designed to assist administrators in making informed decisions and it was a familiar used evaluation method in educational settings (Fitzpatrick et. al., 2011).
CONTEXT VARIABLES • Policy • Poverty • Limited Budget • Poor education quality •Social inequality INPUTVARIABLES Funds in million Tsh for:- •PEDP I
Total -1,687,799.3
•PEDP II
Total -4,721,777
These funds were used for:- • buying textbooks • rehabilitation of buildings • school materials • examinations • administrative purposes PROCESS VARIABLES •Ministerial Management •Supervision by school management •Classroom teaching •Distribution of resources. •Coverage by levels and location PRODUCT VARIABLES •Enrolments •Retention •Dropout Rates •Academic performance.
Figure 1.3 : Components of Stufflebeam’s (2003) CIPP Model. Source: Stufflebeam (2003).
The context evaluation stage of the CIPP Model assists in decision-making related to
planning and makes the assessor to identify needs for programme, available assets and resources of society so as to present programmes that would be valuable (Fitzpatrick et. al., 2012; Mertens and Wilson, 2012). Context evaluation also recognizes the political situation that could persuade programme achievement (Mertens and Wilson, 2012). To achieve this, the evaluator has to collect and evaluate previous information and has to interview programme leaders and its stakeholders. In addition, in order to make evaluation effective, key stakeholders are recognized as well as assessment of programme goals is undertaken together with data collection from related programme reports (Fitzpatrick et. al., 2011). Therefore, in this study, the context evaluation stage focused on the policy developed by the government to deal with inequality and poor
education provision as well as poverty of population, which may have a bearing on the implementation of PEDP.
In the input evaluation stage, information is collected, which focuses on plan, goals and mission of the programme. Its purpose is to assess the programme‟s strategy and work plan on their merit as well as demerit and against research, the responsiveness of the programme to requirements of client, and other strategies used in similar programmes (Mertens and Wilson, 2012). The main aim of this stage is to select a good strategy to be used in implementation so as to solve the identified problems of the programme (Fitzpatrick et. al., 2011). In input evaluation stage of the programme, the government planed and set out goals as well as mission, which were to be met as well as achieved through funds allocations. As shown in Figure 1.2, it was indicated that in PEDP I, the government allocated 1,687,799.3 Tanzanian shillings and in PEDP II, a total Tanzanians shillings mounting to 4,721,777 were spent.
The Process evaluation stage investigates the quality in the programme implementation.
In this stage, programme activities have to be monitored as well as put in documentation and its progress has to be assessed by the evaluator (Fitzpatrick et. al., 2011; Mertens and Wilson, 2012). Primary aims of this stage are to provide feedback, which highlights how far the planned events were carried out, give guidelines to staff on the way to modify and lead improvement to the programme‟s plan, and finally, to evaluate the degree participants can accomplish with regard to their roles (Stufflebeam, 2003). In PEDP I and II, the government decided to involve the Ministry of Education and