Technical Efficiency of African Public Universities: A Data
Envelopment Analysis
Ngobi Kiwanuka Robert1* Yawe Bruno Lule2 Ddumba-Ssentamu John2 1.P.O. Box 24911 Kampala, Uganda (Permanent Address)
2.School of Economics, Makerere University, P.O.Box 7067 Kampala, Uganda
Abstract
Using the Data Envelopment Analysis techniques, the study examines the relative technical efficiency of 15 African public universities using 2000-2007 data set. The operating environment is adjusted to ascertain the extent to which it affects the relative efficiency scores of the universities. The universities post mean technical efficiency scores of: 0.886, 0.900 and 0.971 for the general model, teaching-only and research-only model, respectively. African public universities are hence more efficient in their research function than in their teaching function. The productivity gains of the universities are attributed more to embracement of technological advancements in both their teaching and research function rather than to improvements in the efficiency of their internal processes.
Keywords: African public universities, Data envelopment analysis, Technical efficiency, Scale efficiency
DOI: 10.7176/EJBM/11-3-20
1. Introduction
The overall purpose of any country’s higher education policy is to establish a higher education system with efficiently operating higher education institutions. The question of the efficiency of higher education institutions is important not only because of inadequate state funding but also the rapid increase of the student mass (Al-Bagoury, 2013) which is not matched by corresponding investments in infrastructure and other higher education services like staffing and provision of sponsorship to all qualifying students. The funding landscape of African public universities is now a shared responsibility of governments, parents/students and the donor community who are not only interested in the “excellence and prestige” of public universities but also their efficient utilization of resources (Daghbashyan, 2011).
Relative technical efficiencies enable university managers to determine the extent to which resources/inputs would be saved and which efficient peers could be emulated by inefficient peers to improve their efficiency. Efficiency of universities not only increases value for money but also enhances the production of high-level manpower and scientific knowledge required for global competitiveness. Cross-university and-country technical efficiency studies facilitate cross-fertilization of the best practices in the teaching and research functions of African public universities (Jill, Maria & Emmanuel, 2017). Technical inefficiency could result in increased production costs which will make African public universities less efficient and competitive. There is therefore an ever-growing interest to measure the relative efficiency of universities because of the competing needs for public resources from other sectors such as: health, national armies and militarized police systems (Tommaso, 2017). The rate at which the African public universities convert inputs into desirable outputs is, however, not well known. The objective of the study is therefore to examine the technical efficiency of Africa public universities using 2000-2007 data set. The study is limited to the interrelationship between inputs and outputs and does not address any another type of efficiency such as cost efficiency.
2. Theoretical Framework
The economic theory underlying efficiency analysis dates back to the works of: Koopmans (1951), Debreu (1951) and Farrell (1957). Farrell (1957) defined a simple measure of firm efficiency that could account for multiple inputs within the context of technical, allocative and productive efficiency. Technical efficiency is concerned with the failure to operate on the production frontier while allocative efficiency is concerned with the ability of a decision making unit to choose between different technically efficient combinations of inputs used to produce the maximum possible outputs. If a decision making unit is technically and allocatively efficient, it is said to have achieved economic efficiency otherwise economic inefficiency (Coelli et al, 2005).
Farell (1957) illustrated a constant returns to scale input-orientation to the measurement of technical efficiency which evaluates the ability of a Decision Making Unit (DMU) to maximize output by keeping inputs fixed. Farrell (1957) Input-orientated framework for measuring both technical efficiency and allocative efficiency is illustrated in Figure 1.
Figure1: Technical and Allocative Efficiency from an Input Orientation Source: Adapted from Coelli et al, 2005
The line SS’ represents an isoquant while line AA’ is an isocost. X1/Y and X2/Y are proportions of inputs used in production of output Y. The Technical Efficiency (TEI) of DMUp is measured by the ratio: OQ/OP. The distance QP reflects the radial reduction of inputs that would make DMUp efficient without a decrease in its output levels. The distance QP hence represents the technical inefficiency of the firm. The allocative efficiency of DMUp on the other hand is reflected by the ratio: AEI = OR/OQ. The distance RQ is therefore the magnitude by which production costs could be radially reduced to make DMUP both technically and allocatively efficient at point Q’. Since Economic Efficiency (EEI) is the product of technical efficiency (TEI) and allocative efficiency (AEI), it is expressed as follows: TEI x AEI = (OQ/OP) x (OR/OQ) = (OR/OP).
The Farrell (1957) output-orientated efficiency framework under the constant returns to scale assumes that two products (y1 and y2) are produced using a single input (x). Figure 2 illustrates measurement of technical and allocative efficiency under the output-orientated approach. Line ZZ’ is the production possibility curve and line DD’ is the isorevenue. DMUA is inefficient because it lies below the production possibility frontier and could become technically efficient by radially increasing its output to point B without using additional inputs (X).
Figure 2: Technical and Allocative Efficiency from an Output Orientation Source: Adapted from Coelli et al, 2005
The technical efficiency of DMUA under the output-orientation formulation is represented by the ratio: TEO = OA/OB. The allocative efficiency of DMUA is represented by the ratio: AEO = OB/OC implying that DMUA can radially increase its revenue without increasing its utilization of input X up to point B’ so as to become economic efficient. The overall Economic Efficiency (EE) is a product of both the Technical Efficiency (TE) and Allocative Efficiency (AE) and is hence expressed as follows: EEO = (OA/OC) = (OA/OB) x (OB/OC) = TEO x AEO (Coelli et al, 2005). Technical Efficiency (TE) is further decomposed into: Pure (local) Technical Efficiency (PTE) and Scale Efficiency (SE). The relationship between PTE and SE is described as: TE= PTE X SE. Under the DEA CCR options DMUs are assumed to be scale efficient. The PTE is hence captured under the DEA BCC option while the scale efficiency of the DMU is captured under the DEA CCR option. The two options yield different efficiencies as demonstrated in Figure 3 using a single input variable to produce a single output metric (Key et al, 2008).
Figure: 3 Pure Technical and Scale Efficiency Source: Adapted from Ramanathan, 2003
Figure 3 is drawn on the CRS assumption depicted by a ray that runs from O through point A to M and marked “CRS”. Decision Making Unit A is both technically and scale efficient because it tangential to both the CCR and VRS lines. The VRS piecewise linear frontier, PBACD is introduced to enable the process of disintegrating technical efficiency into pure technical efficiency and scale efficiency. Decision Making Units: A, B, C and D are VRS technically efficient unlike H. DMUs like B and C are technically efficient but scale inefficient. DMUB is operating in the IRS portion and could become more productive by increasing its scale of production towards point A. DMUc which is operating in the DRS region could become more productive by reducing its scale of production towards A. DMUA, however, cannot become more productive because it is operating at its technically optimal productive scale, Most Productive Scale Size (MPSS). The MPSS for DMUH is computed by first eradicating technical efficiency that involves moving from point H to point L on the production frontier followed by estimation of the divergence in the input from the CCR/CRS frontier. The TE of DMUH is computed as follows:= and the PTE of DMUH is calculated as follows: = . Decision Making Units B, C and D are pure technical efficient but scale inefficient unlike DMUA. Decision Making Units: B, C and D would become scale efficient by emulating the scale operations of DMUA. The scale efficiency of a DMU is a ratio of its TE to its PTE: ∗ (Coelli et al, 2005; Ramanathan, 2003).
3. Empirical Literature Review
University efficiency studies have been conducted in a number of countries such as Australia (Avrikani, 2001; Abbott & Doucouliagos, 2003, Carrington et al, 2005, Worthington & Lee, 2008), China (Ng & Li, 2006); Germany (Fandel, 2007, Kempkes & Pohl, 2010) and USA (Colbert et al, 2000). Australian universities have been extensively studied. The UK on the other hand, has a particularly long and rich tradition in formal analysis of the efficiency of the higher education sector in Europe (Flegg et al, 2003; Izadi et al 2002; Johnes, 2006b). Efficiency studies have also addressed higher education institutions across countries (Agasisti & Johnes 2009, Wolszcak-Derlacz & Parteka, 2011). Selected empirical studies are reviewed for purposes of contextualizing the study.
Kipesha and Msigwa (2013) indicated that seven Tanzanian public universities fulfilled their primary responsibility of transferring knowledge to society during the period, 2007/08-2011/12. The universities efficiently (75%) utilized their staff and enrolled students to generate both internal revenues and degree outputs. The universities were, however, inefficient (59%) in generating income using consultancy services, enrolment fees, research and other investments. The improvement in internal revenue generation could have minimised dependence on public and donor funds by Tanzanian public universities.
Ramirez-Correa, Pena-Vinces, & Alfaro-Perez (2012) asserts that Turkish public universities were in position to increase their research and educational outputs by 1% with the same inputs. There were regional differences with the Black Sea as the most efficient region scoring an efficiency score of one. In a related study, Ulucan (2011) revealed that there were no significant differences between the efficiency of public universities and private universities in Chile because of the highly competitive environment.
Wolszcak-Derlacz & Parteka (2011) revealed that public higher education institutions in seven European countries1 could have improved their output by as much as 55% without employing additional inputs. The determinants of their relative technical efficiency were: bigger universities in terms of student numbers and number of faculties enjoyed economies of scale and hence size was an important factor in their efficiency, the gender structure of academic staff was positively correlated with university efficiency and younger & public universities displayed higher inefficiency levels.
Lee (2011) attributed the research efficiency of 37 Australian public universities to: universities located in
Metropolitan Cities easily enjoyed collaborations & attracted senior academics compared to their counterparts located outside the Metropolitan Cities, universities with higher proportions of senior academics were more research efficient than their counterparts with lower proportions of senior academics, better funded universities produced more research outputs than their poorly funded counterparts and low research efficiency of populous universities confirmed the hypothesis that more student numbers indicate less time spent on research activities.
Taylor & Harris (2004) and Taylor &Harris (2002), however, attributed the relative efficiency differences between South African public universities to student characteristics, quality & deployment of personnel and the allocation of recurrent expenditures. Cunha and Rocha (2012) revealed that 14 Portuguese public universities were capable of reducing their input consumption by 17% to produce the same quantities of outputs in 2008. There was therefore some theoretical “waste” of resources in a number of Portuguese public universities during the 2008 academic year. Johnes (2006a) indicated high level (93%-96%) efficiency levels for English higher institutions triggering off a public debate on the premise that the institutions had no profit motivation. The long time exposure of the English higher education institutions to market forces created competition for the best students and research funds thus providing incentives for efficiency.
4. Materials and Methods
A critical issue in measuring the efficiency of higher education institutions is how to aggregate the heterogeneous input and output variables in the absence of market prices. One approach to assessing the efficiency of universities is the econometric method, Stochastic Frontier Analysis which defines a production function and assumes that deviations from the production frontier are composed of two terms, inefficiency and measurement error. Another approach to measuring efficiency of universities is the mathematical approach, the Data Envelopment Analysis (DEA). The Data Envelopment Analysis (DEA) technique is used to measure the technical efficiency of each university as a ratio of weighted outputs to weighted inputs not assigned a priori but calculated so as to reflect the university at its most efficient value relative to other universities in the sample. The DEA is widely used to identify best practices of peer decision making units and measures technical efficiency based on the concept of efficiency frontier. It is possible to determine both the lowest level of inputs necessary to attain a given level of output and the highest level of output for a given level of inputs (Coelli et al, 2005). Charnes, Cooper and Rhodes (1978) proposed a Constant Returns to Scale (CRS) input-orientated DEA model specified in Equation 1 as:
Min ϴ, λϴ Subject to
-yi + Yλ ≥ O ……… ……….1 ϴxi - Xλ ≥ O
λ ≥ O
Where ϴ is a scalar and λ is an Nx1 vector of constants. The constraint; λ ≥ O means the efficiency scores of each public university would be equal to or greater than zero. The DEA evaluates the efficiency of each university through a system of weights to maximize each university’s efficiency score; ϴ which lies in the interval [0, 1]. Equation 1 is run fifteen times and hence the value of ϴ is computed for each university. It was assumed that the ith university used x
i inputs of the aggregate X inputs to produce yi outputs of the composite Y output. Universities with an efficiency score of unity are efficient and lie on the production frontier otherwise they are inefficient. The DEA form in Equation 1 enables the ith African public university to radially minimize the input vector xi as much as possible but still remain within the feasible input set. The radial contraction of input vector xi, produces a projected point, (Xλ, Yλ) on the surface of this technology such that all observed points lie on or below the production frontier. The CRS DEA model enables a university to be benchmarked against a university that could be larger (smaller) than it (Ramanathan, 2003).
4.1 Measuring Pure Technical and Scale Efficiency
Equation 1 is built on the premise that African public universities operated at their optimal scales and that they were equally efficient in converting their inputs into outputs irrespective of their sizes. The CRS option in addition produces technical efficiency scores that are confounded by scale efficiencies. The study follows Banker et al (1984) to separate pure technical efficiency from scale efficiency under the variable returns to scale option expressed in Equation 2. Equation 1 is modified to account for the variable returns to scale by adding the convexity constraint NI’λ = 1.
Min ϴ, λϴ Subject to -yi + Yλ ≥ O ……….2 ϴxi - Xλ ≥ O NI’λ = 1 λ ≥ O
The convexity constraint NI’λ = 1 enables inefficient universities to be benchmarked against only universities of similar size. Equation 2 decomposes the relative technical efficiency of universities into pure technical efficiency and scale efficiency. A difference in the CRS and VRS efficiency scores implies that a particular university is scale inefficient (Coelli et al, 2005).
4.2 Measuring Scale Efficiency with Non Increasing Returns to Scale
Equation 2 does not enable one to know whether the university is operating at increasing or decreasing returns to scale. The dilemma of being unable to tell the correct scale of operation is addressed by the Non-Increasing Returns to Scale (NIRS) DEA model specified in Equation 3. In Equation 2 the convexity constraint NI’λ=1 in Equation 3 is replaced with NI’λ ≤ 1.
Min ϴ, λϴ Subject to -yi + Yλ ≥ O ………..3 ϴxi - Xλ ≥ O NI’λ ≤ 1 λ ≥ O
The constraint NI’λ ≤ 1 permits a university to be benchmarked against only universities that are smaller than it. The nature of the scale inefficiencies due to increasing or decreasing returns to scale for a specific university is determined by comparing the NIRS technical efficiency scores with the VRS technical efficiency scores. If the two efficiency scores are unequal the university will operate in the increasing returns to scale region. Equality of the VRS and NIRS efficiency scores implies that the university is experiencing decreasing returns to scale. A scale efficiency of less than unity implies that the university is small in its operations and can enjoy benefits of expansion. Universities with scale efficiency scores greater than unity are large in their operations and can become efficient by scaling down its operations (Coelli et al, 2005).
4.3 Unit of Analysis
The first stage in the DEA is the selection of the decision making unit whose efficiency is to be measured. The units of analysis are 15 African public universities. The study follows Smith & Street (2006) who assert that the unit of analysis should: (i) capture the entire production process of interest, (ii) be a decision making unit i.e. capable of converting inputs into outputs and have control over the technological process by which inputs are converted into outputs and (iii) the sample units should be mutually comparable i.e. seeking to produce similar outputs.
4.4 Data Sources and Sample Size
Panel data used to estimate the technical efficiency African public universities are obtained from the Centre for Higher Education Transformation (CHET) and the Higher Education Management Information System (HEMIS) of the Department of Higher Education and Training, Republic of South Africa. In a DEA model; three variables: the number of inputs (p), the number of outputs (q) and number of DMUs (n) are important in determining the sample size. The study followed Cooper, Seiford and Tone (2000) who argue that a rough rule of thumb for determining the sample size for a DEA model is as follows: n ≥ Max {pxq; 3(p+q)]}. The DEA has, however, been applied on small samples (Ramanathan, 2003). Charnes et al (1978) assert that all input-output data of DMUs should strictly be positive and hence give no chance to blank entries or zero values in the balanced data set.
4.5 Choice of Input and Output Variables
Public universities have multiple objectives and use multiple inputs to produce multiple outputs (Kosor, 2013). In selecting the variables and the models to be estimated, the study follows Wolszak-Derlacz & Parteka (2011) and Taylor & Harris (2004). Wolszak-Derlacz & Parteka (2011) use student enrolments & staff as input variables and graduation numbers & ISI publications as output variables to examine the technical efficiency of 259 European public higher education institutions across seven countries. Taylor and Harris (2004) estimate the technical efficiency for the general model, teaching-only model and research-only model for South African public universities. University staff are broadly categorized as teaching and non-teaching staff. Student enrolments and graduation numbers are disaggregated into: undergraduate and postgraduates. The separation of doctorates is intended to amplify the variation across universities in production of doctorates as a research output. Institute of Scientific Information (ISI) papers make universities part of the global knowledge community (Boshoff, 2010, Cleote et al, 2012). The input and output variable specifications are presented in Table 1.
Table 1: Definition of Variables for estimation of Technical Efficiencies of Universities
Inputs Description
1. Student Enrollments Total number of students enrolled in a university disaggregated into Undergraduates, Post Graduates up to Masters level and PhDs 2. Staffing Levels Total number of university staff disintegrated into teaching & non-teaching categories
Outputs
3. Graduation/Completion numbers
Total number of university graduates disaggregated into Undergraduate ,Post Graduates up to Masters level and PhDs
4. Research outputs Total university research output; ISI Papers and Doctoral Graduates
4.6 Model Specifications
The identification of inputs and outputs to include in a particular application of a DEA Model is contextualized differently by researchers (Norman and Stocker, 1991). The study follows Pastor et al (2001) to estimate the technical and scale efficiency scores of the general models, teaching-only models and research-only models of African public universities. The input-orientated VRS option is adopted because: (i) it is difficult to change the scale of operation of universities in the short run, (ii) the universities are of variant sizes, (iii) it allows scales of economies to change as the size of universities change, (iv) it allows universities to be benchmarked against the universities of the same size, and (v) estimated technical efficiency scores are free from scale efficiency effects (Carrington et al, 2005). In estimating the efficiency scores of the preferred and adjusted preferred models, a sensitivity analysis of the efficiency scores is conducted to verify the extent to which efficiency scores are affected by the omission or addition of an input variable (s) since the output variables is fixed for all three models.
4.6.1 General Model Specifications
The General Model is built on the premise that universities produce both graduates and research outputs (Lehmann & Warning, 2002). Total graduation numbers and total research outputs were the two fixed output variables with which 10 different sets of inputs were coupled to estimate technical and scale efficiencies of African public universities. Input and output variable specifications for the general models are presented in
Table 2.
Table 2: General Model Specifications
General Model Specifications 1 2 3 4 5 6 7 8 9 10
Inputs Variables:
X1 Undergraduate Enrolments x x x
X2 Postgraduate Enrolments up to Masters level x x x
X3 Total Enrolments x x x x
X4 Doctoral Enrolments x x x x x
X5 Total Number of Teaching Staff x x x x x
X6 Total Number of Non-Teaching Staff x x x x
X7 Total Staff x x
Output Variables
Y3 Total Graduations Numbers x x x x x x x x x x
Y6 Total Research Outputs x x x x x x x x x x
Model 5 is selected as the preferred general model based on the following criteria:
(a) Charnes et al (1989) heuristic for the DEA that restricts the total number of variables to include in the various model specifications to four.
(b) Fixed output variables reflect the basic core functions of a university which are teaching (total graduation numbers) and research (total research outputs) and
(c) The model includes the vital university inputs which are total student enrolments and total staff (Worthington and Lee, 2008).
4.6.2 Teaching-Only Model Specifications
The teaching-only model is built on the premise that universities employ academic staff to educate students enrolled to produce graduates as outputs (Kuah & Wong, 2011). Total undergraduate and- postgraduate graduation numbers are the two fixed output variables with which 10 different sets of input-variables in Table 2
are teamed up with to estimate the teaching efficiency scores for African public universities. Model 7 is selected as the preferred teaching-only model because it meets the set criteria:
(a) Charnes et al (1989) heuristic for the DEA that restricts the total number of variables to include in the various model specifications to four;
(b) Fixed output variables reflect the teaching function of a university which are total undergraduate graduation numbers and total postgraduate graduation number and
(c) The model includes the vital university teaching inputs which are total student enrolments and total number of teaching staff (Worthington and Lee, 2008).
4.6.3 Research-Only Model Specification
The Research-Only Model is built on the premise that academic staff with doctorates & doctoral enrolments are the main inputs while doctoral graduates & publications are the main high level knowledge outputs (CHET, 2013). Total doctoral graduation numbers and ISI papers are the two fixed research output variables with which 10 different sets of input-variables in Table 2 are coupled to estimate research technical efficiencies of African public universities. Model 9 is selected as the preferred research-only model based on the following criteria:
(a) Charnes et al (1989) heuristic for the DEA that restricts the total number of variables to include in the standard DEA specifications to four.
(b) The CHET (2013) criteria which considers:
(i) Academic staff (with PhDs/Doctorates) and doctoral enrolments are the main inputs into a university’s high level knowledge production and
(ii) Doctoral graduates and research publications as the main high level knowledge outputs
4.7 Adjusting the operating environment for African Public Universities
The operating environment of African public universities is adjusted for in two ways: (i) compare only decision making units which operate in a similar environment. The disadvantage with this approach is that the number of universities to compare will reduce and yet the main lessons to learn may come from decision making units operating in dissimilar environment and (ii) compare only DMUs operating in similar or less favorable operating conditions. The pitfalls of the preceding option are addressed but it ignores potential lessons from decision making units operating in more favorable conditions (Common Wealth of Australia, 1997). The study adopts Bailey, Cloete & Pillay (2012) clustering of African universities. The first sub-group of universities; Cluster A is built of the premise of comparing only universities operating in similar or less favorable operating conditions while Cluster B is built on the premise of comparing only universities that operate in a similar environment. The universities in Cluster A and Cluster B are listed in Table 10.
5. Empirical Results
The technical and scale efficiency scores of the general, teaching-only and research-only models were computed using the DEAP Version 2.1 Computer Software developed/written by Coelli, 1996. A key feature of DEA is that the efficient frontier is formed by the best performing units and hence DEA is an extreme point technique. There is no direct way of assessing whether the deviation from the frontier is statistically significant or not. The DEA results therefore had to be tested by some form of sensitivity analysis. Sensitivity analysis is conducted by verifying how efficiency scores retort when input or output variables are introduced or withdrawn from a set of DMUs under consideration. The study followed Pastor et al (2001) who establish the extent to which a variable not included in the DEA model would improve the efficiency estimates when included. The methodology therefore involves comparing the efficiency scores of the reduced model with those of the extended/augmented/total model. Care was taken to avoid model misspecifications especially for the preferred models which is majorly a result of inclusion of irrelevant variables, omission of relevant variables, and or incorrect assumptions (Worthington & Lee, 2008, Boshoff, 2010). Due to space constraints: (i) only results of the preferred and adjusted preferred models are presented, (ii) Abbreviations for African public universities that appear in brackets for each universities in Table 3 are adopted for subsequent tables & are used in the text and (iii) Table 3 contains both the reduced and augmented general model, teaching-only model and research-only model technical and scales efficiencies for the African public universities.
5.1 The Preferred General Model
The university specific technical efficiency and scale efficiency scores for the 10 general model, teaching-only model and research-only model specifications are computed to check the stability and test the sensitivity of the efficiency scores of the preferred and adjusted preferred models to the removal or addition of input variables. The technical efficiency and scale efficiency scores for the three augmented and three reduced models are presented in Table 3.
Table 3: Technical [and Scale] Efficiencies of African Public Universities
Total enrolments and total staff are paired with total number of graduates and total research output to estimate technical and scale efficiencies of the preferred general model, Model 5. The number of efficient universities reduced from nine that are posted by Model 4 to five in Model 5 as result of removing doctoral enrolments as an input variable. The mean efficiency score reduced from 0.975 to 0.886 which means that doctoral enrolments are a significant input variable to the combined teaching and research technical efficiency of African public universities. The university specific technical and scale efficiency scores for the preferred general model, Model 5 are presented in Table 4.
Table 4: Technical and Scale Efficiency Scores for the Preferred General Model
DMUs CRS Efficiency Technical VRS Efficiency Technical Scale Efficiency Scale Level
1. MaK 0.665 0.689 0.966 DRS 2. UoM 0.488 0.496 0.985 DRS 3. UG 0.651 0.665 0.980 DRS 4. UB 0.830 0.844 0.984 DRS 5. UNOBI 0.844 0.847 0.997 IRS 6. UDSM 0.957 0.958 0.999 DRS 7. NMMU 0.914 0.928 0.985 DRS 8. UKZN 1.000 1.000 1.000 MPSS 9. UWC 0.871 1.000 0.871 IRS 10. UFS 1.000 1.000 1.000 MPSS 11. WITS 1.000 1.000 1.000 MPSS 12. UL 0.879 0.945 0.930 IRS 13. RU 0.940 0.975 0.965 IRS 14. UFH 0.827 0.943 0.877 IRS 15. UCT 0.948 1.000 0.948 IRS = 1 3 5 3 < 1 12 10 12 Maximum Efficiency 1.000 1.000 1.000 Minimum Efficiency 0.488 0.496 0.871
UKZN, UFS, UCT, UWC and WITS were fully efficient and formed the Efficiency Reference Set. UKZN, UFS and WITS were scale efficient and hence operated in the Most Productive Scale Size (MPSS). UoM, MaK, UG, UB, NMMU and UDSM operated in DRS region and hence should scale down their inputs and or increase their outputs for the same set of inputs to become efficient. UNOBI, UL, UWC, UR, UFH and UCT operated in the IRS region and would scale up both their inputs and outputs so as to become efficient. The peers and peer
weights of the preferred general model; Model 5 are presented in Table 5. Table 5: Peers and Peer Weights for the Preferred General Model
DMUs Peer Count Peers Peer Weights
1. MaK 0 11 8 0.576 0.424 2. UoM 0 8 11 0.337 0.663 3. UG 0 11 8 0.485 0.515 4. UB 0 8 11 0.735 0.265 5. UNOBI 0 8 15 0.802 0.198 6. UDSM 0 11 8 0.061 0.939 7. NMMU 0 8 11 0.880 0.120 8. UKZN 8 8 1.000 9. UWC 2 9 1.000 10. UFS 0 10 1.000 11. WITS 8 11 1.000 12. UL 0 9 11 15 0.404 0.511 0.085 13. RU 0 8 15 11 0.009 0.654 0.337 14. UFH 0 15 9 0.558 0.442 15. UCT 4 15 1.000
The most (eight times) benchmarked efficient universities were: UKZN and WITS followed by the UCT (four times). Efficient universities were automatically their own peers. MaK for example would adopt the input-output mix characteristics of WITS by 57.6% and UKZN by 42.4% to become technically efficient. RU would benefit more, 65.4% by emulating the input-output mix characteristics of UCT than it would by benchmarking against WITS, 33.7% and UKZN, 0.9% to become technically efficient.
5.2 The Preferred Teaching-Only Model
In the preferred teaching-only model, Model 7, total enrolments and teaching staff are teamed up with total undergraduate graduation numbers and total postgraduate graduation numbers to estimate teaching efficiency of African public universities. The university specific technical and scale efficiency scores for Model 7 are presented in Table 6.
Table 6: Technical and Scale Efficiency Score for the Preferred Teaching-Only Model DMUs CRS Technical Efficiency VRS Technical Efficiency Scale Efficiency Scale Level 1. MaK 0.708 0.722 0.981 IRS 2. UoM 0.502 0.510 0.983 IRS 3. UG 0.664 0.667 0.996 DRS 4. UB 0.851 0.856 0.994 IRS 5. UNOBI 0.847 0.900 0.942 DRS 6. UDSM 0.953 1.000 0.953 DRS 7. NMMU 0.930 0.957 0.971 DRS 8. UKZN 1.000 1.000 1.000 MPSS 9. UWC 0.820 1.000 0.820 IRS 10. UFS 0.737 1.000 0.737 IRS 11. WITS 1.000 1.000 1.000 MPSS 12. UL 0.888 0.956 0.929 IRS 13. RU 1.000 1.000 1.000 MPSS 14. UFH 0.860 0.930 0.926 IRS 15. UCT 1.000 1.000 1.000 MPSS = 1 4 7 4 < 1 11 8 11 Maximum Efficiency 1.000 1.000 1.000 Minimum Efficiency 0.502 0.510 0.737
UKZN, RU, UCT and WITS were scale efficient, operated in the Most Productive Scale Size (MPSS) and hence altering their input-output mixes would make them inefficient. UG, NMMU, UDSM and UNOBI operated in the DRS region. UoM, UL, UFH, MaK, UWC, UB and UFS operated in the IRS region. The Peers and Peer Weights for the Preferred Teaching-Only DEA Model are presented in Table 7.
Table 7: Peers and Peer Weights for the Preferred Teaching-Only Model
The most (six times) referent efficient university was the UKZN followed by WITS (five times). MaK would benefit from espousing the input-output mix characteristics of WITS by 45.4% and UKZN, 54.6% to become teaching efficient. UoM has to emulate the input-output mix characteristics of the UKZN by 33.6%, UCT by 26.7% and WITS by 39.7% to become teaching efficient.
5.3 The preferred Research-Only Model
The preferred research-only model, Model 9 is built up from Model 8 and input variable non-teaching staff is dropped hence doctoral enrolments and teaching staff with Doctorates are combined with total doctoral graduation numbers and total ISI Papers to estimate the research efficiency of African public universities. The number of efficient universities remained nine and weakly efficient universities remained five. The mean efficiency score increased from 0.899 to 0.971 implying that non-teaching staff did not play a direct role to research efficiency of the African public universities. The university specific technical and scale efficiency scores for the preferred research-only model, Model 9 are presented in Table 8.
Table 8: Technical and Scale Efficiency Scores for the Preferred Research-Only Model
DMUs CRS Efficiency Technical VRS Efficiency Technical Scale Efficiency Scale Level
1. MaK 0.608 1.000 0.608 IRS 2. UoM 0.628 1.000 0.628 IRS 3. UG 0.596 0.845 0.706 IRS 4. UB 0.856 0.980 0.874 IRS 5. UNOBI 1.000 1.000 1.000 MPSS 6. UDSM 1.000 1.000 1.000 MPSS 7. NMMU 1.000 1.000 1.000 MPSS 8. UKZN 1.000 1.000 1.000 MPSS 9. UWC 0.831 1.000 0.831 IRS 10. UFS 1.000 1.000 1.000 MPSS 11. WITS 0.752 0.965 0.779 IRS 12. UL 0.677 0.930 0.728 IRS 13. RU 0.738 0.922 0.801 IRS 14. UFH 0.585 0.930 0.630 IRS 15. UCT 1.000 1.000 1.000 MPSS = 1 6 9 6 < 1 9 6 9 Maximum Efficiency 1.000 1.000 1.000 Minimum Efficiency 0.585 0.845 0.608
DMUs Peer Count Peers Peer Weights
1. MaK 0 11 8 0.454 0.546 2. UoM 0 8 15 11 0.336 0.267 0.397 3. UG 0 13 8 11 0.097 0.512 0.397 4. UB 0 8 11 0.748 0.252 5. UNOBI 0 8 6 15 0.318 0.518 0.164 6. UDSM 2 6 1.000 7. NMMU 0 6 8 13 0.529 0.387 0.084 8. UKZN 6 8 1.000 9. UWC 3 9 1.000 10. UFS 0 9 1.000 11. WITS 5 11 1.000 12. UL 0 15 9 11 0.036 0.012 0.952 13. RU 2 13 1.000 14. UFH 0 9 15 0.426 0.574 15. UCT 4 15 1.000
UDSM, UWC, MaK, UoM, UNOBI, UKZN, UFS, NMMU and UCT were fully efficient under the VRS potion and hence operated on the efficient frontier. UKZN, UDSM, UNOBI, NMMU, UFS and UCT were scale efficient, operated in the MPSS region and any alterations to their sizes would make them less efficient. The rest of the universities operated in the IRS region and hence research outputs would increase through increased enrolment of doctoral students and employment of additional teaching staff with doctorates. The Peers and peer weights of the preferred Research-Only Model are presented in Table 9.
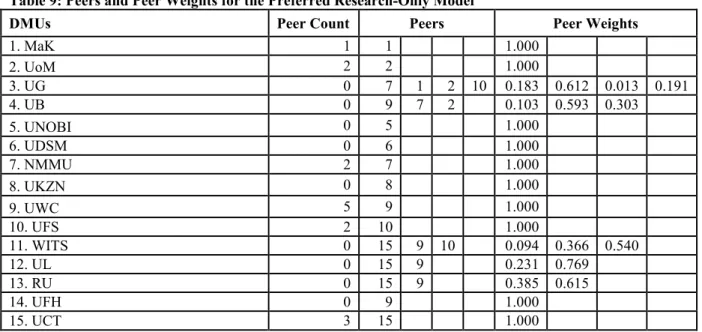
Table 9: Peers and Peer Weights for the Preferred Research-Only Model
DMUs Peer Count Peers Peer Weights
1. MaK 1 1 1.000 2. UoM 2 2 1.000 3. UG 0 7 1 2 10 0.183 0.612 0.013 0.191 4. UB 0 9 7 2 0.103 0.593 0.303 5. UNOBI 0 5 1.000 6. UDSM 0 6 1.000 7. NMMU 2 7 1.000 8. UKZN 0 8 1.000 9. UWC 5 9 1.000 10. UFS 2 10 1.000 11. WITS 0 15 9 10 0.094 0.366 0.540 12. UL 0 15 9 0.231 0.769 13. RU 0 15 9 0.385 0.615 14. UFH 0 9 1.000 15. UCT 3 15 1.000
UWC was the most (five times) referent research efficient university followed by the UCT (three times). UCT and UWC were the efficient peers for RU. RU would emulate 61.5% and 38.5% of the input-output mix characteristics of the UCT and UWC, respectively to become research efficient. The input-output mixes of RU are therefore more comparable to UCT than to UWC.
5.4 The Adjusted Preferred General Model
The university specific technical and scale efficiency scores for Cluster A and Cluster B universities of the adjusted preferred general model, Model 5 are presented in Table 10.
Table 10: Technical and Scale Efficiency Scores for the adjusted Preferred General Model
DMUs CRS Technical Efficiency VRS Technical Efficiency Scale Efficiency Scale Level
Cluster A Universities 1. MaK 0.694 1.000 0.694 IRS 2. UoM 0.501 0.953 0.526 IRS 3. UB 0.669 0.957 0.699 IRS 4. UDSM 0.846 0.968 0.874 IRS 5. WITS 0.844 1.000 0.844 IRS 6. UL 0.959 1.000 0.959 1RS 7. RU 0.929 0.978 0.949 IRS 8. UCT 1.000 1.000 1.000 MPSS Mean 0.805 0.982 0.818 Cluster B Universities 1. UG 1.000 1.000 1.000 MPSS 2. UNOBI 0.844 0.927 0.910 IRS 3. NMMU 0.891 0.895 0.995 IRS 4. UKZN 0.818 0.962 0.850 IRS 5. UWC 0.872 0.875 0.997 IRS 6. UFS 0.979 1.000 0.979 DRS 7. UFH 1.000 1.000 1.000 MPSS Mean 0.915 0.951 0.961
In Cluster A; MaK, UWC, UL and UCT formed the Efficiency Reference Set. UCT was scale efficient, operated at the Most Productive Scale Size and hence it is not advisable to alter its input-output mixes otherwise
it would become inefficient. MaK and UL became technically efficient and technical efficiency scores of the UB, UDSM and RU improved significantly after adjusting for the operating environment. Apart from UCT (MPSS), the rest of the universities operated in the IRS region and hence were small in their teaching and research functions. In Cluster B, UG, UFS and UFH formed the Efficiency Reference Set. UG and UFH were scale efficient and operated in the MPSS region. The technical efficiency score for UNOBI improved while those for NMMU, UKZN and UWC declined after clustering the universities. Apart from the UFH (MPSS) and the UFS (DRS), the rest of the universities in Cluster B were small in their operations. The peers and peers weights for the adjusted preferred general model, Model 5 are presented in Table 11.
Table 11: Peers and Peer Weights for the adjusted Preferred General Model
DMUs Peer Count Peers Peer Weights
Cluster A Universities 1. MaK 5 1 1.000 2. UoM 0 5 1 0.423 0.577 3. UB 0 5 1 0.418 0.582 4. UDSM 0 8 1 5 0.487 0.434 0.078 5. WITS 4 5 1.000 6. UL 0 8 1 5 0.760 0.040 0.200 7. RU 0 8 1 0.792 0.208 8. UCT 3 8 1.000 Cluster B Universities 1. UG 4 1 1.000 2. UNOBI 0 1 1.000 3. NMMU 0 7 1 0.049 0.951 4. UKZN 0 7 1 11 0.202 0.798 5. UWC 0 7 1 0.448 0.552 6. UFS 0 6 1.000 7. UFH 3 7 1.000
In Cluster A; MaK is the most (five times) referent universities followed by WITS (four times) and UCT (three times). The UCT by 48.7%, MaK by 43.4% and WITS by 7.8% are referent to the UDSM. After adjusting for the operating environment, the WITS remained referent to the UDSM by 48.7% and UL by 20% while the UCT remained referent to UL, 75.9% and RU by 79.2%. In Cluster B, the most (four times) benchmarked against university was the UKZN followed by UFH (three times). NMMU had to benchmark against UFH by 4.9% and UG by 95.1% to become technically efficient. UWC had to benchmark against UFH up to 44.8% and UG, 55.2% to become technically efficient.
5.5 The Adjusted preferred Teaching-Only Model
In Cluster A; MaK, UoM, UDSM, WITS, UL and UCT were fully efficient in the teaching function under the VRS option. UCT and UL were scale efficient and hence operated in the MPSS region but the rest of the universities displayed IRS implying that they have to increase their graduation numbers to become teaching efficient. The technical and scale efficiency scores for adjusted preferred teaching-only model are presented in
Table 12: Technical and Scale Efficiency Scores of the adjusted Preferred Teaching-Only Model
DMUs CRS Technical Efficiency VRS Technical Efficiency Scale Efficiency Scale Level
Cluster A Universities 1. MaK 0.708 1.000 0.708 IRS 2. UoM 0.617 1.000 0.617 IRS 3. UB 0.722 0.999 0.722 IRS 4. UDSM 0.851 1.000 0.851 IRS 5. WITS 0.943 1.000 0.943 IRS 6. UL 1.000 1.000 1.000 MPSS 7. RU 0.965 0.994 0.971 IRS 8. UCT 1.000 1.000 1.000 MPSS Mean 0.851 0.999 0.851 Cluster B Universities 1. UG 1.000 1.000 1.000 MPSS 2. UNOBI 0.815 1.000 0.815 IRS 3. NMMU 0.786 1.000 0.786 IRS 4. UKZN 0.890 0.900 0.989 IRS 5. UWC 0.842 0.854 0.986 IRS 6. UFS 0.934 0.959 0.973 IRS 7. UFH 1.000 1.000 1.000 MPSS Mean 0.895 0.959 0.936
In Cluster B, after adjusting for the operating environment, teaching efficient scores for UKZN, UFS and UWC declined. UG and UFH operated in the MPSS region but the rest of the universities displayed IRS and hence would become teaching efficient by increasing their undergraduate and postgraduate graduation numbers. The peer and peer weights for the adjusted preferred teaching-only model, Model 7 are presented in Table 13.
Table 13: Peers and Peer Weights for the Adjusted Preferred Teaching-Only Model
DMUs Peer Count Peers Peer Weights
Cluster A Universities 1. MaK 2 1 1.000 2. UoM 1 2 1.000 3. UB 0 5 2 1 0.533 0.063 0.403 4. UDSM 0 4 1.000 5. WITS 1 5 1.000 6. UL 1 6 1.000 7. RU 0 6 1 8 0.792 0.113 0.095 8. UCT 1 8 1.000 Cluster B Universities 1. UG 3 1 1.000 2. UNOBI 0 2 1.000 3. NMMU 3 3 1.000 4. UKZN 0 1 7 3 0.747 0.200 0.053 5. UWC 0 1 7 3 0.483 0.445 0.072 6. UFS 0 1 7 3 0.144 0.714 0.143 7. UFH 3 7 1.000
In Cluster A, WITS remained an efficient peer to UB even after adjusting for the operating environment. UL by 79.2 %, MaK by 11.3% and UCT by, 9.5% were efficient peers to RU. In Cluster B, UG, UFH and NMMU were jointly efficient peers to UKZN, UWC and UFS. UFS had to benchmark against UG by 14.4%, UFH, 71.4% and NMMU by 14.3% to become teaching efficient.
5.6 The Adjusted Preferred Research-Only Model
The technical and scale efficiency scores for the adjusted preferred research-only model are presented in Table 14.
Table 14: Technical and Scale Efficiency Scores for the Adjusted Research-Only Model
DMUs CRS Technical Efficiency VRS Technical Efficiency Scale Efficiency Scale Level
Cluster A Universities 1. MaK 0.608 1.000 0.608 IRS 2. UoM 0.628 1.000 0.628 IRS 3. UB 0.596 0.947 0.629 IRS 4. UDSM 0.856 1.000 0.856 IRS 5. WITS 1.000 1.000 1.000 MPSS 6. UL 1.000 1.000 1.000 MPSS 7. RU 1.000 1.000 1.000 MPSS 8. UCT 1.000 1.000 1.000 MPSS Mean 0.836 0.993 0.840 Cluster B Universities 1. UG 1.000 1.000 1.000 MPSS 2. UNOBI 0.883 1.000 0.883 IRS 3. NMMU 1.000 1.000 1.000 MPSS 4. UKZN 0.665 0.850 0.782 IRS 5. UWC 0.777 0.798 0.974 IRS 6. UFS 1.000 1.000 1.000 MPSS 7. UFH 0.919 0.926 0.992 IRS Mean 0.892 0.939 0.947
In Cluster A; WITS, UL, RU and UCT were research efficient and operated in the MPSS region but the rest of the universities displayed IRS. They would become research efficient by scaling up their publications and doctoral graduation numbers. The research efficiency score for UB, however, improved after adjusting for the operating environment. In Cluster B, UG, NMMU and UFS were research efficient and operated at the MPSS but the rest of the universities operated in the IRS region and could only become research efficient by increasing their ISI Paper publications and doctoral graduation numbers. The peers and peer weights for the adjusted preferred research-only model are presented in Table 15. In Cluster A, UoM and WITS were jointly the efficient peers to UB. In Cluster B, NMMU was the most referent university and was a peer to UWC, UKZN and UFH.
Table 15: Peers and Peer Weights for the Adjusted Preferred Research-Only Model
DMUs Peer Count Peers Peer Weights
Cluster A Universities 1. MaK 0 1 2. UoM 1 2 3. UB 0 2 5 0.909 0.091 4. UDSM 0 4 5. WITS 1 5 1.000 6. UL 0 6 1.000 7. RU 0 7 1.000 8. UCT 0 8 1.000 Cluster B Universities 1. UG 1 1 1.000 2. UNOBI 1 2 1.000 3. NMMU 3 3 1.000 4. UKZN 0 3 2 0.407 0.593 5. UWC 0 3 1 0.600 0.400 6. UFS 1 6 1.000 7. UFH 0 6 3 0.500 0.500 6. Conclusions
There were considerable differences in teaching and research relative efficiency between African public universities. South African universities were relatively more efficient than non-South Africa public universities probably because South Africa has: a high concentration of mature, relatively more resourced and highly competitive universities compared to other African countries. This affirms the assertion that competition stimulates the efficiency of higher education institutions. Universities outside South Africa need to increase doctoral enrolments and staff with doctorates in order to increase their research efficiency and optimize their
teaching input-output mixes to become teaching efficient.
The African public universities were relatively efficient in their teaching and research functions when analyzed separately. The universities were, however, more efficient in their research function than in their teaching function. The universities could increase the number of graduates by 10% and their research outputs by 3.8% using the same inputs over the sample period. There was therefore theoretical waste of inputs by the selected African public universities. The inefficient universities, however, on average utilized 2.9% to 11.4% more inputs than the efficient universities. The returns to scale efficiency scores, however, indicate that some of the universities enjoyed benefits of expansion while others had reached their optimal sizes and were experiencing decreasing returns to scale in their teaching and research functions.
The operating environment plays a vital role in determining the relative efficiency of African Public universities. After adjusting for the operating environment for the general model, Makerere University and University of Limpopo became technically efficient. The efficiency scores of the University of Botswana, University of Dar es Salaam, University of Nairobi and Rhodes University significantly improved those of University of the Free State, University of Western Cape and University of Kwa Zulu Natal declined.
Cross-country university studies are faced with the problem of obtaining comparable data between the different countries that eventually affects and limits the scope of investigations. Country and regional specifics were not considered because only one Flagship University was considered for countries outside the Republic of South Africa making difficult to satisfy the DEA sample size requirements. In addition the cost function and knowledge-transfer-only models of the universities were not estimated due to incomplete data sets hence future researchers could explore addressing the above study limitations.
References
Abbott, M., & Doucouliagos, C. (2003). The efficiency of Australian Universities: A Data Envelopment Analysis; Economics of Education Review, 22 (2003): 89-97.
Al-Bagoury, (2013). DEA to evaluate efficiency of African higher education. Wyno Academic Journal of Educational Research and Essays, 1 (4):39-46.
Agasisti, T., & Johnes, G.(2009). Beyond frontiers: comparing the efficiency of higher education decision making units across more than one country. Education Economics, 17(1): 59-79.
Avkiran, N.K. (2001). Investigating technical and scale of Australian universities through data envelopment analysis. Socio-Economic Planning Sciences, 35(1): 57-80.
Banker, R.D., Charnes, A., & Cooper, W.W. (1984). Some models for estimating technical and scale inefficiencies in data envelopment analysis. Management Sciences, 30 (9): 1078-1092.
Bolli, T., & Olivares, M. (2011). The differential effect of competitive university funding on production frontier and efficiency. http://dx.doi.org/10.5167/uzh.54676.
Boshof, N. (2010). Cross-national higher education performance indicators: ISI publication output figures for 16 selected African universities. Paper prepared for the Higher Education Research and Advocacy Network in Africa (HERANA).
Carrington, R., Coelli, T., & Rao, D.S.P. (2005). The Performance of Australian universities: Conceptual issue and preliminary results. Economic Papers, 24 (2):145-63.
Charnes, A., Cooper, W.W., & Li, S.L. (1989). Using data envelopment analysis to evaluate efficiency in the economic-performance of Chinese Cities. Socio-Economic Plan Sciences 23(6):325-344.
Charnes, A., Cooper, W.W., & Rhodes, E.L. (1978).Measuring the efficiency of decision making units. European Journal of Operational Research, 2(6):429-444.
CHET (2013). Higher level knowledge production: CHET data profiles of four universities.
Colbert, A., Levary, R.R., & Shaner, M. (2000). Determining the relative efficiency of MBA programs using DEA. European Journal of Operation Research, 125(10): 656-699.
Cloete, N., Bailey, T., Pillay, P., Bunting, I., & Maassen, P. (2012). Universities and economic development in Africa
Coelli, T (1996a). A guide to DEAP Version 2.1: A Data Envelopment Analysis (Computer) Program. CEPA Working Paper 96/08. University of New England, Australia.
Coelli, T. (1996b). Assessing the performance of Australian universities using data envelopment analysis; Internal report, Center for Efficiency and Productivity Analysis; University of New England.
Coelli, T.J., Rao, D.S.P., O’Donell, C.J., & Battesse, G.E.(2005). An introduction to efficiency and productivity analysis, Springer, Second Edition.
Cooper, W.W., Seiford, L. M., & Tone, K. (2000). Data Envelopment Analysis. Boston: Kluwer Academic Publishers.
Cunha, M., & Rocha, V. (2012). On the efficiency of public higher education institutions in Portugal: An exploratory study. FEP Working Papers, 468, September.
Working Paper Series, 245:1-23. Centre for Excellency for Science and Innovation Studies (CESIS). Debreu, G. (1951). The coefficient of resource utilization; Econometrica, 19(3): 273-292.
Farrell, M.J. (1957). The measurement of productivity efficiency. Journal of Royal Statistical Society AJ20 (3):253-290.
Fandel, G. (2007). On the performance of universities in North Rhine-Westphalia, Germany: Government’s redistribution of funds judged using DEA efficiency measures. European Journal of Operational Research, 76(1):521-533.
Flegg A.T., Allen, D., Field, K., & Thurlow, T.W. (2003). Measuring the Efficiency and Productivity of British Universities; An Application of DEA and the Malmquist Approach. Oxford Economic Paper ec17/90, Department of Economics, University of Lancaster.
Izadi, H., Johnes, G., Oskrochi, R., & Crouchley, R. (2002). Stochastic frontier estimation of CES cost function: the case of higher education in Britain. Economics of Education Review, 21(1):63-71.
Jill,J., Marias,P., & Emmanuel, T. (2017). Efficiency in Education. Journal of the Operational Research Society: 684:4,331-338. DOI: 10:1057/s41274-016-0109-Z
Johnes, J. (2006a). Data envelopment analysis and its application to the measurement of efficiency in higher education. Economics of Education Review, 25 (3):273-288.
Johnes, J. (2006b). Measuring teaching efficiency in higher education: An application of data envelopment analysis to economics graduates from UK Universities. European Journal of Operational Research, 174:443-456.
Kempkes, G., & Pohl, C. (2010). The Efficiency of German Universities–Some Evidence from non-parametric and parametric models; Ifo Working Paper, 36(1). CESifo Economic Studies.
Key, N., McBride, W., & Mosheim, R. (2008). Decomposition of total factor productivity change in the U.S. Hog Industry. Journal of Agricultural and Applied Economics, 40(10):137-149.
Kipesha, F.E., & Msigwa, R. (2013), Efficiency of higher learning institutions: Evidences from public universities in Tanzania. Journal of Education and Practice, 4(7): 63-72.
Koopmans, T.C. (1951). Analysis of production as an efficient combination of activities, in T.C Koopmans, eds. Activity Analysis of production and allocation, Wiley, New York.
Lee, L.B. (2011). Efficiency of research performance of Australian universities: A reappraisal using a bootstrap truncated regression approach. Economic Analysis and Policy, 41(3): 195-203
Pastor, J.T., Ruiz, J.L., & Servent, I. (2001). A statistical test for nested radial DEA models. Operations Research, 50(4): 728-735.
Ramanathan, R. (2003). An introduction to data envelopment analysis: A tool for performance measurement. Sage Publications Ltd 6 Benhill Street. London EC2A4PU.
Ramirez-Correa, P., Pena-Vinces, J.C., & Alfaro-Perez, J. (2012). Evaluating the efficiency of higher education system in emerging economies: Empirical evidences from Chilean Universities. African Journal of Business Management 6(4):1441-1448.
Smith, P.C., & Street, A. (2006). Analysis of secondary school efficiency. Research Report 788.
Taylor, B., & Harris, G. (2002). The efficiency of South African universities: A study based on analytical review technique. South African Journal of Higher Education, 16 (2):183-192.
Taylor, B., & Harris, G. (2004). Relative efficiency among South African universities: A data envelopment analysis: Higher Education, 47 (1):73-89.
Tochkov, K., Nenovsky, N., & Techkov, K. (2012). University efficiency and public funding for higher education in Bulgaria. Post-Communist Economics, 24(4): 517-534.
Tammaso, A., (2012). Management of higher education institutions and the evaluation of their efficiency and Performance.Tertiary Education and Management,23:3,187-90. OI:10.1080/13583883.2017.1336250. Wolszczak-Derlack, J., & Parteka, A. (2011). Efficiency of European public higher education institutions: A