econ
stor
www.econstor.eu
Der Open-Access-Publikationsserver der ZBW – Leibniz-Informationszentrum Wirtschaft
The Open Access Publication Server of the ZBW – Leibniz Information Centre for Economics
Nutzungsbedingungen:
Die ZBW räumt Ihnen als Nutzerin/Nutzer das unentgeltliche, räumlich unbeschränkte und zeitlich auf die Dauer des Schutzrechts beschränkte einfache Recht ein, das ausgewählte Werk im Rahmen der unter
→ http://www.econstor.eu/dspace/Nutzungsbedingungen nachzulesenden vollständigen Nutzungsbedingungen zu vervielfältigen, mit denen die Nutzerin/der Nutzer sich durch die erste Nutzung einverstanden erklärt.
Terms of use:
The ZBW grants you, the user, the non-exclusive right to use the selected work free of charge, territorially unrestricted and within the time limit of the term of the property rights according to the terms specified at
→ http://www.econstor.eu/dspace/Nutzungsbedingungen By the first use of the selected work the user agrees and declares to comply with these terms of use.
Kroencke, Tim Alexander; Schindler, Felix
Working Paper
Downside risk optimization in
securitized real estate markets
ZEW Discussion Papers, No. 10-034
Provided in cooperation with:
Zentrum für Europäische Wirtschaftsforschung (ZEW)
Suggested citation: Kroencke, Tim Alexander; Schindler, Felix (2010) : Downside risk optimization in securitized real estate markets, ZEW Discussion Papers, No. 10-034, http:// hdl.handle.net/10419/36378
Dis cus si on Paper No. 10-034
Downside Risk Optimization in
Securitized Real Estate Markets
Tim-Alexander Kroencke and Felix Schindler
Dis cus si on Paper No. 10-034
Downside Risk Optimization in
Securitized Real Estate Markets
Tim-Alexander Kroencke and Felix Schindler
Die Dis cus si on Pape rs die nen einer mög lichst schnel len Ver brei tung von neue ren For schungs arbei ten des ZEW. Die Bei trä ge lie gen in allei ni ger Ver ant wor tung
der Auto ren und stel len nicht not wen di ger wei se die Mei nung des ZEW dar.
Dis cus si on Papers are inten ded to make results of ZEW research prompt ly avai la ble to other eco no mists in order to encou ra ge dis cus si on and sug gesti ons for revi si ons. The aut hors are sole ly
respon si ble for the con tents which do not neces sa ri ly repre sent the opi ni on of the ZEW. Download this ZEW Discussion Paper from our ftp server:
Non-technical Summary
Theoretical and practical portfolio management has been affected by the Modern Portfolio Theory (MPT) suggested by Markowitz (1952) for almost 60 years. An almost innumerable amount of research on this topic has been conducted and the MPT is still one of the most popular frameworks in finance. However, even Markowitz (1959) himself criticized and mentioned that a framework based on semi-variance, semi-deviation, or other shortfall risk measures instead of variance and standard deviation is more suitable to incorporate investors’ risk perception and to take care of the asymmetry in return distributions. Nevertheless, it took some time until financial research began to focus on portfolio optimization in a downside risk (DR) framework in more detail. While in the meantime, existing literature has been growing in the context of common stock and bond portfolios, there is still very limited research conducted related to pure real estate portfolios.
In contrast to previous studies in the field of DR optimization in real estate portfolios, the theoretical / technical merit of the Estrada (2008) approach is given by the innovative concept of measuring co-downside movements and using a similar optimization procedure to that in the traditional mean-variance (MV) framework at the same time. To our knowledge, this approach is applied for the first time to portfolios of real estate assets. Furthermore, covering the eight largest securitized real estate markets around the world, the analysis is also the first applying the DR framework in a global context.
In addition to the theoretical merits of the DR framework, the empirical results further support the strength of the applied DR framework compared to the MV framework and provide several interesting and practical implications for investors in international securitized real estate markets. The conducted analysis documents in a comprehensive way that the DR approach suggested by Estrada (2008) has its merits when applying it to securitized real estate portfolio optimization problems. Furthermore, it is shown that portfolio weights differ substantially from MV optimization and the DR framework is superior in an out-of-sample analysis. Thus, the presented DR framework constitutes a useful contribution to investors facing practical portfolio optimization problems in securitized international real estate markets.
Das Wichtigste in Kürze
Seit 60 Jahren wird sowohl das theoretische als auch das praktische Portfoliomanagement durch die Moderne Portfolio Theorie (MPT) von Markowitz (1952) geprägt. Seither wurde eine Vielzahl an Untersuchungen zu diesem Thema angestoßen und die MPT stellt noch immer eines der meistgebrauchten Konzepte in der Finanzmarkttheorie dar. Allerdings betonte bereits Markowitz (1959) selbst, dass ein Konzept, welches Risiko basierend auf der Semi-Varianz, Semi-Standardabweichung, oder des Shortfall Risikos misst anstatt der Varianz und der Standardabweichung, besser geeignet ist, die Risiko-Wahrnehmung von Investoren adäquat abzubilden und dabei asymmetrische Renditeverteilungen zu berücksichtigen. Dennoch dauerte es einige Zeit, bis in der Finanzmarkttheorie Konzepte zur Portfolio Optimierung, die auf Downside Risk (DR) Ansätzen basieren, entwickelt wurden. Während es mittlerweile zahlreiche empirische Analysen und eine umfangreiche Literatur im Bereich von Aktien- und Anleihenportfolios in diesem Kontext gibt, finden sich bisher noch immer nur sehr wenige Untersuchungen in Bezug auf reine Immobilienportfolios.
Im Unterschied zu den wenigen bisherigen Studien zur DR-Optimierung von Immobilienportfolios stellt der Ansatz von Estrada (2008) eine innovative Herangehensweise dar, Gleichläufe bei Renditen unterhalb eines bestimmten Renditeziels zu messen und dabei einen vergleichbaren Optimierungsprozess wie beim traditionellen Mittelwert-Varianz (MV) Ansatz zu verfolgen. Unseres Wissens wird dieser DR-Ansatz in der vorliegenden Studie erstmals für Immobilienportfolios und – durch die Betrachtung der acht weltweit größten verbrieften Immobilienmärkte – in einem globalen Kontext getestet.
Zusätzlich zu den theoretischen Vorzügen des DR-Konzepts unterstützen die empirischen Ergebnisse die Anwendung des DR-Konzepts gegenüber dem MV-Konzept. Darüber hinaus bringen die empirischen Befunde einige interessante und praktische Implikationen für Investoren in internationale verbriefte Immobilienmärkte mit sich. Es zeigt sich, dass sich die Portfoliogewichte beider Konzepte substantiell von einander unterscheiden, und sich der DR-Ansatz in einer Out-of-Sample-Analyse als vorteilhaft erweist. Folglich leistet der präsentierte DR-Ansatz einen nützlichen Beitrag für Investoren, die sich mit dem praktischen Portfoliomanagement im Bereich der internationalen verbrieften Immobilienmärkte konfrontiert sehen.
Downside Risk Optimization in Securitized
Real Estate Markets
Tim-Alexander Kroencke* and Felix Schindler† May 2010
Abstract
Optimization of international securitized real estate portfolios has been a key topic for several decades. However, most previous analysis has focused on regional diversification by applying the traditional mean-variance (MV) framework suggested by Markowitz (1952) even if the limitations of this approach are well-known. Thus, we focus on a more suitable and appealing downside risk (DR) framework suggested by Estrada (2008), which applies a similar optimization algorithm as the MV framework. The analysis covers the eight largest securitized real estate markets from January 1990 to December 2009 and thus captures a more global perspective. The main findings are as follows: first, the return distributions are non-normally distributed and negatively skewed. Second, optimal portfolio weights differ substantially between the MV and DR approach. Third, portfolio weights are shifted from the U.S. and Australian market to the Dutch and the French market when applying the DR framework instead of the MV framework. Fourth, the dominance of the DR framework is well-documented by comparing out-of-sample performance. The empirical results are remarkable and emphasize the practical merit of the presented DR framework for investors and portfolio managers.
Keywords: Downside Risk Analysis; International Real Estate Markets; Portfolio
Management; Portfolio Optimization; Out-of-Sample Analysis
JEL Classifications: C61; G11; G15
* Centre for European Economic Research (ZEW), P.O. Box 10 34 43, D-68034 Mannheim, Germany; Phone:
+49-621-1235-370; Fax: +49-621-1235-223; E-mail: kroencke@zew.de
† Corresponding author, Centre for European Economic Research (ZEW), P.O. Box 10 34 43, D-68034
Mannheim, Germany; Phone: +49-621-1235-378; Fax: +49-621-1235-223; E-mail: schindler@zew.de. We thank Peter Westerheide for valuable comments and suggestions.
1 Introduction and Motivation
The current, still continuing, financial crisis and its contagion effects across almost all asset markets as well as national financial markets impressively illustrate that returns are not normally distributed and correlations are time-varying and increase strongly during downward moving market phases when diversification is most needed by investors. Furthermore, among others, these characteristics of asset returns are calling into question the relevance of the traditional mean-variance (MV) optimization suggested by Markowitz (1952) when considering optimal portfolio allocation and investors with different investment objectives and preferences which are not represented by quadratic utility functions. Thus, alternative concepts of risk and portfolio optimization, typifying more closely the concerns of investors and thus possibly more suitable for them, have been established. This study presents a relatively novel downside risk (DR) framework and its application to international securitized real estate stock markets.
While international diversification has been thoroughly analyzed for common stock and bond markets for almost 60 years in a large amount of research, the benefits from international diversification are analyzed in far less detail for securitized real estate markets. Existing studies mainly focus on correlation analysis and the conclusions are mainly drawn from traditional MV optimization. However, it is also well-documented in the relevant literature that portfolios consisting of both common stocks as well as mixed assets (e.g. Brounen and Eichholtz (2003), Kaplanis (1988), Longin and Solnik (1995, 2001)) and pure real estate securities (e.g. Eichholtz (1996), Newell and Acheampong (2001), Conover et al. (2002), Liow (2008), Schindler (2009), Srivatsa et al. (2010)) do not satisfy the assumptions of the portfolio optimization framework suggested by Markowitz (1952) since the returns are usually not normally distributed and are (negatively) skewed. Furthermore, it is also well documented and empirically shown in economic and psychological literature that variance is not consistent with investors’ perception of risk. In fact, investors consider return dispersion asymmetrically and they are more sensitive to losses than to gains of the same size related to their target rate or benchmark return. Thus, MV optimization is not sufficient to analyze investors’ gains from diversification and to take portfolio allocation decisions. MV analysis is related to quadratic utility functions, and such investors’ preferences would imply increasing absolute risk aversion. However, the results from several studies suggest that investors’ risk perception is asymmetric and that decreasing absolute risk aversion (DARA) utility functions
are more realistic. Both facts can be better incorporated in a DR framework than in the MPT framework. This fact is already discussed in Markowitz (1952). He emphasizes that a DR framework is more suitable than an MV framework. The MV framework is only favored due to computational limitations at this time.
However, the well-known characteristics and investors’ risk perceptions leave researchers looking for further concepts of analyzing diversification benefits which better fit with empirical return distributions and investors’ risk perception. The well-known DR framework, which is frequently used in this kind of analysis, is based on a more satisfactory choice-theoretic foundation and allows for explicitly considering co-movements and risk when returns are below a given threshold level. Furthermore, and from a theoretical point of view, in contrast to variance as a risk measure, the concept of DR has theoretically more profound support while there is no theoretical support for variance as the “right” risk measure (e.g. Hogan and Warren (1974), Bawa (1975), Price et al. (1982)). The concept of DR measures, such as lower partial moments (LPMs), is appealing because it covers a much broader range of individuals’ utility functions than the traditional MV framework.
While this approach is applied in several studies with respect to stock market portfolios, there is only a limited number of studies focusing on real estate stock markets and – to our knowledge – there has been no research on pure international real estate portfolios. However, it is worthwhile to treat the topic of DR measures to securitized real estate markets due to the characteristics of real estate returns and investors’ risk perception. This study thus analyzes DR, mainly based on LPMs, its implication for risk diversification in a real estate portfolio, and presents the optimal asset allocation and its differences to MV optimization. Furthermore, an out-of-sample analysis is conducted to evaluate the forecast quality of both frameworks.
As already mentioned by Cheng and Wolverton (2001) among others, a sufficient comparison between modern portfolio theory (MPT) and DR-efficient portfolios as well as a statistical test on significant differences are not straightforward and require a common risk measure. Otherwise, the portfolio efficiency dominance heavily depends on the risk measure used. However, a comparison between MPT and DR-efficient portfolios for a certain return level allows for pointing out the size of the difference between portfolio optimization conducted by the MPT framework and portfolio optimization conducted by the DR framework. This approach is more appropriate with respect to investors’ individual preferences, e.g. those of a DR-averse investor.
As already mentioned, there is no study seizing this topic in the context of international real estate stock markets, although Cheng and Wolverton (2001, p. 130) explicitly emphasize that “the theoretical appeal of downside risk and its potential applicability to portfolio diversification merits additional study”. The key questions are: What are the implications and failures if by mistake the MPT is used instead of the DR framework for investors with preferences which are not considered appropriately by the MPT framework, and which framework has superior out-of-sample performance?
Therefore, the main objectives of this study are (1) to present the DR framework of Estrada (2008) and its merits, (2) to apply the DR framework to the eight largest, highest capitalized and most developed real estate stock markets across the world with different threshold levels investors might be interested in, (3) to compare the results based on the DR framework and MV optimization, and (4), most importantly, for practical relevance, to provide some implications for real estate portfolio optimization and management by evaluating the forecast quality of both frameworks based on an out-of-sample analysis during a period with high volatility and financial market turmoil (2005-2009).
The remainder of this paper is organized as follows. The next section provides a brief review of relevant literature. Section 3 discusses the applied DR framework and its modifications. After data description and descriptive statistics in section 4, empirical results of the portfolio optimization approaches and their implications are presented in section 5. Section 6 summarizes the key findings, draws some concluding remarks, and gives an outlook for further research.
2 Literature
Review
Both theoretical and empirical discussion on the suitability and appropriate application of MV analysis as well as of DR framework has resulted in a vast amount of research over the last decades. An overall review of all these studies would be beyond the scope of this paper. Thus, we refer to the study “A Brief History of Downside Risk Measures” conducted by Nawrocki (1999) which provides a discussion on DR measures and summarizes some main empirical results from relevant literature. However, the controversial discussions mainly focus on the analysis of stock and bond markets and only to a much lesser extent on (international securitized) real estate markets.
The concept of portfolio optimization related to DR instead of the traditional MV optimization is introduced to the field of real estate research by Sivitanides (1998) and Sing and Ong (2000). The first study conducted by Sivitanides (1998) analyzes the return to a DR profile of portfolios based on the four NCREIF data series for office, retail, R&D, and warehouse direct real estate investments in the U.S. from 1979 to 1997. The latter examines mixed asset portfolio allocations containing stocks, bonds, and direct real estate in Singapore for the period from 1983 to 1997. Both studies focus on the comparison between portfolios realized by the MV or DR framework, and find significant differences in the ideal allocations investors should hold depending on their risk perception. These findings are confirmed by Cheng (2001). Analyzing and comparing traditional MV analysis and DR analysis in the context of a U.S. mixed asset portfolio for a time period from 1970 to 1998, Cheng (2001, p. 225) concludes “that portfolios formed with DR approach have certain desirable properties unavailable to MV portfolios.”
Aside from some miscalculation issues in Sing and Ong (2000), Cheng and Wolverton (2001) mention the difficulties in drawing comparisons between these two concepts. Lacking a common risk measure, it is not possible to argue that one concept leads to superior portfolios compared to the other concept. In a DR optimization framework, the DR optimized portfolios will by definition dominate all other portfolios (including the MV-efficient portfolios) and vice versa. However, it is perfectly valid to formulate the question, given someone’s preferences (for which the application of the DR framework is more suitable), of how much an investor loses by optimizing the portfolio variance and what the out-of-sample forecast qualities of both concepts are like.
Maurer and Reiner (2002) examine the DR diversification benefits for mixed asset portfolios, considering international indirect real estate in France, Germany, Switzerland, the U.K., and the U.S. from 1985 to 2001. They find significant diversification benefits from the perspective of a German and a U.S. investor, especially for lower-risk portfolios. This study is the unique analysis that covers more than one national market, but it is limited to direct real estate and still only focuses on five national markets.
This is surprising for at least two reasons. First, it is well-known from finance literature and documented by numerous empirical analyses that augmenting the geographical perspective results in larger benefits from diversification. Second, Schindler (2009), amongst others, impressively shows that co-movements between national securitized real estate markets depends on phases of up- and downward moving markets and – even more relevant – that
MV-efficient portfolios and almost MV-efficient portfolios, in particular, are non-normally distributed which is also emphasized by Srivatsa et al. (2010). These findings further question the application of MV optimization. In addition to further securitized real estate markets, Schindler (2009) considers the same markets as we do in the following analysis.
However, to our knowledge, no study evaluates the benefits from diversification of international securitized real estate portfolios in a DR framework on a grand scale. Thus, the aim of our analysis is to narrow this research gap and to provide further insight into the DR of securitized real estate portfolios.
3 Methodology
In the methodological part, we briefly describe the theoretical concept of DR based on LPMs and discuss different types of Co-LPMs from a technical perspective before we present the applied portfolio optimization algorithm and the novel approach suggested by Estrada (2008). 3.1 The Concept of Downside Risk and Downside Risk Measures
The concept of DR is as old as MPT, and semi-variance as one DR measure is found to be a more robust measure of risk from a theoretical perspective, but the variance instead of semi-variance as risk measure is chosen by Markowitz (1959) for technical reasons and computational limitations. Markowitz (1959) mentions that investors’ risk perception might be asymmetric. However, it was not until the 1970s that the semi-variance measure of risk, known as lower partial moment of order n (LPMn), was generalized by Bawa (1975) and Fishburn (1977). In particular, they show that LPM2 optimization is appropriate to produce portfolios that will dominate all other portfolios according to the concept of third order stochastic dominance, which implies an optimal decision rule for any investor who is risk-averse and exhibits decreasing absolute risk aversion. Harlow (1991, p. 29) states that DR “is an appropriate characterization of investment risk, because investors are often concerned about losses relative to a threshold level”. In defense of the MV approach it is sometimes mentioned that the DR concept does not account for greater “upside risk” like variance does. However, this argument can be refuted by taking into account that upside potential is not neglected in a DR framework but captured by the mean of the return distribution.
Lower Partial Moments
As mentioned above, all DR measures concentrate on the left-hand tail of the relevant return distribution. However, they differ in where the left-hand tail begins, meaning below which specific threshold level or target rate returns are relevant and how the deviations from this target rate are considered. For an empirical discrete distribution of security returns Ri, with T
observations of return of asset i and the target rate, , the LPMn is described as follows:
T 1 t n it i nT
Max
0
,
R
.
1
R
,
LPM
(1)The order n of the LPM characterizes investors’ risk perception and how return dispersions below the target rate affect the risk measure: the higher the value of n, the higher the penalty of dispersions below the target rate. Thus, the parameter n can also be considered a parameter for risk aversion increasing with n. In general, the main focus lies on the first four classes of LPMs which are the default risk (n = 0), the target shortfall (n = 1), the target semi-variance (n = 2), and the target skewness (n = 3). Higher LPM values indicate a higher degree of negative skewness and thus higher risk.
Co-Lower Partial Moments
When considering portfolio optimization in the context of the LPM framework, analogous to MPT, the co-movements of the LPMs of different securities i have to be taken into account as well. Harlow (1991) skips this part and immediately focuses on the LPM of a portfolio p. However, as pointed out by Sing and Ong (2000), the optimization framework of Harlow (1991) as well as Harlow and Rao (1989) is restrictive in cases where the LPMs of individual assets are highly correlated. By contrast, Nawrocki (1991) presents two theoretical optimal allocation algorithms for the n-degree portfolio LPM referred to as asymmetric LPM (ALPM) algorithm and symmetric LPM (SLPM) algorithm.
The Co-Lower Partial Moment (CLPM) between two securities i and j can be described by:
Max
0
,
R
R
.
T
1
R
,
R
,
CLPM
T 1 t jt 1 n it j i 1 n , ij
(2)First, following the ALPM algorithm, the n-degree portfolio p LPM for s securities is:
,
CLPM
w
w
LPM
s 1 i s 1 j i j ij,n 1 pn
(3)where:
CLPMij,n-1 = LPMin for i = j, (4)
CLPMij,n-1≠ LPMin for i ≠ j, (5)
n 1. (6)
Second, following the SLPM algorithm, the n-degree semi-deviation (SD) of asset i is calculated as follows:
Max
0
,
R
LPM
.
T
1
R
,
SD
ni 1n n 1 T 1 t n it i ni
(7) Based on the semi-deviation of two securities i and j (SDi and SDj) and the correlationcoefficient between the two securities, the symmetric Co-LPM (SCLPMij) is calculated in
the following manner:
.
SD
SD
SCLPM
ij
ij ni nj (8)The property of symmetry means that:
.
SCLPM
SCLPM
ij
ji (9)Thus, analogous to the symmetric covariance matrix in the MV framework, the SCLPM matrix is also symmetric and the critical line algorithm can be used for portfolio optimization. Afterwards, Nawrocki (1991) empirically tests the power and differences of the two approaches. According to his empirical results from applying both concepts, the ALPM algorithm as well as the SLPM algorithm, Nawrocki (1991, p. 470) concludes, that “because of its added complexity, the ALPM algorithm does not have the empirical support to recommend it. Since the SLPM algorithms provide portfolios that are members of the SSD (second-degree stochastic dominance)-efficient set when compared to the traditional covariance algorithm, the SLPM algorithms have to be considered a viable alternative to covariance analysis. The fact that SLPM analysis handles a broader range of investor utility function increases the attractiveness of the technique.“
However, the SLPM algorithm measures the co-movement between two assets by its correlation coefficient. This measure not only considers co-movements when returns are below mean but also upside co-movement. Furthermore, the correlation coefficient is based on the mean return of each asset while the mean is not necessarily the relevant measure in the
DR framework and even the semi-deviation is calculated based on a different target rate. Thus, the SLPM algorithm suffers from the discussed shortcomings as well, even if its application results in a symmetric matrix of co-movements. Estrada (2008) emphasizes these drawbacks as well and develops an alternative approach which does not limit measuring the co-movement based on mean returns as benchmark and nevertheless generates a symmetric and exogenous semi-covariance matrix. Estrada (2008) defines the semi-covariance between assets i and j with respect to a threshold level as:
Max
0
,
R
Max
0
,
R
.
T
1
R
,
R
,
CLPM
T 1 t it jt j i ij
(10)This theoretical approach is much closer to investors’ risk perception than the algorithms presented above and can “be used in the same way as the (symmetric and exogenous) covariance matrix is used in the solution of mean-variance problems” (Estrada, 2008, p. 59). Thus, the DR framework applied in this paper is based on the heuristic approach suggested by Estrada (2008) for two reasons. First, and in contrast to several further approaches, the measure of co-movement focuses only on the downside co-movement. Second, the semi-covariance is symmetric and exogenous, which allows for a similar optimization approach as in the traditional MV framework. This analogy is presented in section 3.2.
3.2 Portfolio Optimization Algorithms
In principle, the optimization problem is quite similar in the MV framework and the DR framework. The crucial question in both cases is which portfolio minimizes the associated risk given a certain return level. Thus, investors have to find the portfolio selection that minimizes the associated risk for a specific level of return. Consequently, the optimization problems are analogous. First, we describe the traditional MV framework according to Markowitz. Second, we transfer this approach to the DR framework and generalize the optimization problem.
Mean-Variance Optimization
In the MV framework suggested by Markowitz (1952, 1959), the efficient portfolios which constitute the efficient frontier are the upper bound of all feasible portfolios. They are characterized by the property that they dominate all other feasible portfolios. This means that there is no other feasible portfolio described by a lower risk level for a specific return level. Thus, the optimization problem is defined as:
Minimize s
w
w
,
1 i s 1 j i j ij 2 p
(11) subject to: a)R
sw
R
,
1 i i i p
b)w
1
,
s 1 i i
and c)w
i
0
,i
where:wi = weight of asset i in portfolio p,
p
R
= mean return of portfolio p,
i
R
= mean return of security i,2 p
= variance of portfolio p, andij
= covariance between the returns of asset i and asset j.This is the classical and well known portfolio optimization problem. The model is restricted to any short selling of securities. This constraint is imposed because short selling of real estate stock markets is limited and investors, such as fund managers, are often not allowed short selling by investment regulation laws.
Downside Risk Optimization
In general, the DR-averse investor is faced with the same optimization problem and the same constraints as the investor in the MV framework. Both types of investors minimize their risk exposure for a given level of return even if they differ in their understanding of risk, their preferences and their appropriate risk measure.
Following the approach suggested by Harlow (1991) and Harlow and Rao (1989), the unique difference to the Markowitz approach is that the n-degree LPM of the portfolio is minimized instead of the variance of the portfolio. Thus, this optimization problem is quite intuitive and seems plausible. However, there are two major limitations as mentioned by Sing and
Ong (2000). First, the characteristic properties of the downside distribution of the individual asset returns are neglected as long as the portfolio composed of the individual assets is downside efficient. Second, the model disregards the downside co-movement between individual asset returns.
Accounting for these two critical limitations, the approaches suggested by Nawrocki (1991) and Estrada (2008) in particular are more adequate and generalize Markowitz’s model, explicitly taking the co-movements into account. The co-movements are formally represented by the CLPM. Thus, according to Estrada (2008) the risk minimization (optimization) algorithm is stated as follows and is analogous to the MV algorithm:
Minimize
LPM
w
w
CLPM
,
R
,
R
,
s 1 i s 1 j j i ij j i p
(12) subject to: a)R
w
R
,
s 1 i i i p
b)w
1
,
s 1 i i
and c)w
i
0
.i
Furthermore, Estrada (2008) compares his approach of determining portfolios’ semi-variance to its exact counterpart as a robustness check and shows that the differences are rather small and even when there is a difference between the approximate semi-deviation and its exact counterpart, the direction of the error is predictable. Estrada (2008, p. 63) concludes that “whenever the approximation errs, it does so on the side of caution, overestimating (by a small amount) the risk of the portfolio.” Thus, the charm and strength of the approach rests on its simplicity and accuracy, or, in Estrada’s words, “The heuristic proposed is both simple and accurate. Estimating semi-covariances is just as easy as estimating covariances, and aggregating them into a portfolio semi-variance is, with the proposed heuristic, just as easy as aggregating covariances into a portfolio variance” (Estrada, 2008, p. 61).
The target rate depends on the investor’s risk perception. In the empirical part of this study, the DR-efficient portfolios will be calculated based on four different target rates and benchmarks, respectively. First, when at least the nominal preservation of capital is
considered an investment goal, DR occurs when portfolio returns are negative. Thus, the threshold level is a zero nominal return. Second, for comparison to a simple and naïve diversification strategy, the efficient portfolios are determined based on the mean return of an equally weighted securitized real estate portfolio as the target rate. Third, for investors perceiving risk when returns are below the risk-free rate, the benchmark is the U.S. Treasury bill rate with a maturity of three months. Fourth, when the investor is interested in real preservation of capital, the U.S. inflation rate measured by the consumer price index represents the target rate. The four mentioned and applied threshold levels are only a selection from a wide range of feasible reference points for investors and do not make a claim to be complete.
4 Data and Descriptive Statistics
The empirical analysis in this paper is based on the FTSE EPRA/NAREIT monthly total return indices between January 1990 and December 2009; the analyzed period is given by data availability. Thus, the time series contain 240 monthly data for each market. The study covers the eight largest and most developed real estate stock markets in the world: Australia (AUS), Hong Kong (HK), Japan (JAP), and Singapore (SIN) in the Asia-Pacific region, France (FRA), the Netherlands (NL), and the United Kingdom (U.K.) in Europe, and the U.S. (U.S.) as the representative of Northern America. Sample statistics are calculated based on continuously compounded returns and in US-dollars.
An overview of the return and risk characteristics of the eight national real estate stock market indices is presented in Table I. It shows that development status, number of listed property companies, and market capitalization vary between markets. As can be seen, the performance of the countries’ securitized real estate markets is very heterogeneous and differs substantially between national markets. While France, Hong Kong, and the U.S. have the highest average monthly return of more than 0.95 %, Japan (-0.10 %) and the U.K. (0.27 %) exhibit the lowest return. Apparently, the Asian securitized real estate stock market in Hong Kong and Singapore differ remarkably from the others – they exhibit the highest monthly standard deviations (above 10 %). Accordingly, their minimum and maximum monthly returns exhibit the broadest range of approximately plus/minus 45 %. This may reflect the fact that in these markets, securitized real estate is dominated by property developers and constructors, whose business is linked more tightly to the business cycle and
generates more uncertain cash flows (Serrano and Hoesli (2009), Newell and Chau (1996), and Liow (1997)). With less than 6 % or slightly above, the Australian, French, Dutch, and the U.S. markets bear the lowest standard deviation in the sample. With the exception of France, REITs or REIT-equivalent investment vehicles have been used for more than 25 years and thus, the markets are dominated by property companies where rental investments dominate, resulting in relatively stable cash flows over time and hence stock price risk. Due to their relatively high average return and low volatility, the securitized real estate markets in Australia, France, and the U.S. are characterized by the highest Sharpe ratio, while the Sharpe ratio is slightly negative for Japan and the U.K. However, considering skewness and kurtosis of the return distributions, the markets with the highest Sharpe ratio also have the highest negative skewness and excess kurtosis. This finding is statistically confirmed by the test suggested by Urzúa (1996) for skewness and kurtosis and by the Jarque-Bera test on normally distributed returns. Both test statistics reject the null hypothesis of no skewness and no excess kurtosis, respectively, as well as the null hypothesis of normality. For risk-averse investors concerned with negative skewness and excess kurtosis, the relatively high Sharpe ratio might not be appropriate for risk measurement, since it does not necessarily reflect the whole risk investors face, as shown in several studies. In general, all indices considered are characterized by statistically significant excess kurtosis and negative skewness with the exception of the Asian markets. However, the hypothesis of normally distributed returns is rejected for all markets at the 1 % level of significance which is in line with findings by Schindler (2010).
Table I: Descriptive Statistics for Monthly Returns of the National and Global EPRA Indices, the U.S. Inflation Rate, and the Federal Funds Rate
Index Mean Min. Max. S.D. Skewness (z-stat.) Kurtosis (z-stat.) J.-B. AUS 0.0075 -0.4537 0.1531 0.0598 -2.2435 (14.3674) 17.2676 (46.6270) 2,236.9810*** FRA 0.0095 -0.3332 0.1564 0.0573 -0.8260 (5.2894) 6.6334 (11.9346) 241.9707*** HK 0.0096 -0.4399 0.4506 0.1030 -0.0176 (0.1127) 5.7545 (9.0672) 75.8829*** JAP -0.0010 -0.3814 0.3171 0.0952 -0.0388 (0.2483) 4.1013 (3.6740) 12.1883*** NL 0.0055 -0.2831 0.1467 0.0488 -0.9086 (5.8185) 7.8896 (16.0327) 272.1010*** SIN 0.0040 -0.4193 0.5218 0.1149 -0.1396 (0.8943) 6.1476 (10.3496) 99.8513*** U.K. 0.0027 -0.3499 0.2573 0.0649 -0.8483 (5.4327) 7.5708 (14.9926) 237.7057*** U.S. 0.0096 -0.3886 0.2755 0.0612 -1.6685 (10.6851) 13.8040 (35.3275) 1,278.6250*** Global 0.0055 -0.3267 0.1878 0.0560 -1.1850 (7.5884) 8.5492 (18.1845) 364.0979*** Inflation Rate 0.0023 -0.0169 0.0137 0.0027 Risk-free Rate 0.0031 0.0000 0.0063 0.0015
Notes: Min. and Max. are the minimum and maximum monthly return. S.D. is the standard deviation of the return distribution of the national real estate stock indices. ***, ** and * indicate the rejection of the null hypothesis of the Jarque-Bera (1987) test statistic (J.-B.) for normality at the 1 %, 5 %, and 10 % level of significance. The test results of statistical significance from zero for skewness coefficients, and from three for the kurtosis coefficients, are reported in parentheses. The critical values for the coefficient test at 1 % , 5 % , and 10 % level of significance are 2.58, 1.96, and 1.65.
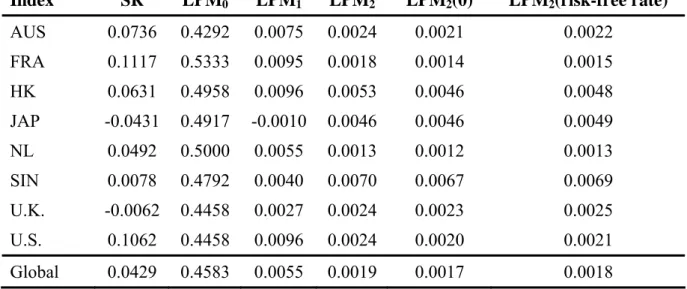
In comparison to standard deviation as the commonly used risk measure and in addition to the traditional Sharpe ratio (SR), Table II presents several further risk measures related to DR in particular. We calculated the Lower Partial Moments of order zero (default risk), one, and two. Furthermore, different reference points, namely mean, zero return, and the risk-free rate,
are considered in the analysis of influences by varying benchmarks and different types of risk-averse investors.
While the ranking of the individual markets according to their risk is quite consistent when applying standard deviation, LPMs of order two, and different benchmarks, the findings differ when comparing default risk and other risk measures. France and the Netherlands are characterized by the highest default risk even if they show the lowest risk measures in all other cases and relatively high Sharpe ratios. Furthermore, Australia and the U.S. perform well according to their Sharpe ratio and LPM of order zero but considering higher orders of downside risk, the French and Dutch securitized real estate market are less risky. This might be due to the high negatively skewed return distribution of the securitized real estate markets in Australia and the U.S. Since the Australian and U.S. securitized real estate markets seem to provide a good MV trade-off but relatively high DR, we expect the largest differences between optimal MV and DR portfolio weights for these two markets.
Additionally, up to this point, we have not considered (downside) co-movements between the securitized real estate markets and are not able to make any comment on how optimal portfolio allocation is influenced by risk measures different from volatility and variance, respectively.
Table II: Risk Measures for the Monthly Returns of the National and Global EPRA Indices
Index SR LPM0 LPM1 LPM2 LPM2(0) LPM2(risk-free rate)
AUS 0.0736 0.4292 0.0075 0.0024 0.0021 0.0022 FRA 0.1117 0.5333 0.0095 0.0018 0.0014 0.0015 HK 0.0631 0.4958 0.0096 0.0053 0.0046 0.0048 JAP -0.0431 0.4917 -0.0010 0.0046 0.0046 0.0049 NL 0.0492 0.5000 0.0055 0.0013 0.0012 0.0013 SIN 0.0078 0.4792 0.0040 0.0070 0.0067 0.0069 U.K. -0.0062 0.4458 0.0027 0.0024 0.0023 0.0025 U.S. 0.1062 0.4458 0.0096 0.0024 0.0020 0.0021 Global 0.0429 0.4583 0.0055 0.0019 0.0017 0.0018
5 Empirical
Results
The presentation of the empirical results from the analysis of benefits from diversification by the DR framework is divided into three parts. First, the MV and DR portfolios with their corresponding efficient frontiers are calculated with respect to four different target rates. Second, the efficient frontiers resulting from MV and LPM2(0) optimization are compared to
each other. In particular, we analyze the differences in the portfolio allocation and risk of the MV-efficient and DR-efficient portfolios. The DR portfolios are calculated based on a zero nominal return as target rate. Third, we provide an out-of-sample performance analysis of the two approaches over a five-year time horizon from 2005 to 2009.
5.1 Mean-Variance and Downside Risk Efficient Portfolios
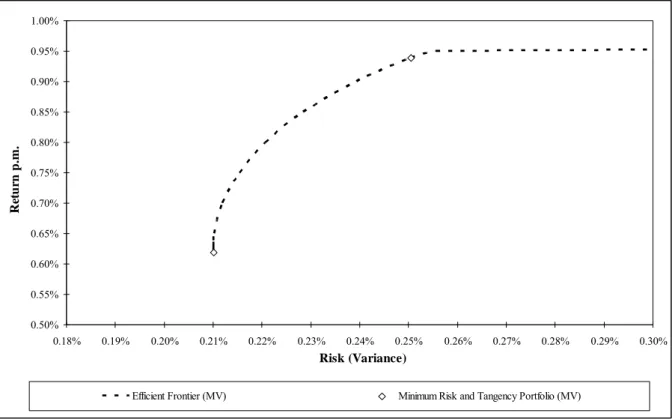
While the following discussion focuses on DR optimization, Table III presents the optimal weights of the traditional MV-optimized portfolios for a given portfolio return level for comparison purpose only. Furthermore, the MV-efficient frontier is shown in Figure I. The MV-efficient portfolios are dominated by the markets in Australia, France, the Netherlands, and the U.S., while the markets in Japan, Singapore, and the U.K. are not represented in the majority of the allocations. The best performing market over the considered time period, Hong Kong represents the maximum return portfolio. For all other return levels, the market of Hong Kong is not substantial.
Table III: Optimal Portfolio Allocation of an MV-Efficient Portfolio Based on the EPRA Indices
Monthly Portfolio Return
AUS FRA HK JAP NL SIN U.K. U.S.
0.62% (MVP) 11 % 4 % 4 % 7 % 56 % 0 % 2 % 16 % 0.70% 12 % 12 % 5 % 4 % 47 % 0 % 0 % 20 % 0.80% 12 % 25 % 6 % 0 % 32 % 0 % 0 % 25 % 0.90% 12 % 41 % 8 % 0 % 7 % 0 % 0 % 32 % 0.96% (MRP) 0 % 0 % 100 % 0 % 0 % 0 % 0 % 0 %
Figure I: Efficient Frontier of MV Portfolios 0.50% 0.55% 0.60% 0.65% 0.70% 0.75% 0.80% 0.85% 0.90% 0.95% 1.00% 0.18% 0.19% 0.20% 0.21% 0.22% 0.23% 0.24% 0.25% 0.26% 0.27% 0.28% 0.29% 0.30% Risk (Variance) Re tu rn p.m .
Efficient Frontier (MV) Minimum Risk and Tangency Portfolio (MV)
In order to examine the implications of the DR approach with respect to the investors’ benchmark, optimal DR portfolios are calculated for four different target returns. Since the results based on the U.S. inflation rate as the target rate do not substantially differ from the results based on the risk-free rate as the benchmark and for clear arrangement, the results from the U.S. inflation rate as the target rate are not presented.
Similar to the results reported by Svitanides (1998) for national direct real estate, we find only minor changes in the portfolio allocation, when different target returns are taken into account. Table IV presents the optimal portfolio weights which minimize the corresponding portfolio 2nd-degree LPM for a given return level calculated with the zero return (LPM2(0)),
the equally weighted portfolio return (LPM2(EW)), and the risk-free rate (LPM2(RF)) as
target rate. It is apparent that if the target rate evolves from a low target like the zero return to an equally weighted portfolio return, the portfolio weights of the French market decrease and the U.S. weights increase, although the changes are rather small. In general, the European markets (particularly the Dutch and French country indices) obtain the highest portfolio shares for large parts of the efficient frontier, which reflects high means and a relatively low negatively skewed return distribution of these markets, as show in section 4. At increasing return levels, the U.S. and Hong Kong gain more and more weight in the optimal allocation. Hong Kong is the only Asia-Pacific securitized real estate market which is represented in an
efficient portfolio allocation. Australia and Japan are not represented, neither is the U.K.. The efficient frontier of the LPM2(0) portfolios is graphically shown in Figure II.
Table IV: Optimal LPM Portfolio Weights for the National and Global EPRA Indices
Optimal Portfolio Weights Monthly
Portfolio Return
Portfolio Model
AUS FRA HK JAP NL SIN U.K. U.S.
0.62 % LPM2(0) 0 % 15 % 4 % 0 % 81 % 0 % 0 % 0 % LPM2(EW) 0 % 14 % 3 % 0 % 81 % 0 % 0 % 2 % LPM2(RF) 0 % 15 % 3 % 0 % 81 % 0 % 0 % 0 % 0.70 % LPM2(0) 0 % 30 % 4 % 0 % 62 % 0 % 0 % 4 % LPM2(EW) 0 % 27 % 4 % 0 % 62 % 0 % 0 % 7 % LPM2(RF) 0 % 28 % 4 % 0 % 62 % 0 % 0 % 5 % 0.80 % LPM2(0) 0 % 47 % 5 % 0 % 37 % 0 % 0 % 10 % LPM2(EW) 0 % 44 % 5 % 0 % 37 % 0 % 0 % 13 % LPM2(RF) 0 % 46 % 5 % 0 % 37 % 0 % 0 % 12 % 0.90 % LPM2(0) 0 % 65 % 7 % 0 % 12 % 0 % 0 % 16 % LPM2(EW) 0 % 62 % 6 % 0 % 12 % 0 % 0 % 20 % LPM2(RF) 0 % 63 % 6 % 0 % 12 % 0 % 0 % 18 % 0.96 % LPM2(0) 0 % 0 % 100 % 0 % 0 % 0 % 0 % 0 % LPM2(EW) 0 % 0 % 100 % 0 % 0 % 0 % 0 % 0 % LPM2(RF) 0 % 0 % 100 % 0 % 0 % 0 % 0 % 0 %
Figure II: Efficient Frontier of LPM2(0) Portfolios 0.50% 0.55% 0.60% 0.65% 0.70% 0.75% 0.80% 0.85% 0.90% 0.95% 1.00% 0.10% 0.11% 0.12% 0.13% 0.14% 0.15% Risk (LPM2(0)) Re tu rn p .m.
Efficient Frontier (LPM) Minimum Risk and Tangency Portfolio (LPM)
5.2 Comparison of Mean-Variance-Efficient and Lower-Partial-Moment-Efficient Portfolios
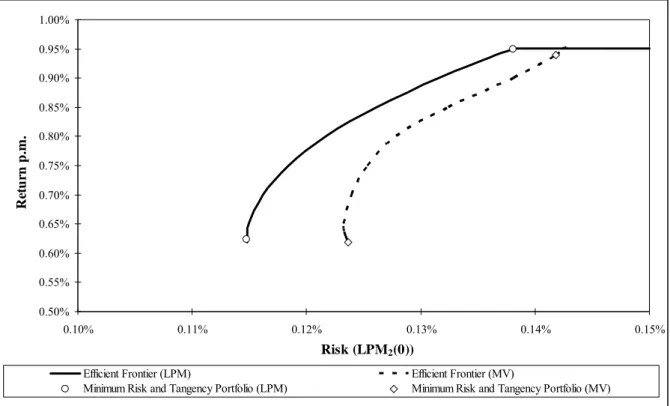
To investigate differences between LPM-optimized and MV-optimized portfolios, the traditional efficient frontier is presented together with the LPM frontier in Figure III. To ease the discussion, we only focus on the portfolio risk measured by the LPM2(0) and the
variance.
Table V shows the percentage increase in risk for a given portfolio return. The percentage difference measures the increase in risk from the LPM2(0)-efficient portfolios to the LPM2(0)
of the corresponding MV-efficient portfolios with the same return. The considered returns are according to the efficient frontier of the LPM2(0) portfolios, spanned by the return of the
minimum LPM2(0) portfolio, namely 0.624 %, to the maximum return portfolio of 0.960 %.
We find the largest divergences between the two efficient frontiers in the low-risk area. For example, the DR increases by 7.68 % for the minimum risk portfolio when the investor minimizes portfolio variance instead of the portfolio’s LPM2(0). The gap narrows for higher
returns, e.g., for the portfolio return of 0.850 % per month, the increase in DR is 5.02 % and finally zero for the maximum return portfolio. However, the result for the maximum return portfolio is given by definition.
In the next step, the question arises whether and to what extent the efficient portfolio allocations resulting from MV and LPM2(0) optimization differ from each other. First, we
focus on the number of different assets and afterwards we consider the differences in the portfolio weight of each asset represented in both allocations. Following Phillips (1993) as well as Thomas and Lee (2006), we compute three “similarity indices” for the efficient asset allocations of a given portfolio return level.
The portfolio overlap index is defined as the ratio of the number of assets that overlap. In the case of the minimum portfolio return, the overlap index is simply computed as (3 / (3 + 7 3)). In addition to the fact that the greatest differences between the overlapping assets occur in the lower part of the efficient frontier, the number of assets obtaining an allocation seems to be less for DR-efficient portfolios than for portfolios resulting from MV optimization, in general. In particular, the Australian market is not able to gain any consideration in the LPM portfolios, while it is considered for large parts of the frontier in the case of MV-optimized portfolios.
To analyze differences in the portfolio weights, the weight index in Table V reports the common weight of the two portfolio compositions. It is calculated as the sum of the minimum weight attached to each asset that overlaps the two portfolios. Even when the two optimal portfolio compositions share many common assets, the optimal weight of each asset can differ considerably in the two solutions. For example, the 0.90 % return portfolios in the LPM2(0) and MV cases share 80 % of the assets. However, only 71.3 % of the portfolio
weights are indeed equal.
The similarity index in the last column of Table V is obtained by multiplying the overlap and the weight indices. The low values of the similarity indices indicate substantially different portfolio allocations between the two optimization procedures especially for the lower part of the efficient frontier.
Table V: Comparison of MV- and LPM2(0)-Efficient Portfolios
No. of Assets obtaining an Allocation Similarity Indices Monthly Portfolio Return Increase in Risk (LPM2(0))
LPM2(0) MV Common Overlap Weight Similarity
0.62 % 7.68 % 3 7 3 42.9 % 63.5 % 27.2 % 0.65 % 7.19 % 3 6 3 50.0 % 64.6 % 32.3 % 0.70 % 6.72 % 4 6 4 66.7 % 67.2 % 44.8 % 0.75 % 5.84 % 4 6 4 66.7 % 69.8 % 46.6 % 0.80 % 5.01 % 4 5 4 80.0 % 71.7 % 57.4 % 0.85 % 5.02 % 4 5 4 80.0 % 71.5 % 57.2 % 0.90 % 5.00 % 4 5 4 80.0 % 71.3 % 57.0 % 0.95 % 3.11 % 3 4 3 75.0 % 78.7 % 59.0 % 0.96 % 0.00 % 1 1 1 100.0 % 100.0 % 100.0 %
Notes: Increase in Risk measures the percentage increase in the LPM2(0) when MV efficient portfolios are used instead of LPM2(0) efficient portfolios for a given return level.
Figure III: Efficient Frontier of MV and LPM2(0) Portfolios
0.50% 0.55% 0.60% 0.65% 0.70% 0.75% 0.80% 0.85% 0.90% 0.95% 1.00% 0.10% 0.11% 0.12% 0.13% 0.14% 0.15% Risk (LPM2(0)) Re tu rn p .m .
Efficient Frontier (LPM) Efficient Frontier (MV)
5.3 Out-of-Sample Performance Analysis
In this section, the performance of efficient MV and DR portfolios is evaluated by an out-of-sample analysis. First of all, the optimal portfolio weights based on the period from 1990 to 2004 are computed for DR-efficient portfolios with different target returns as well as for MV-efficient portfolios. In the following, we measure both the relative performance of the portfolios based on excess return to risk ratios and the absolute performance of the minimum risk and tangency portfolios in comparison to a naïvely diversified, equally weighted portfolio over the period from 2005 to 2009, which is characterized by high market volatility and financial turmoil.
The results for the five year out-of-sample performance are presented in Table VI, where the portfolios are sorted by their monthly average return in the second column. Unaffected from the chosen DR target return, all the tangency LPM portfolios provide higher returns than a simple equally weighted investment strategy. Thus, all three excess return to risk ratios indicate a superior performance against the equally weighted portfolio. Less convincing are the results for the minimum LPM portfolios. Although one might expect relatively low returns for this subgroup, it is also characterized by higher risk (regardless of how risk is measured, i.e. as the variance, LPM2(0), or LPM2(RF)) than the equally weighted portfolio.
These properties of the minimum LPM portfolios are also shown by the inferior excess return to risk ratios of the minimum LPM portfolios in the last three columns of Table VI.
Finally, we find the performance of the two ex-ante constructed MV-based portfolios in the last two rows of Table VI. Interestingly, both the tangency and the minimum risk portfolio not only exhibit the lowest out-of-sample portfolio returns of the peer group, but also possess the highest ex-post risk even when it is measured by the variance.
Additionally we also implemented the Bayes-Stein estimator, as recommended by Jorion (1985, 1986) and Stevenson (2001). The application and implementation of the Bayes-Stein estimator is often justified with the argument that portfolio optimization procedures are especially sensitive to expected returns. When expected returns are replaced by their historical sample means, it follows that the optimization routine is likely to generate an ex post MV-efficient frontier that tells us to put large weights on the lucky markets in the sample. To tackle this problem, the Bayes-Stein estimator shrinks the asset means toward a common value, e.g. the average return of a globally diversified portfolio, from which one hopes to obtain a better out-of-sample portfolio performance. Unfortunately, in our
application all portfolios modified according to the Bayes-Stein estimator have a slightly worse out-of-sample performance than the portfolios based on unadjusted returns. Hence, we do not report them in Table VI.
Summarizing the results from the out-of-sample performance analysis, it can be stated that minimum risk and tangency portfolios resulting from DR optimization outperform MV-efficient portfolios in both absolute and risk-adjusted performance measures. This result is independent of the applied target rate in the DR framework. Furthermore, it is also shown that tangency LPM portfolios perform better than a naïvely diversified, equally weighted portfolio. Thus, the findings from the out-of-sample analysis further support the application of the DR risk framework suggested by Estrada (2008) not only for portfolio decision making of investors facing non-quadratic utility functions but also for investors with utility functions which are sufficiently covered by the mean and the variance.
Table VI: Five-Year Out-of-Sample Performance (2005-2009)
Excess Return to Risk Ratio Monthly Portfolio Return Variance LPM2(0) LPM2(RF) Volatility LPM2(0) LPM2(RF) LPM2(Infl) tang 0.483 % 0.563 % 0.344 % 0.354 % 3.459 % 4.428 % 4.359 % LPM2(0) tang 0.481 % 0.560 % 0.341 % 0.352 % 3.439 % 4.403 % 4.334 % LPM2(RF) tang 0.480 % 0.563 % 0.344 % 0.355 % 3.417 % 4.372 % 4.305 % LPM2(EW) tang 0.476 % 0.576 % 0.353 % 0.364 % 3.330 % 4.253 % 4.188 % EW 0.368 % 0.535 % 0.333 % 0.344 % 1.975 % 2.504 % 2.463 % Min LPM2(0) 0.317 % 0.571 % 0.362 % 0.373 % 1.234 % 1.550 % 1.527 % Min LPM2(RF) 0.311 % 0.575 % 0.365 % 0.376 % 1.156 % 1.451 % 1.430 % Min LPM2(Infl) 0.311 % 0.575 % 0.365 % 0.376 % 1.152 % 1.446 % 1.425 % Min LPM2(EW) 0.294 % 0.589 % 0.376 % 0.387 % 0.922 % 1.154 % 1.137 % MV tang 0.235 % 0.633 % 0.413 % 0.425 % 0.138 % 0.171 % 0.168 % Min MV 0.125 % 0.623 % 0.420 % 0.432 % -1.250 % -1.522 % -1.500 %
6 Conclusion
Theoretical and practical portfolio management has been affected by the MPT suggested by Markowitz (1952) for almost 60 years. An almost innumerable amount of research on this
topic has been conducted and is still one of the most popular frameworks in finance. However, even Markowitz (1959) himself criticized and mentioned that a framework based on semi-variance, semi-deviation, or other shortfall risk measures instead of variance and standard deviation is more suitable to incorporate investors’ risk perception and to take care of the asymmetry in return distributions. Nevertheless, it took some time until financial research began to focus on portfolio optimization in a DR framework in more detail. While in the meantime, existing literature has been growing in the context of common stock and bond portfolios, there is still very limited research conducted related to pure real estate portfolios. Thus, this paper analyzes how much portfolio optimization and portfolio allocation differ when applying DR frameworks instead of the traditional MV framework and what implications can be drawn from the results for investors.
The analysis is based on an approach suggested by Estrada (2008). In contrast to previous studies in the field of DR optimization in real estate portfolios, the theoretical / technical merit of the Estrada approach is given by the innovative concept of measuring co-downside movements and using a similar optimization procedure to that in the traditional MV framework at the same time. To our knowledge, this approach is applied for the first time to portfolios of real estate assets. Furthermore, covering the eight largest securitized real estate markets around the world, the analysis is also the first applying the DR framework in a global context.
In addition to the theoretical merits of the DR framework, the empirical results further support the strength of the applied DR framework compared to the MV framework and provide several interesting and practical implications for investors in international securitized real estate markets.
First, the hypothesis of normally distributed returns is rejected for all eight analyzed securitized real estate markets at the 1 % level of significance and thus, the results from MV analysis are highly limited and at least questionable for investors facing utility functions which not only consider the first two moments of a return distribution. Second, optimal portfolio weights between the two frameworks differ substantially, as shown by the similarity index, which is less than 60 percent for all return levels with the exception of the maximum return portfolio. However, the identical allocation in both frameworks for the maximum return portfolio is given by definition and thus not surprising. Third, comparing the regional portfolio weights, it is remarkable that – switching from MV optimization to downside risk
optimization – the optimal portfolio allocation moves from the U.S. and Asia-Pacific markets towards the two continental European markets in France and the Netherlands. In the Australian and the U.S. market, this result is due to their high negative skewness, which is not explicitly considered in the MV optimization process. While the three Asian markets are characterized by the highest DR, the Dutch and the French markets exhibit relatively high returns, show the lowest standard deviation as well as the lowest DR, and thus are characterized by return distribution properties being for most investors. Fourth, analyzing out-of-sample performance during a period characterized by high volatility and financial market turmoil, it is shown that DR portfolios outperform both naïve equally weighted portfolios as well as MV-optimized portfolios. Interestingly, the outperformance is not only confirmed by DR measures but also by MV risk measures such as Sharpe ratios.
In summary, the conducted analysis documents in a comprehensive way that the DR approach suggested by Estrada (2008) has its merits when applying it to securitized real estate portfolio optimization problems. Furthermore, it is shown that portfolio weights differ substantially from MV optimization and the DR framework is superior in an out-of-sample analysis. Thus, the presented DR framework constitutes a useful contribution to investors facing practical portfolio optimization problems in securitized international real estate markets. While the analysis has only focused on securitized real estate portfolios, the question if and whether the DR approach is also appealing in a mixed-asset framework is left to further research. From a methodological perspective, further contribution to existing research could be given by implementing bootstrapping to DR optimization of international securitized real estate portfolios, similar to how Srivatsa et al. (2010) does for national mixed-asset portfolios including direct real estate markets but not international indirect real estate markets.
References
Bawa, V.S. (1975): Optimal Rules for Ordering Uncertain Prospects, Journal of Financial
Economics 2(1), 95-121.
Brounen, D., and P.M.A. Eichholtz (2003): Property, Common Stock, and Property Shares – Increased Potential for Diversification, The Journal of Portfolio Management 30, Special
Issue, 129-137.
Cheng, P. (2001): Comparing Downside-Risk and Mean-Variance Analysis Using Bootstrap Simulation, Journal of Real Estate Portfolio Management 7(3), 225-238.
Cheng, P., and M.L. Wolverton (2001): MPT and the Downside Risk Framework: A Comment on Two Recent Studies, Journal of Real Estate Portfolio Management 7(2),
125-131.
Conover, C.M., H.S. Friday, and G.S. Sirmans (2002): Diversification Benefits from Foreign Real Estate Investments, Journal of Real Estate Portfolio Management 8(1), 17-25.
Eichholtz, P.M.A. (1996): The Stability of the Covariance of International Property Share Returns, The Journal of Real Estate Research 11(2), 149-158.
Estrada, J. (2008): Mean-Semivariance Optimization: A Heuristic Approach, Journal of
Applied Finance 18(1), 57-72.
Fishburn, P.C. (1977): Mean-Risk Analysis with Risk Associated with Below-Target Returns, American Economic Review 67(2), 116-126.
Harlow, W.V. (1991): Asset Allocation in a Downside-Risk Framework, Financial Analysts
Journal 47(5), 28-40.
Harlow, W.V., and R.K.S. Rao (1989): Asset Pricing in a Generalized Mean-Lower Partial Moment Framework: Theory and Evidence, Journal of Financial and Quantitative
Analysis 24(3), 285-310.
Hogan, W.W., and J.M. Warren (1974): Toward the Development of an Equilibrium Capital-Market Model Based on Semivariance, Journal of Financial and Quantitative Analysis
Jarque, C.M., and A.K. Bera (1987): A Test for Normality of Observations and Regression Residuals, International Statistical Review 55(2), 163-172.
Jorion, P. (1985): International Portfolio Diversification with Estimation Risk, Journal of
Business 58(3), 259-278.
Jorion, P. (1986): Bayes-Stein Estimation for Portfolio Analysis, Journal of Financial and
Quantitative Analysis 21(3), 279-292.
Kaplanis, E.C. (1988): Stability and Forecatsing of the Comovement Measures of International Stock Market Returns, Journal of International Money and Finance 7(1),
63-75.
Liow, K.H. (1997): The Historical Performance of Singapore Property Stocks, Journal of
Property Finance 8(2), 111-125.
Liow, K.H. (2008): Extreme Returns and Value at Risk in International Securitized Real Estate Markets, Journal of Property Investment & Finance 26(5), 418-446.
Longin, F., and B.H. Solnik (1995): Is the Correlation in International Equity Returns Constant: 1960-1990?, Journal of International Money and Finance 14(1), 3-26.
Longin, F., and B.H. Solnik (2001): Extreme Correlation of International Equity Markets,
The Journal of Finance 56(2), 649-676.
Markowitz, H.M. (1952): Portfolio Selection, The Journal of Finance 7(1), 77-91.
Markowitz, H.M. (1959): Portfolio Selection: Efficient Diversification of Investments, Wiley,
New York.
Maurer, R., and F. Reiner (2002): International Asset Allocation with Real Estate Securities in a Shortfall Risk Framework: the Viewpoint of German and U.S. Investors, Journal of
Real Estate Portfolio Management 8(1), 27-43.
Nawrocki, D.N. (1991): Optimal Algorithms and Lower Partial Moments: Ex Post Results,
Applied Economics 23(3), 465-470.
Nawrocki, D.N. (1999): A Brief History of Downside Risk Measures, Journal of Investing
Newell, G., and P. Acheampong, P. (2001): The Dynamics of the Australian Property Market Risk and Correlation Profile, Pacific Rim Property Research Journal 7(4), 259-270.
Newell, G., and K.W. Chau (1996): Linkages between Direct and Indirect Property Performance in Hong Kong, Journal of Property Finance 7(4), 9-29.
Phillips, H. (1993): Portfolio Optimization Algorithms, Simplified Criteria, and Security Selection: A Contrast and Evaluation, Review of Quantitative Finance and Accounting
3(1), 91-97.
Price, K., B. Price, and T.J. Nantell (1982): Variance and Lower Partial Moment Measures of Systematic Risk: Some Analytical and Empirical Results, Journal of Finance 37(3),
843-855.
Schindler, F. (2009): Correlation Structure of Real Estate Markets over Time, Journal of
Property Investment & Finance 27(6), 579-592.
Schindler, F. (2010): Long-Term Benefits from Investing in International Securitized Real Estate, International Real Estate Review, forthcoming.
Serrano, C., and M. Hoesli (2009): Are Securitized Real Estate Returns More Predictable than Stock Returns, Journal of Real Estate Finance and Economics, forthcoming.
Sing, T.F., and S.E. Ong (2000): Asset Allocation in a Downside Risk Framework, Journal of
Real Estate Portfolio Management 6(3), 213-223.
Sivitanides, P.S. (1998): A Downside-Risk Approach to Real Estate Portfolio Structuring,
Journal of Real Estate Portfolio Management 4(2), 159-168.
Srivatsa, R., A. Smith, and J. Lekander (2010): Portfolio Optimisation and Bootstrapping”,
Journal of Property Investment & Finance 28(1), 24-33.
Stevenson, S. (2001): Emerging Markets, Downside Risk and the Asset Allocation Decision,
Emerging Markets Review 2(1), 50-66.
Thomas, M., and S.L. Lee (2006): The Impact of Exchange Rates on International Real Estate Portfolio Allocation, Journal of Real Estate Portfolio Management 12(3), 277-291.
Urzúa, C.M. (1996): On the Correct Use of Omnibus Tests for Normality, Economic Letters