Department of
Civil, Constructional and Environmental Engineering
Geodesy and Geomatics Division
Ph.D. Course in Infrastructures and Transportations
XXV CicloHigh resolution radargrammetry
with COSMO-SkyMed, TerraSAR-X and
RADARSAT-2 imagery:
development and implementation
of an image orientation model
for Digital Surface Model generation
Candidate Supervisor
Paola Capaldo Prof. Mattia Crespi
C’´e un giorno per seminare e un giorno per raccogliere... gioved´ı andrebbe benissimo.
Contents
Contents iii
List of Figures v
List of Tables vii
Abstract ix
1 Introduction 1
2 Synthetic Aperture Radar 5
2.1 Orbit feature . . . 6
2.2 Synthetic Aperture Radar . . . 8
2.3 SAR images distortions and peculiarity . . . 16
2.3.1 Response of slope . . . 17
2.3.2 Response of soil . . . 20
2.3.3 Response of vegetation . . . 20
2.3.4 Response of water and ice . . . 21
2.4 SAR satellite missions . . . 22
2.4.1 COSMO-SkyMed . . . 22
2.4.2 TerraSAR-X . . . 26
2.4.3 RADARSAT-2 . . . 29
3 Radargrammetry 35 3.1 Digital Elevation Model . . . 35
3.2 Radrgrammetric approach . . . 37
Contents Contents
4 SISAR Radargrammetric orientation model 45
4.1 Reference systems . . . 45
4.2 Classical projection equation . . . 46
4.3 Radargrammetric model . . . 49
4.3.1 Orbit computation . . . 51
4.3.2 The full stereo functional model . . . 53
4.4 Rational Polynomial Functions . . . 54
5 The commercial software PCI-Geomatica 59 5.1 PCI-Geomatica . . . 59
5.1.1 Focus . . . 60
5.1.2 OrthoEngine . . . 61
6 Analysis and results 65 6.1 Radargrammetric model evaluation: Monte Carlo simulation . . . 65
6.2 Results COSMO-SkyMed and TerraSAR-X data . . . 67
6.2.1 Data set . . . 67
6.2.2 Accuracy results of radargrammetric model . . . 70
6.2.3 Accuracy results of RPCs model . . . 71
6.3 Beauport test site results and comparison with OrthoEngine software 73 6.3.1 Beauport Data set . . . 73
6.3.2 SISAR model vs Toutin’s model: stereo restitution accu-racy result on the three high resolution SAR satellite data . 75 6.3.3 Radargrammetric DSMs extracted with OrthoEngine . . . . 76
6.4 Radargrammetric model: comparison with metadata Tie Points . . 80
7 Conclusions 83
Acknowledgements 87
Ringraziamenti 89
List of Figures
2.1 Sun angle . . . 6 2.2 Sun-synchronous orbit . . . 7 2.3 Orbit inclination . . . 8 2.4 Electromagnetic Spectrum . . . 9 2.5 Side-looking configuration . . . 92.6 Echoes received back by antenna . . . 10
2.7 Constructing a synthetic antenna . . . 10
2.8 Angular field of signal . . . 12
2.9 Imaging system of SAR . . . 13
2.10 Definition of squint angleτ . . . 14
2.11 Slant range plane and ground plane projection . . . 15
2.12 Stripmap acquisition mode . . . 15
2.13 SpotLight acquisition mode . . . 16
2.14 Scattering mechanism . . . 17
2.15 Ground projection dg and in slant range projection ds . . . 18
2.16 Simplifying assumption for relief displacement . . . 19
2.17 Relief displacement on a SAR image . . . 20
2.18 Image of slopes . . . 21
2.19 COSMO-SkyMed satellite . . . 22
2.20 TerraSAR-X satellite . . . 26
2.21 Rasarsat-2 satellite . . . 30
3.1 DSM and DEM . . . 35
3.2 Terrain height computation using the parallaxes . . . 37
3.3 Stereo opposite-side for radargrammetry . . . 38
3.4 Stereo same-side configuration for radargrammetry . . . 39
3.5 Double bounce effect in Hannover urban area, TerraSAR-X image 40 3.6 Basic stereo geometry for radargrammetry . . . 41
List of Figures List of Figures
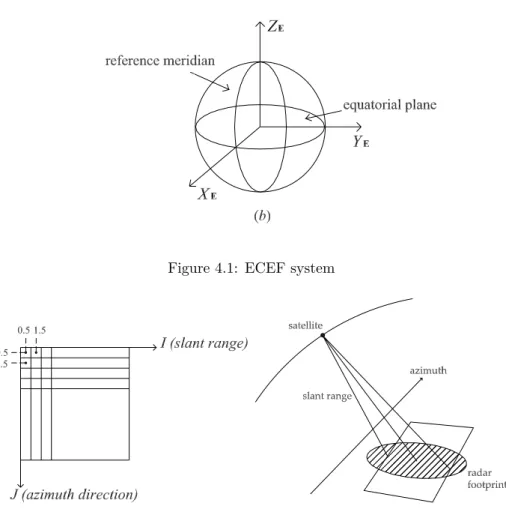
4.1 ECEF system . . . 46
4.2 Image system . . . 46
4.3 Object and sensor systems . . . 47
4.4 Acquisition system . . . 48
4.5 Doppler circles . . . 50
4.6 Orbit estimation . . . 51
4.7 state vector positions . . . 52
4.8 RPCs- terrain independent approach . . . 55
5.1 Focus Histogram ad statistic windows . . . 61
5.2 Automatic DEM extraction windows . . . 62
6.1 Radar collimation . . . 66
6.2 Merano test site . . . 68
6.3 San Pietro island test site . . . 69
6.4 Hannover test site . . . 69
6.5 Trento test site . . . 70
6.6 Beauport test site . . . 74
6.7 Beauport overlap area . . . 75
6.8 LiDAR Beauport area . . . 75
6.9 GCPs distribution on SAR imagery . . . 77
6.10 DSM COSMO-SkyMed and error map . . . 79
6.11 DSM TerraSAR-X and error map . . . 79
List of Tables
2.1 COSMO-SkyMed sensor characteristics . . . 23
2.2 TerraSAR-X sensor characteristics . . . 27
2.3 RADARSAT-2 sensor characteristics . . . 30
6.1 Monte Carlo simulation . . . 67
6.2 Difference accuracy with or without GCPs stereo model . . . 67
6.3 COSMO-SkyMed images features . . . 68
6.4 TerraSAR-X images features . . . 69
6.5 COSMO-SkyMed radargrammetric model accuracy . . . 71
6.6 TerraSAR-X radargrammetric model accuracy . . . 71
6.7 COSMO-SkyMed RPCs model accuracy . . . 72
6.8 TerraSAR-X RPCs model accuracy . . . 72
6.9 RPCs elevation effect . . . 73
6.10 Beauport test site images features . . . 74
6.11 Beauport test site model accuracy . . . 76
6.12 Beauport COSMO-SkyMed DSM accuracy . . . 78
6.13 Beauport TerraSAR-X DSM accuracy . . . 80
6.14 Beauport CSK, TSX, R2 comparison - DSM accuracy . . . 80
Abstract
Digital Surface and Terrain Models (DSM/DTM) have large relevance in sev-eral territorial applications, such as topographic mapping, monitoring engineer-ing, geology, security, land planning and management of Earth’s resources. The satellite remote sensing data offer the opportunity to have continuous observation of Earth’s surface for territorial application, with short acquisition and revisit times, satisfying the demand for monitoring rapid changes in the ground and anthropic activities. Meeting these requirements, the SAR (Synthetic Aperture Radar) high resolution satellite imagery could offer night-and-day and all-weather functionality (clouds, haze and rain penetration), that represents an important advantage for time-series analysis and for rapid mapping. This work is focused on the generation of radargrammetric DSM/DTM from high resolution SAR imagery and in detail, it is focused on the image orientation model for radargrammerty. Two different methods may be used in order to generate DSMs from SAR data: the interferometric and the radargrammetric approaches. The radargrammetry uses only the intensity information of the SAR images and reconstructs the 3D information starting from a couple of images similarly to photogrammetry. The interferometry uses the phase differences information between the SAR images to lead the terrain elevation. At present, it is pretty well known that the radar interferometry may suffer for lack of coherence, especially over areas with veg-etation/forest. In this sense, radargrammetry could be a possible alternative solution to avoid the classical decorrelation problem affecting the interferometric technique, using just a couple of images with appropriate geometric configura-tion. Nowadays, the importance of the radargrammetric approach is rapidly growing due to the new high resolution imagery (up to 1 m of ground resolution) which can be acquired by COSMO-SkyMed (Italy), TerraSAR-X (Germany) and RADARSAT-2 (Canada) sensors in SpotLight mode. Radargrammetric DSM ex-traction procedure consists of two basic steps: the stereo pair orientation and the
image matching for the automatic detection of homologous points.
The goal of this work is the definition and the implementation of a geometric model in order to orientate SAR imagery in zero Doppler geometry. As regards the radargrammetric orientation model, it should be underlined that, starting from the model proposed in the classical book of Leberl (Radargrammetric im-age progessing), a refinement of the orbital model is needed to comply with and to exploit the potentialities of the novel high resolution (both in azimuth and in range). The radargrammetric model implemented in SISAR (Software per Im-magini Satellitari ad Alta Risoluzione - developed at the Geodesy and Geomatic Division - University of Rome “La Sapienza” ) is based on the equation of radar target acquisition and zero Doppler focalization. The radargrammetry technique performs a 3D reconstruction based on the determination of the sensor-object stereo model, in which the position of each point on the object is computed as the intersection of two radar rays coming from different positions and therefore with two different look angles. Actually, these radar rays can be simply modeled as two segments of measured lengths centered in two different positions (along two different satellite orbits), so that the intersection generating each object point is one of the two possible intersections between two circumferences centered in the two different positions and laying into two planes orthogonal to the two different satellite orbits whose radii are equal to the segment measured lengths.
The crucial issue for the image orientation is the orbital estimation. Starting from a first orbital function, the satellite position estimation has been changed during the tests. Initially, for the short length of SpotLight orbit acquisition, the metadata state vector positions and times were used to estimate the parameters of simple circular orbit. This approximation needed a few number of Ground Control Points (GCPs) to correct some SAR acquisition parameters. Following, the orbit interpolation has been changed from a circumferences to a Lagrange polynomial. This polynomial allow the possibility to oriented a SAR stereo pairs without use GCPs. Moreover a tool for the SAR Rational Polynomial Coeffi-cients (RPCs) generation has been implemented in SISAR software, similarly to the one already developed for the optical sensors. The Rational Polynomial Functions (RPFs) model with the employment of RPCs is a well known method to orientate optical satellite imagery. In fact some satellite imagery vendors have considered the use of RPF models as a standard to supply a re-parametrized form of the sensor model in term of the RPCs, secretly generated from their own physical sensor models. This generalized method is very simple, since its imple-mentation is standard and unique for all the sensors; it relates the object point coordinates (latitudeφ, longitudeλand height h) to the pixel coordinates (I, J) in the form of ratios of polynomial expressions, moreover the RPFs model ori-entation accuracy using the RPCs is at level of the geometric models ones. The possibility to generate SAR RPCs starting from a radargrammetric model sounds
of particular interest since, at present, the most part of SAR imagery is not sup-plied with RPCs, although the RPFs model is available in several commercial software. Only RADARSAT-2 data are supplied with vendors RPCs. The RPCs can be an useful tool in place of the geometric model in processes as the image orthorectification/geocoding or as the DSMs generation, since the RPFs model is very simple and fast to be applied. To test the effectiveness of the implemented RPCs generation tool and the SISAR radargrammetric orientation model the reference results were computed: the stereo pairs were orientated with the two model. The test were carried out on several test site using COSMO-SkyMed, TerraSAR-X and RADARSAT-2 data. Moreover, to evaluated the advantages and the different accuracy between the orientation models computed without GCPs and the orientation model with GCPs a Monte Carlo test was computed. At last, to define the real effectiveness of radargrammetric technique for DSM extraction and to understand the radrgrammetric tool implemented in a com-mercial software PCI-Geomatica v. 2012 , the images acquired on Beauport test site were used for DSM extraction by OrthoEngine tool (PCI-Geomatica toll for satellite imagery processing). It is important underline that several test were computed. This tests were carried out under the supervision of Prof. Thierry Tountin at CCRS (Canada Centre of Remote Sensing) where the PCI-Geomatica orientation model was developed, in order to check the better parameters solution to extract radargrammetric DSMs.
In conclusion, the results obtained are representative of the geometric poten-tialities of SAR stereo pairs as regards 3D surface reconstruction. The orientation accuracy, evaluated in terms of RMSE Control Points (CPs) residuals, is around 4/5 m. The results show the good performance of the software, considering not excellent accuracy of the available CPs. The orientation model, implemented in SISAR, without use of GCPs gives good results as the application of RPCs model to SAR stereo pairs what proves the effectiveness of the RPCs generation tool implemented in SISAR. The OrthoEngine DSM extracted shown the advantages and potentiality of radargrammetric technique as alternative or complementary solution to the interferometric technique in order to generated digital model from SAR data.
Chapter 1
Introduction
The possibility of near-real-time 3D Earth surface mapping satellite remote sensing data enable the possibility of continuous observation of the Earth’s sur-face, with short times of acquisitions and revisit. This can satisfy the demand for the monitoring of rapid changes on the ground and in anthropic activities. In this respect, the availability of new high-resolution SAR (Synthetic Aper-ture Radar) spaceborne sensors offers new interesting potential for generation of radargrammetric DSMs (Digital Surface Models). The technologies provides for low cost, fast data acquisition and processing, independence from logistic difficulties, night-and-day, and all-weather functionality. These features are of crucial importance for security, land planning and management of Earth’s re-sources, timely monitoring and management of disasters and emergencies such as geo-hydrological instability or geological/geophysical hazards in addition to the topographic mapping and monitoring engineering.
SAR satellite represent an already available tool for GMES (Global Monitor-ing for Environment and Security), the European Programme for the establish-ment of a European capacity for Earth Observation, and for several objectives of Horizon 2020, the new framework programme for research and innovation in Europe starting on 2014.
Two different methods to extract absolute or relative elevation from SAR data are interferometry and radargrammetry, both using a couple of images of the same area acquired from two different points of view. The interferometry uses the phase differences information between the SAR images to lead the terrain elevation. The radargrammetry using only the intensity information of the SAR
images and reconstructs the 3D information starting from a couple of images similarly to photogrammetry.
Actually, due to the low resolution amplitude supplied by the spaceborne radar sensors available until now (at the level of tens of meters), usually the first approach has been used, being aware that the radar interferometry may suffer for lack of coherence.
In fact the radargrammetric approach was first used in the 1950s; then, as mentioned, it was less and less used, due to the quite low resolution in amplitude of radar image, if compared to their high resolution in phase [34]. Only in the last decade some researchers have investigated the DSMs generation from very high resolution SAR data, for instance Raggam et al. [27] studied the potentialities of TerraSAR-X, and Toutin and Chenier [35] studied the RADARSAT-2 ones.
At present, the importance of the radargrammetric approach is rapidly grow-ing due to the new high resolution imagery (up to 1 m GSD) which can be acquired by COSMO-SkyMed, TerraSAR-X and RADARSAT-2 sensors in Spot-Light mode. In this sense, it seems useful to underline that the two approaches should be considered complementary, in order to obtain the best (accurate and complete) product.
Two steps are necessary for radargrammetric DSM extraction: the image orientation and the image matching (automatic detection of homologous points). The goal of this thesis work is the DSM extraction from SAR data using the radargrammetric approach, in particular the definition and the implementation of a geometric model to orientate SAR images.
It is well known that the optimum stereo imagery configuration for the radar-grammetric application is when the target is observed in opposite-side view; how-ever it causes large geometric and radiometric disparities, hindering the image matching. A good compromise is to use a same-side configuration stereo pair with a convenient base to height ratio, in order to increase the efficiency in the correlation image process [23].
As regards the radargrammetric orientation model, it has to be underlined that, starting from the model proposed in the classical book of Leberl [20] , a refinement of the orbital model have to be taken into account to comply with and to exploit the potentialities of the novel high resolution (both in azimuth and in range). Therefore, the defined and implemented model performs a 3D orientation based on two range and two zero Doppler equations performed without GCPs (Ground Control Points) using the only metadata information.
The model has been implemented in SISAR (Software per Immagini Satellitari ad Alta Risoluzione), a scientific software developed at the Geodesy and Geomatic Division - University of Rome “La Sapienza”. This software was at first devoted to the orientation of high resolution optical imagery [12], and in the last years it has been extended also to SAR imagery.
Moreover a tool for the SAR Rational Polynomial Coefficients (RPCs) ge-neration has been implemented in SISAR software, similarly to the one already developed for the optical sensors [11].
The Rational Polynomial Functions (RPFs) model with the employment of RPCs is a well known method to orientate optical satellite imagery. In fact, some satellite imagery vendors have considered the use of RPFs models as a standard to supply a re-parametrized form of the rigorous sensor model in terms of the RPCs, that implicitly provide the interior and external sensor orientation. This generalized method is very simple, since its implementation is standard and unique for all the sensors; moreover the performances of the RPFs model using the RPCs can reach the level of the ones from rigorous models.
The possibility to generate RPCs starting from a rigorous model sounds of particular interest since, at present, the most part of SAR imagery is not supplied with RPCs (only in RADARSAT-2 metadata the RPCs are available), although the RPFs model is available in several commercial software. The RPCs can be an useful tool in place of the rigorous model in processes as the image orthorec-tification/geocoding or as the DSMs generation, since the RPFs model is very simple and fast to be applied.
Deeper investigations in the least squares RPCs estimation underlined that many RPCs are correlated; so, in our approach the Singular Value Decompo-sition (SVD) and QR decompoDecompo-sition are employed to evaluate the actual rank of the design matrix and to select the actual estimable coefficients, avoiding an overparametrization of the model.
The results concern the stereo orientation using both the radargrammetric and the RPCs model. Moreover, to evaluated the difference accuracy between the orientation model calculated without GCPs and the orientation model calculated with GCPs a Monte Carlo test was computed.
In this thesis several tests were performed on SpotLight COSMO-SkyMed and high resolution SpotLight TerraSAR-X stereo pairs; the data available are a COSMO-SkyMed same-side stereo pairs, acquired over the areas of Merano (Northern Italy) and a opposite side stereo pair acquired on San Pietro island (Sardegna) and three TerraSAR-X images, acquired over the area of Hannover (Northern Germany), from which a same-side and an opposite-side stereo pairs have been derived, and on Trento test site two same side images.
In the area test of Beauport (Canada) we have three stereo pairs acquired by COSMO-SkyMed, TerraSAR-X and RADARSAT-2. The results are compared to those stemming from commercial software PCI Geomatica v. 2012, where the well known Toutin’s model is implemented. Moreover, several DSMs were extracted using PCI-Geomatica to test the radargrammetry potentialities, under the supervision of Prof. Thierry Toutin, in order to check the better parameters solution to extract radargrammetric DSMs.
Chapter 2
Synthetic Aperture Radar
Rapid changes in the ground and anthropic activities require the acquisition of information in the shortest time and in the cheapest way; for this reason the studies about the potentialities of satellite imagery developed very fast in the last years. With the advent of instruments that produce images from electromagnetic radiation beyond wave-lengths to which the human eye and cameras are respon-sive, human vision and perception has been greatly extended. Remote sensing has evolved into an important supplement to ground observation ad aerial images in the study of terrain features, such as ground elevation. Due to high spatial resolution of civilian satellite Synthetic Aperture Radar (SAR) sensor since 1980s with the Shuttle Imagining Radar (SIR) a large number of researches around the world have investigated the elevation modelling and the production of Digital Elevation Models. In comparison with the aerial photogrammetric survey, the SAR satellite remote sensing offers some advantages:
• easy monitoring of wide areas
• survey at regular interval: depending only on satellite revisit time (vari-able from 1 day to few tens of days)
• survey of areas logistically critical: from the logistic point of view, where the organization of photogrammetric flights is difficult
• possibility of night acquisition, acquisition in presence of clouds:
This advantage is especially important for the medium scale cartography in developing countries or in countries with difficult political situations. So, the SAR
2.1. Orbit feature
geomatics applications can be classified in the following categories: topographic mapping, deformation mapping, thematic mapping based on change detection, thematic mapping based on classification.
Moreover, SAR imagery are suitable for the DSM generation using radargram-metric or, more commonly, interferoradargram-metric methods; to this aim, special mission have been set up, as the Shuttle Radar Topography Mission (SRTM), specially designed to yield elevation data on world scale, or ERS-1/2 tandem mission, or TanDEM-X mission in the last years.
2.1
Orbit feature
The target of satellite mission is to acquire the largest number of images with the best quality and the best areal coverage; in fact, the satellite orbit is determined by the combination of these requisites and by the revisit time and the distance Earth-satellite.
The orbit is planned considering the fact that the satellite has to observe the widest possible area of the Earth for a reasonable number of repetitions.
The preferred orbits for the Earth observation are usually Low Earth Orbits (LEO) with an altitude between 300 km and 1000 km. This choice represents a compromise between the necessity of a close observation of the Earth and the lifetime of the satellite; in fact the low orbit improves the resolution of images but produces negative effects such as atmospheric drag and gravitational perturbation which are the causes of the satellite lifetime reduction.
Figure 2.1: Sun angle
Also, the light condition, which is a crucial factor for the acquisition of optical imagery, is fundamental in the choice of the orbit.
The sun angle is the angle between the local zenith and the direction of sunbeam; it defines the light condition (Figure 2.1). The best light condition is
2.1. Orbit feature
obtained with a less sun angle (sun at zenith), but presence of little shades could help the observer to recognize details and for a better interpretation of image. For this reasons sun angle usually can changes from 20◦ to 40◦.
Figure 2.2: Sun-synchronous orbit
To guarantee the same lighting at each satellite passage, a Sun-Synchronous Orbit (SSO) is used (Figure 2.2). In this orbit the angle between Earth-Sun direction and the orbit plane is constant and the satellite flies over a certain area at the same local time therefore under the same conditions of light. The weather situations, such as mist, fog and clouds, are obviously unknown and are serious problem for the image acquisition. Obviously, this condition is important only in the case of optical images.
The inclination of the orbit - the angle between the orbital and the equatorial planes - is another relevant parameter to determine the satellite orbit (Figure 2.3). Orbits with large inclination - like pseudo-polar orbits - permit a total coverage of the Earth with only a very slight loss of data on the poles, whereas small inclinations are better in case of specific studies, for example on equatorial area. A good coverage depends not only on the orbit choice but also on the coverage of receiving stations, and on satellite revisit period.
The revisit period is the time between two consecutive acquisitions of the same area; for a satellite sensor it is usually of several days. In order to guarantee very short revisit period, satellite constellations have been launched on orbit, as Cosmo-SkyMED, TerraSAR-X and TanDEM-X, or Pleiades.
Actually, the majority of satellites offer overlap between contiguous orbits and for this reason some areas of the Earth can be acquired more frequently.
2.2. Synthetic Aperture Radar
Figure 2.3: Orbit inclination
Some satellites are able to orient their sensors to shoot the same area in different passages, with shorter time intervals. The revisit period depends also on the inclination of the orbit and it is shorter if the inclination is smaller: this is the main disadvantage of the polar orbits [25].
2.2
Synthetic Aperture Radar
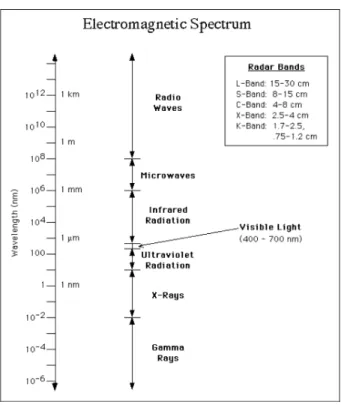
Radar is the commonly used acronym for Radio Detection and Ranging. Ra-dio waves are that part of the electromagnetic spectrum that have wavelengths considerably longer than visible light, as shown in figure 2.4 below.
Imaging radar is an active illumination system, in contrast to passive optical imaging systems that require the Sun’s illumination. An antenna, mounted on an aircraft or spacecraft, transmits a radar signal in a side-looking direction (right or left Fig. 2.5) towards the earth’s surface.
The reflected signal, known as the echo, is backscattered from the surface and received a fraction of a second later at the same antenna, as shown in figure 2.6 below. The brightness, or amplitude (A), of this received echo is measured and recorded and the data are then used to construct an image. For coherent Radar systems such as Synthetic Aperture Radar (SAR), the phase of the received echo is also measured and used to construct the image [6].
2.2. Synthetic Aperture Radar
Figure 2.4: Electromagnetic Spectrum
2.2. Synthetic Aperture Radar
Figure 2.6: Echoes received back by antenna
echoes generated by the forward motion of the spacecraft to synthesise a large antenna, enabling high azimuthal resolution in the resulting image despite a physically small antenna, as shown is figure 2.7 . As the radar moves, a pulse is transmitted at each position. The return echoes pass through the receiver and are recorded in an echo store. Therefore, SAR system is based on the synthetic aperture principle, that simulates a longer antenna.
Figure 2.7: Constructing a synthetic antenna
SAR is a coherent, active, microwave imaging method that improves natural radar resolution by focusing the image through a process known as synthetic aperture processing.
Firstly, we can describe the received powerPr through the radar equation:
Pr=
PtG2λ2
(4π)3R4σ (2.1)
where Pt is the transmitted power, G is the gain of the transmitted and received antenna, λ is the wavelength of the transmitted wave, R is the slant range, that represents the distance between the radar and the scene andσis the radar cross section.
2.2. Synthetic Aperture Radar
The received power depends on many parameters such as the frequency and polarization state of the emitted wave, the dielectric nature and the shape of the object and others. For example, buildings forming a corner with the ground or other buildings, correspond to high reflected energy. Conversely, roughness surfaces diffuse the incident energy and correspond to low reflected energy
The SAR satellite is an along-track sensor. It is made up of a linear detec-tor array of CCDs (Charge Coupled Device) that obtains data in the platform’s direction of motion (azimuth or along-track dimension). The sensor’s instanta-neous field of view extends the length of the swath width. The dimension parallel to the path of the platform carrying the sensor. The along-track dimension is the imaging direction of the sensor that is parallel to the direction in which the satel-lite or aircraft is moving . For side-looking radars, this dimension is sometimes called the range. The typical two-dimensional remotely sensed image is created by the movement of the platform in the along-track direction, while the sensor scans or aims at the orthogonal direction.
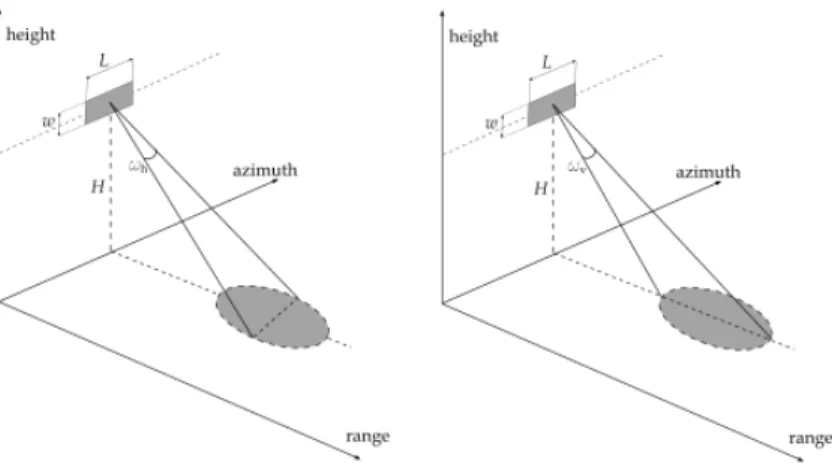
The dimension of the radar antenna determines the angular field of the signal beam in azimuth direction (ωh) and in cross-track direction (ωv) (see Figure 2.8);
more exactly this angular values are dependent from the length (L) and from the width (w) of antenna respectively, as shown in the Equations 2.2.
ωh=Lλ
ωv=wλ
(2.2)
The swath extension can be approximately expressed by the following relation:
WG≈
λRm
wcosη (2.3)
whereλis the wavelength of the microwave used,Rmis the slant range from the center of the antenna to the center of the footprint andη is the incident angle of radar beam pulse.
The resolution of a SAR image is defined by the resolution in azimuth (∆x) and in slant range direction (∆R), or the ground resolution in cross-track direc-tion (∆y).
The azimuth resolution, can be expressed by the Equation 2.4, according to the electromagnetic wave theory:
∆x=Rλ
L (2.4)
where R is the slant range, λ is the wavelength of the signal and L is the length of the antenna.
2.2. Synthetic Aperture Radar
Figure 2.8: Angular field of signal in azimuth directionωh(left) and in cross-track
directionωv (right)
The slant range and the ground range resolution can be expressed by the Equations 2.5 and 2.6: ∆R= cτp 2 (2.5) ∆y= ∆R sinϑ = cτp 2 sinϑ (2.6)
where cis the speed of light, τp is the pulse duration, and ϑis the side-look angle.
The Equations 2.5 show that the slant range and the ground range resolutions are just dependent by the property of the signal, whereas the azimuth resolution is dependent by the position and size of antenna.
The Figure 2.9 shows the acquisition process of a SAR image along its syn-thetic aperture. The variation of the slant rangeR along the image acquisition causes the frequency shift of the echo backscattered from target, varying from an increase to a decrease.
So, considering the response of one point on the ground, the reflected signal from this point can be seen as a frequency modulated signal (Doppler frequency). Also, a filtering operation, called focusing, is applied along the azimuth axis under certain assumptions (width of Doppler spectrum and duration of the seen point), consequently the azimuth resolution ∆xis improved as follows:
2.2. Synthetic Aperture Radar
Figure 2.9: Imaging system of SAR
∆x=L
2 (2.7)
In this way the azimuth resolution is independent from the satellite position and it is related only to the size of antenna.
More generally, the direction of the radar pulse may be manipulated, obtai-ning a forward or a backward look of the radar beam. The beam is transmitted along a conical surface as shown in Figure 2.10. The axis of the cone is along the longitudinal axis of the antenna, and the squint angle τ steers the beam away from the zero Doppler direction, that is perpendicular to the flight path.
The center frequency of the passage of a point scatterer through the an-tenna beam is called the Doppler centroid frequency,fCD, whereas zero Doppler,
fD = 0, denotes the direction in which the Doppler frequency is equal to zero, perpendicular to the flight direction.
The focused data of a satellite SAR image are “deskewed”, that means to process the image such as the data are always observed effectively in zero Doppler geometry.
The time of the beginning of the recorded signal is calledtstart and the end is referredtend. Also, we can define the physical limit of the radar image which is processed in the slant plane (see Figure 2.11):
• the near rangeRnear = (c·tstart)/2
2.2. Synthetic Aperture Radar
Figure 2.10: Definition of squint angleτ
Taking account for the post-processing aimed at the data focusing along the synthetic aperture, the SAR image generation is possible; in this way each pixel contains the information related to its position along the azimuth, to its slant range, to the amplitude of the signal backscattered and the phase information.
The field recorded at generic pixelx, denotedE(x) can be written as:
E(x) =X s
a(s)exp(iψ(s))h(s, x) (2.8)
where the summation ranges over the scatterers,a(s) andψ(s) are respectively the amplitude and phase of the signal received from scatterer s, and h is the instrument function. The value ofhis near 1 when sis in or near the resolving cell corresponding to pixelx, and near zero otherwise.
The detected field E is an array of complex numbers, that represents the image. The square of the modulus of the field atxis called the detected intensity; the square-root of the intensity is called the envelope or the amplitude. This is not the same as the amplitude of the received signal because the received field is perturbed by the instrument function. The amplitude of the received signal,
a(s), is called the reflectivity, and its square is called the surface cross-section. Unfortunately, this is contaminated with speckle noise [22].
As regards the swath extension and the operational modes, the SAR system can image an area over the ground in Stripmap mode or in spotlight mode.
In the well-known Stripmap mode, the radar antenna is pointed along a fixed direction with respect to the platform flight path and the antenna footprint covers
2.2. Synthetic Aperture Radar
Figure 2.11: Slant range plane and ground plane projection
a strip on the imaged surface as the platform moves, see Figure 2.12. Accordingly, the extension of the illuminated area is theoretically unlimited in the azimuth direction, but the azimuth resolution cannot be better than a half of the real antenna azimuth length.
Figure 2.12: Stripmap acquisition mode
The spotlight configuration is used by the last generation satellite with high resolution, in fact in this acquisition mode the resolution in the azimuth direction is improved by increasing the synthetic aperture extension. The radar antenna beam is steered during the overall acquisition time, see Figure 2.13, thus pointing
2.3. SAR images distortions and peculiarity
always at the same area over the ground [19].
Figure 2.13: SpotLight acquisition mode
This configuration allows to obtain the best azimuth resolution to the detri-ment of the extension of the ground coverage [25].
2.3
SAR images distortions and peculiarity
One of the most readily apparent features of radar imagery is its sidelighted char-acter, which arises through variations in the relative sensor to terrain geometry. Shadow areas and radar backscatter are affected by different surface properties over a range of incidence angles.
For flat terrain, the local reflection angle is the same as the incidence angle; most of the incident energy is reflected away from the sensor, resulting in a very low return signal. Rough surfaces, on the other hand, will scatter incidence energy in all directions and return a significant portion of the incident energy back to the antenna, as show in the scattering mechanisms figure below.
The shape and orientation of objects must be considered, as well as their surface roughness, when evaluating radar returns. For instance a particularly bright response will come from a corner reflector, which will produce a double bounce, as shown above. It is also worth noting that some features, such as corn fields, might appear rough when seen in both the visible and microwave portion of the spectrum, whereas other surfaces, such as roads, may appear rough in the visible range but look smooth in the microwave spectrum. In general, SAR images will manifest many more smooth, or specular, surfaces than those produced with optical sensors.
2.3. SAR images distortions and peculiarity
Figure 2.14: Scattering mechanism
2.3.1
Response of slope
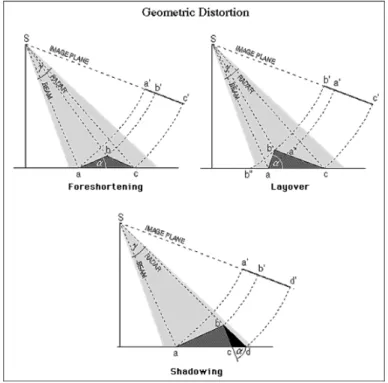
An important SAR image acquisition characteristic is the direction of the dis-placement, that is directed toward the point of observation, whereas in classical aerial or satellite photogrammetry it is directed away from the nadir point. This deformation is typical in SAR geometry and causes the effects called foreshort-ening, layover and shadows. All these effects are quite important in order to understand at best a radar image, especially in mountainous areas.
The projection of a terrain slope according to SAR geometry induces well-known distortion, that in this section will be described.
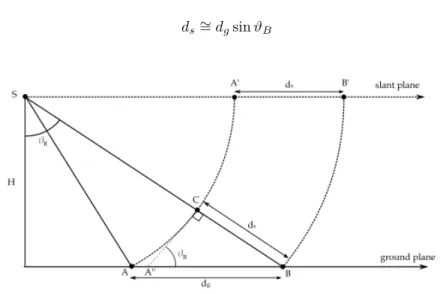
In Figure 2.15 the distortion of the distance AB in ground and slant range projection is represented; the angle ACB, as defined with the auxiliary point C, is nearly equal to 90 degrees, therefore the relation between ground and slant
2.3. SAR images distortions and peculiarity
range distance reads:
ds∼=dgsinϑB (2.9)
Figure 2.15: DistanceABin ground projection dg and in slant range projection
ds
The smaller is the side-look angle,ϑB, to point B, the smaller is the distance in slant range projection,ds, for a given ground distance dg.
Now, the relief displacement on a SAR images is considered and described. Let us now consider a point A, that is situated on top of a vertical structure of heighth.
From Figure 2.16 we can deduce that under the hypothesis of small height
h in respect to the flying height H, the real relief displacement A0B could be conveniently replaced by the displacement A00B, obtained through orthogonal projection. So, for a small heighth, we can assume:
A0B∼=A00B (2.10)
Under this assumption, it is possible to define simply the relief displacement in a SAR image.
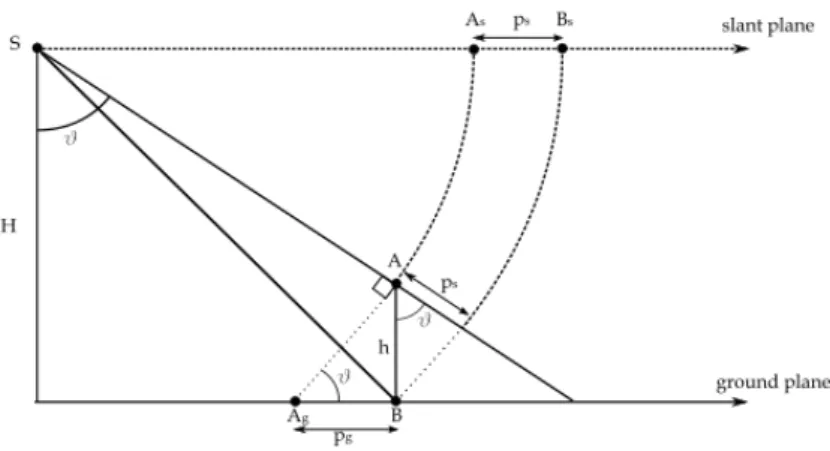
In both ground and slant range projection, the relief displacement,pgandps, is introduced. From Figure 2.17, using simple geometric relations, the form of the relief displacement in ground range projection reads:
pg∼=hcotϑ (2.11)
2.3. SAR images distortions and peculiarity
ps∼=hcosϑ (2.12)
Figure 2.16: Simplifying assumption for relief displacement
The same height hproduces a slightly smaller relief displacement in a slant range projection than it produces in a ground range presentation; this is the result of the overall compression of the image in a slant range projection, usual in a SAR image [25].
It is also obvious that the displacement increases with larger height h and with smaller side-look anglesϑ.
Foreshortening effect
The foreshortening occurs when a slope, having an aspect directed toward the satellite, is almost perpendicular the the line of sight; in this case the bottom and the top of the slope appear on the slant range projection closer than they are really (see Figure 2.18). This effect is maximum when the radar beam is perpendicular to the mountain slope (see Figure 2.18), where the slope might appear as a line in the image.
Layover effect
The layover occurs when a slope angle is greater than the side-look angle; in this case the signal reflected by the top of the slope is recorded before the signal reflected by the bottom (see Figure 2.18).
2.3. SAR images distortions and peculiarity
Figure 2.17: Relief displacement on a SAR image
Shadowing effect
The shadowing effect occurs when the radar beam is not able to illuminate the radar scene. This effect, that is shown in Figure 2.18, is considered as an optical shadow and induces a black area on the radar image because no reflected wave comes from this kind of region.
2.3.2
Response of soil
Because the dielectric constant for water is at least 10 times that for dry soil, the presence of water in the top few centimetres of bare, unvegetated soil can be detected in radar imagery, becoming particularly apparent at longer wavelengths.
2.3.3
Response of vegetation
A vegetation canopy will interact with radar waves as a group of volume scat-terers, as shown in figure?? above. The canopy is composed of a large number of discrete plant components, such as leaves, stems, stalks, limbs and so on. In addition, the canopy is underlain by soil that may result in surface scattering of the energy that penetrates the vegetation canopy. In general, shorter wave-lengths, of approximately 2 to 6 cm, are best for sensing crop canopies and tree leaves, because at these wavelengths volume scattering predominates and surface scattering from the underlying soil is minimised. However, longer wavelengths, of approximately 10 to 30 cm are best for sensing tree trunks or limbs.
2.3. SAR images distortions and peculiarity
Figure 2.18: Foreshortening, Layover and Shadowing effects
2.3.4
Response of water and ice
Smooth water surfaces yield no returns to the antenna, but rough water surfaces return radar signals of varying strengths. In addition, waves moving in the range direction, that is moving toward or away from the radar system, are easier to detect that waves moving in the azimuthal direction.
Radar backscatter from sea ice is dependent on the dielectric properties and spatial distribution of the ice. Such factors as ice age, surface roughness, internal geometry, temperature, and snow cover will also all play a role in the affect of radar backscatter.
Each of these above topics are discussed in more detail in the sections within the handbook relating to these applications.
2.4. SAR satellite missions
2.4
SAR satellite missions
2.4.1
COSMO-SkyMed
COSMO-SkyMed (COnstellation of small Satellites for Mediterranean basin Ob-servation) is the largest Italian investment in Space Systems for Earth Obser-vation, commissioned and funded by Italian Space Agency (ASI) and Italian Ministry of Defense (MoD), and it is natively conceived as a Dual-Use (Civil-ian and Defence) end-to-end Earth Observation System aimed to establish a global service supplying provision of data, products and services compliant with well-established international standards and relevant to a wide range of appli-cations, such as Risk Management, Scientific and Commercial Applications and Defence/Intelligence Applications.
The system consists of a constellation of four Low Earth Orbit mid-sized satel-lites, each equipped with a multi-mode high-resolution Synthetic Aperture Radar (SAR) operating at X-band and fitted with particularly flexible and innovative data acquisition and transmission equipment.
The system is completed by dedicated full featured Ground infrastructures for managing the constellation and granting ad-hoc services for collection, archiving and distribution of acquired remote sensing data [3].
Figure 2.19: COSMO-SkyMed satellite
The fourth satellite has been launched on November 6, 2010; it is the last component of the mission, that is now finally fully operational.
The set of requirements, imposed at highest level, has brought to the following needed performances:
• large amount of daily acquired images
• satellites worldwide accessibility
2.4. SAR satellite missions
Radar sensor X-band Radar frequency 9.60 GHz
Resolution 1 m, 3 m,15 m o 30 m Orbital altitude 619 km
Angle of inclination 97.86
Mission life time at least 7 years
Table 2.1: COSMO-SkyMed sensor characteristics
• very fine image quality (e.g. spatial and radiometric resolution)
• possibility of image spatial resolution trade-off with size, at most possible extent and including sub-meter resolution
The sensor characteristics are summarized in the Table ??. The Tandem interferometric configurations is supported, in which the two satellites fly in close proximity achieving the acquisitions with a temporal gap of 24 hours. In this case the coherence problem may be only attenuated but not totally solved as for the TerraSAR-X TanDEM mission (see section 2.4.2).
COSMO-SkyMed is able to operate in three different acquisition mode:
• SpotLight Mode: the antenna is steered during the acquisition time in order to illuminate the required scene for a time period longer than the one of the standard strip side view, increasing the length of the synthetic antenna and therefore the azimuth resolution (at expense of the azimuth coverage).
The two different implementation allowed for this acquisition mode are SMART (only for defence purposes) and the Enhanced SpotLight.
In Enhanced SpotLight the extension in azimuth direction is achieved by a antenna electronic steering scheme requiring the center of the beam steering to be located beyond the center of the imaged spot, thus increasing the observed Doppler bandwidth for each target.
The extension of the frame is about 11 Km×11 Km, in azimuth and range direction respectively, the ground resolution is about 1 m×1 m.
• Stripmap Mode: it is the most common imaging mode, obtained by pointing the antenna along a fixed direction orthogonal to the orbit. The antenna footprint covers a strip on the illuminated surfaces as the platform moves and the system operates. The acquisition is virtually unlimited in
2.4. SAR satellite missions
the azimuth direction, except for the limitations deriving from the SAR instrument duty cycle (about 600 s, allowing a strip length of 4500 km). Two different implementation of this mode are provided: the Himage and the PingPong.
The Himage is characterized by a swath width of about 40 km and, an azimuth extension for the standard product (square frame) of about 40 Km (corresponding to an acquisition of about 6.5 s); ground resolution is about 3 m×3 m.
In the PingPong mode the acquisition is performed in strip mode alternating the signal polarization between two of possible ones, i.e. VV, HH, HV and VH. In this polarimetric burst mode only a part of the synthetic antenna length is available in azimuth and consequently the azimuth resolution is reduced. This mode is characterized by a swath width value of about 30 km and an azimuth extension for the standard product of about 30 Km (square frame) corresponding to an acquisition of about 5.0 s; ground resolution is about 15 m×15 m.
• ScanSAR Mode: it allows larger swath in range with respect to the Stripmap one, but with a less spatial resolution, obtained by periodically stepping the antenna beam to neighbouring sub-swaths. Since only a part of the synthetic antenna length is available in azimuth, the azimuth resolution is hence reduced. In such configuration the acquisition is performed in adjacent strip mode, hence it is virtually unlimited in the azimuth direction, actually it is about 600 s due to the limitations deriving from the SAR instrument duty cycle.
The two different implementation are allowed for this acquisition mode are WideRegion and HugeRegion, with a spatial resolution selectable from 30 m×30 m to 100 m ×100 m.
In the WideRegion mode the swath extension in range direction is about 100 Km, corresponding to three adjacent subswaths. The azimuth extension for the standard product is about 100 Km (hence envisaged for the origination of a square frame) corresponding to an acquisition of about 15.0 s. In the HugeRegion mode the grouping acquisition over up to six adjacent subswaths allows achieving ground coverage of about 200 Km in the range direction. The azimuth extension for the standard product is about 200 Km (hence envisaged for the origination of a square frame) corresponding to an acquisition of about 30.0 s.
The COSMO-SkyMed products for civil users are divided in Standard and Higher level products [2].
2.4. SAR satellite missions
The SAR Standard products are the basic image products of the system, classified in many levels of processing, coded as follows:
• Level 0 RAW data: this data consists of time ordered echo data, obtained after decryption and decompression and after applying internal calibration and error compensation; it includes all the auxiliary data required to pro-duce the other basic and intermediate products
• Level 1A, Single-look Complex Slant (SCS) product: RAW data focused in slant range and zero Doppler projection, that is the sensor natural acquisition projection; product contains In-Phase and Quadrature of the focused data, weighted and radiometrically equalized
• Level 1B, Detected Ground Multi-look (DGM) product: obtained detecting, multi-looking and projecting the Single-look Complex Slant data onto a grid regular in ground (note that SpotLight Mode products are not multi-looked)
• Level 1C/1D, Geocoded product GEC (1C Level product) and GTC (1D Level product:) obtained projecting the 1A product onto a regular grid in a chosen cartographic reference system. In case of Lev 1C the surface is the Earth ellipsoid while for the Lev 1D a DEM (Digital Elevation Model) is used to approximate the real Earth surface. In Lev 1D data is constituted by the Backscattering coefficient of the observed scene, multi-looked (except for SpotLight Mode), including the annexed the Incidence Angles Mask
The SAR Higher Level products, suited for mid or even high level remote sensing applications, are composed by the following products:
• Quicklook: reduced spatial resolution image for browsing purposes
• Co-registered products: a set of image layers coregistered together (i.e. merged in vertical direction), for interferometry, change detection and so on
• Mosaiked products: a set of image joined together (i.e. merged in hori-zontal direction), for large spatial coverage representation
• Speckle filtered image: an image with an increased equivalent number of looks (ENL), obtained through various filters available (more details in [2])
• Interferometric products: interferometric coherence and phase, in sup-port of the interferometric applications
2.4. SAR satellite missions
• DEM products: digital elevation data and related height error map ob-tained with interferometric techniques
The data packaging organization adopted as distribution format for the civi-lian standard products is HDF5.
2.4.2
TerraSAR-X
TerraSAR-X is a commercial German synthetic aperture radar (SAR) Earth ob-servation satellite which was launched in June 2007 with a scheduled lifetime of 5 years. The satellite design is based on well-founded technology and knowl-edge achieved during the successful Synthetic Aperture Radar SIR-C/X-SAR and SRTM missions. It carries a high frequency X-band SAR sensor which can be operated in flexible imaging modes in order to meet the requirements of versatile applications.
Figure 2.20: TerraSAR-X satellite
The TerraSAR-X mission is a Public Private Partnership (PPP) between the German Ministry of Education and Science (BMBF) represented through the German Aerospace Centre (DLR) and Europe’s leading space company, EADS Astrium GmbH. Astrium successfully developed, integrated, and tested the satel-lite. Commercial distribution of TerraSAR-X data, value-adding, service develop-ment, and user training are the tasks of Infoterra GmbH, a 100ground segment for reception, processing, archiving and distribution of the X-band SAR data. DLR is also responsible for instrument calibration, the 5 years of operation and the scientific distibution of TerraSAR-X data within the TerraSAR-X science team.
It carries a high frequency X-band SAR sensor which can be operated in flexible imaging modes in order to meet the requirements of versatile applications.
2.4. SAR satellite missions
Radar sensor X-band Radar frequency 9.65 GHz Resolution 1 m, 3 m,16 m Orbital altitude 514 km Angle of inclination 97.4
Mission life time at least 5 years Table 2.2: TerraSAR-X sensor characteristics
It is very similar to its Italian competitor COSMO-SkyMed, without offering a satellite constellation however, and it can acquire imagery in several operational mode:
• SpotLight (SL):it an imaging modes that use phased array beam steering in azimuth direction to increase the illumination time, i.e. the size of the synthetic aperture. This leads to a restriction in the image/scene size. Two kinds of scene size are available: 10 km × 10 km for the SpotLight mode with 2 m resolution and 10 km × 5 km (width × length) in the HighResolution SpotLight (HS) mode with 1 m resolution.
• StripMap (SM):it is the basic SAR imaging mode, in which the ground swath is illuminated with continuous sequence of pulses while the antenna beam is fixed in elevation and azimuth. This results in an image strip with a continuous image quality (in flight direction).
In StripMap mode, a spatial resolution of up to 3 m can be achieved. The standard scene size is 30 km×50 m in order to obtain manageable image files; however, acquisition length is extendable up to 1,650 km.
• ScanSAR (SC): in this acquisition mode, electronic antenna elevation steering is used to acquire adjacent, slightly overlapping coverages with different incidence angles that are processed into one scene. In ScanSAR mode, a swath width of 100 km (and even more) will be achieved by scan-ning four adjacent ground sub-swaths with quasi-simultaneous beams, each with different incidence angle. Due to the switching between the beams, only bursts of SAR echoes are received, resulting in a reduced bandwidth and hence, reduced azimuth resolution.
In the ScanSAR mode a spatial resolution of up to 18 m is achieved. The standard scene size is 100 km × 150 km (width× length) for easily ma-nageable image files, but again, the acquisition length is extendable up to 1,650 km.
2.4. SAR satellite missions
Moreover TerraSAR-X can operate in “Standard TerraSAR-X operational mode”, with a single receive antenna mode, that uses a chirp bandwidth of up to 300 MHz, and in “Advanced imaging mode”, where a dual receive antenna is used.
The Basic Image Products of TerraSAR-X are [4]:
• Slant Range Product in SSC:The slant range product is a single-look product of the focused radar signal in Single Look Slant Range Complex (SSC). The pixels are spaced equidistant in azimuth (according to the pulse repetition interval PRI=1/PRF) and in slant range (according to the range sampling frequency).
The data are represented as complex numbers containing amplitude and phase information. Each image pixel is processed to zero Doppler coordi-nates in range direction, i.e. perpendicular to the flight track.
• Multi-look Ground Range Detected - MGD: This product is a de-tected multi look product with reduced speckle and approximately square resolution cells, with reduced spatial resolution. The image coordinates are oriented along flight direction and along ground range. The pixel spacing is equidistant in azimuth and in ground range.
• Geocoded Ellipsoid Corrected - GEC:The GEC is a multi-look de-tected product, which is resampled and projected to the WGS84 reference ellipsoid assuming one average height. The image is represented in map geometry with ellipsoidal corrections only, thus no terrain correction is per-formed. Available grid formats are UTM (Universal Transversal Mercator) and UPS (Universal Polar Stereographic). Since the ellipsoid correction does not use height information from a Digital Elevation Model (DEM) for geometric correction, the pixel location accuracy varies depending on the local terrain.
• Enhanced Ellipsoid Corrected - EEC: The EEC is a multi-look de-tected product as well, projected and resampled to the WGS84 reference ellipsoid. However, image distortions caused by varying terrain height are corrected using an external Digital Elevation Model (DEM) available at the payload ground segment (PGS), as SRTM global DSM [4]. The image is represented in map geometry with terrain correction. The available map projections are UTM or UPS. The pixel localization of this product is of a higher accuracy, however, it depends on the type of terrain, the quality and the resolution of the DEM used for the orthorectification, and the incidence angle of the acquisition.
2.4. SAR satellite missions
• Orthorectified Image - ORISAR:a highly accurate geocoded image with terrain correction included
• Radiometrically Corrected Image - RaNSAR: the products has an additional radiometric calibration or radiometric normalisation
• Mosaic - MCSAR:in order to cover a geographical area larger than a
stan-dard scene, neighbouring geocoded or orthorectified images are combined into one image in a seamless way
• Ascending/Descending Merge - ADMSAR:the ADMSAR product is an orbit merge, i.e. a combination of SAR images from ascending and descending right looking orbits is used for image analysis
In June 2010 a “twin” of TerraSAR-x was launched, the satellite TanDEM-X (TerraSAR-X Add-On for Digital Elevation Measurement). It is a radar satellite almost identical to TerraSAR-X, that circles the Earth together with TerraSAR-X as a unique satellite formation.
They are at only a few hundred meters and they record data synchronously in the so-called StripMap Mode (3 m ground resolution) and thus acquire the data basis for a intereferometric global Digital Elevation Model (DEM) of an un-precedented quality, accuracy, and coverage, since coherence problems are totally solved by the almost contemporary acquisition of the two images used to form the interferogram.
The goal of this mission is to have a homogeneous elevation model available for the Earth’s complete land surface in 2014. The expected vertical accuracy is of 2 m (relative) and 10 m (absolute), within a horizontal raster of approximately 12 m×12 m, slightly varying depending on the geographic latitude.
2.4.3
RADARSAT-2
Launched in December 2007, Canada’s next-generation commercial radar satel-lite offers powerful technical advancements that will enhance marine surveillance, ice monitoring, disaster management, environmental monitoring, resource man-agement and mapping in Canada and around the world.
This project represents a unique collaboration between government and indus-try. MacDonald, Dettwiler and Associates Ltd. (MDA) will own and operate the satellite and ground segment. The Canadian Space Agency helps fund the con-struction and launch of the satellite and will recover this investment through the supply of RADARSAT-2 data to the Government of Canada during the lifetime of the mission.
2.4. SAR satellite missions
Figure 2.21: Rasarsat-2 satellite Radar sensor C-band Radar frequency 5.404 GHz Resolution 1 m, 3 m,9 m Orbital altitude 798 km Angle of inclination 98.6
Mission life time at least 5 years Table 2.3: RADARSAT-2 sensor characteristics
This is achieved by leveraging the knowledge and experience gained through the long and successful RADARSAT-1 mission while taking advantage of new technologies.
A key priority of the Canadian Space Program is responding to the twin challenges of monitoring the environment and managing natural resources. The hardy, versatile RADARSAT Earth Observation satellites are a major data source for commercial applications and remote sensing science.
RADARSAT products also provide valuable information for major application areas in coastal and marine surveillance, and security and foreign policy [1].
It carries a high frequency C-band SAR sensor which can be operated in flexible imaging modes in order to meet the requirements of versatile applications.
• High-resolution images: The Ultra-Fine resolution mode, available on RADARSAT-2, acquires images at a spatial resolution of three metres. In this mode, the radar operates with the highest sampling rate, therefore the ground coverage is limited (10 to 30 km) to keep the acquisition within the recording limits. The Ultra-Fine imaging mode provides the one of the
2.4. SAR satellite missions
best resolution available commercially with a spaceborne SAR system. This better detect targets that are closely spaced and provide enhanced definition of other targets, thereby reducing ambiguities and increasing confidence in the data.
• Data polarization: RADARSAT-1 provided horizontal transmit and hor-izontal receive (HH) data only. RADARSAT-2 can transmit horhor-izontal (H) and vertical (V) polarizations and, depending on the selected mode, the sensor receives either H or V signals or both of the signals simultaneously. Therefore, in addition to providing complete RADARSAT-1 continuity, RADARSAT-2 generates products with VV polarization, cross-polarization (HV or VH), dual-polarization (HH+HV or VV+VH) or quad-polarization (HH+VV+HV+VH) over a range of spatial resolutions. This allows the end-user to select the combination that is best for the specific application. Each scattering element (HH, VV, HV and VH) has varying sensitivities to different surface characteristics and properties, helping to improve the discrimination between features. Moreover, polarimetric data can be used to characterize the polarimetric signature of various surface features, which is very useful in the study of scattering mechanisms and in resolving ambi-guities about the observed area.
• Dual-sided imaging: RADARSAT-1 has wide area coverage with its large accessibility swath. However, the revisit time for some latitudes can be a limiting factor in some applications. Left- and right-looking modes on RADARSAT-2 reduce the revisit time by one half and the accessibility swath is doubled. In effect, the market for SAR images expands as appli-cations that were not previously feasible will be given an opportunity to develop. Moreover, in emergency situations, the choice of beam mode and position can be set to ensure the greatest repeat coverage of the region of interest. Nominally, 10 minutes are required to switch from one side to the other. The flexibility of RADARSAT-2 makes it a powerful tool to support world mapping and disaster management activities.
RADARSAT-2 imaging modes
• Fine beam modes: Fine Beam modes are intended for applications which require higher spatial resolution and lower swath coverage. Fine Resolution Beams cover the incidence angle range from 30 ˆA◦ to 50 ˆA◦. This imaging mode is available in co-polarization, cross-polarization, dual-polarization and quad-polarization.
In addition, several new Fine Resolution products is available on RADARSAT-2, and the list of enhanced imaging modes follows.
2.4. SAR satellite missions
• Multi-look fineThe Multi-Look Fine Resolution Beam mode is the four-look version of the Fine Resolution mode, therefore providing the same spatial resolution with improved radiometric resolution. The four looks are made possible by the higher sampling rate of the RADARSAT-2 SAR. The Multi-Look Fine imaging mode is available in selective single polarization (HH or VV).
• Ultra-fine beam Ultra-Fine Beam modes of three-metre resolution is in-tended for applications which require very high spatial resolution. The Ultra-Fine Beam imaging mode is available in selective single polarization (HH or VV)
• Standard beam modesStandard Beams allow imaging over a wide range of incidence angles acquired in seven different modes referred to as S1 to S7. The incidence angles range from 20 ˆA◦at the inner edge of S1, to 49 ˆA◦at the outer edge of S7. Experience with RADARSAT-1 has demonstrated that the Standard Beam Mode generates image quality characteristics which pro-vide a good compromise between spatial resolution, radiometric resolution and image coverage. On RADARSAT-2 this imaging mode is available in copolarization, cross-polarization, dual-polarization and quad-polarization. Extended beam modes
• Low incidenceAn Extended Low Incidence Beam will cover the incidence angle range from 10 ˆA◦ to 23 ˆA◦ with a swath coverage of 170 km. At these incidence angles, the antenna operates beyond its optimum range, therefore some minor degradation of the image can be expected. The spatial resolution is the same as Standard Beams. This imaging mode is available in copolarization, cross-polarization and dual-polarization.
• High incidence The incidence angle range beyond 49 ˆA◦ is covered with the High Incidence Beams up to 60 ˆA◦. As with the Low Incidence Beams, minor degradation of the image can be expected due the operation of the antenna outside its optimal range. The spatial resolution is the same as Standard Beams. This imaging mode is available in co-polarization, cross-polarization and dual-cross-polarization.
• Wide swath mode Wide Swath Beams allow the coverage of a larger region than the Standard Beam at the expense of a slightly coarser spatial resolution. Three Wide Swath Beams cover a range on incidence angles from 20 ˆA◦to 45 ˆA◦. This imaging mode is available in copolarization, cross-polarization and dual-cross-polarization.
2.4. SAR satellite missions
• ScanSAR modeScanSAR imagery is generated with a combination of sin-gle beams covering adjoining swaths. This provides the largest swath cover-age available in RADARSAT-2 products. However, the increased covercover-age is obtained at the expense of spatial resolution. ScanSAR imaging mode is available in copolarization, cross-polarization and dual-polarization.
Chapter 3
Radargrammetry
3.1
Digital Elevation Model
Digital Elevation Model (DEM) is simply a statistical representation of the con-tinuous surface of the ground by a large number of selected points with know X, Y, Z coordinates in an arbitrary coordinate field [13]. It is possible to distinguish between DSM (Digital Surface Models) and DTM (Digital Terrain Models
• the Digital Surface Model is the representation of the first reflective or visible surface, including trees, buildings, and any other features which is elevated above the ground;
• the Digital Terrain Model is the representation of the bare terrain, without any objects.
Figure 3.1: DSM and DEM
DEMs provide important knowledge of the area analyzed, therefore they are gaining growing relevance in several surveying applications:
3.1. Digital Elevation Model
• extracting terrain parameters;
• modeling water ow or mass movement (for example avalanches);
• rendering of 3D visualizations;
• creation of physical models (including raised-relief maps);
• rectification of aerial photography or satellite images;
• reduction (terrain correction) of gravity measurements (gravimetry,physical geodesy);
• terrain analyses in geomorphology and physical geography.
There are different methodologies to extract the digital elevation models: DEMs can be produced by automatic extraction from stereo satellite scenes ; they can be provided from Stereo Digital Aerial Photography at various reso-lutions; they can be generated by interpolating digital contour maps that may have been produced by direct survey of the land surface; they can be obtained by means of LIDAR (Laser Imaging Detection and Ranging) or using the Inter-ferometric or Radargrammetric (procedure followed during the this) Synthetic Aperture Radar. Each of the listed techniques gives a different result in terms of accuracy and has advantages as well as disadvantages; hence the choice of the method depends on the requirements of the tasks to be accomplished.
The qualities of DEM products are assessed by how accurate the elevation is at each pixel, and how accurately the morphology is presented. Several factors are important to defne the quality of DEM-derived products:
• Terrain roughness;
• Sampling density (elevation data collection method);
• Grid resolution or pixel size
• Interpolation algorithm;
• Vertical resolution;
• Terrain analysis algorithm.
In the recent years, digital sensors carried on the spacecraft have enabled the generation of high resolution DEMs even over vast and hardly reachable areas, where the organization of tradition aerial photogrammetric flights results particular difficult and expensive.
3.2. Radrgrammetric approach
3.2
Radrgrammetric approach
Radargrammetry is the technology of extracting geometric object information from SAR imagery.
Similarly to photogrammetry, radargrammetry forms a stereo model for 3D reconstruction.
Stereoscopic 3D reconstruction is an important process in the field of Com-puter Vision and refers to the ability to infer information on the 3D structure and distance of a scene, from a stereo pair of images . Stereo images are captured in the same way the human eyes capture scenes, and can provide depth infor-mation, just as human eyes provide perception about depth. While a 2D image provides only height and width, 3D reconstruction of the 2D image extends the information to a third dimension, depth. The major task of 3D reconstruction is to find the location of an object of interest in the left image and the location of that same object in the right image, with the objective of computing the dispar-ity between the two objects, and eventually using this information to reconstruct the 3D scene. The 3D image reconstruction algorithms have been widely used in 3D imaging systems and to capture 3D surface information, as well as medical imaging [17].
The differences between images can be measured to establish a disparity map, that is used in radargrammetry to compute the terrain elevation from the mea-sured parallaxes between the two images[36].
A simplified model is shown in Figure 3.2, where the area is flat, the flight lines are parallel and the height flight is constant; the Equation 3.1 is the relation for the height computation in case of slant-range projection, wherehdenotes the height of the scattered point, p1,2 the absolute parallax and ϑ1,2 the incidence
angles, the denominator sign “±” depends on the flight configuration, “+” for opposite-side and “−” for same-side stereo pair [14].