ADBI Working Paper Series
Small and Medium Enterprises in
Japan: Surviving the Long-Term
Recession
Shuji Uchikawa
No. 169
October 2009
The views expressed in this paper are the views of the authors and do not necessarily reflect the views or policies of ADBI, the Asian Development Bank (ADB), its Board of Directors, or the governments they represent. ADBI does not guarantee the accuracy of the data included in this paper and accepts no responsibility for any consequences of their use. Terminology used may not necessarily be consistent with ADB official terms.
The Working Paper series is a continuation of the formerly named Discussion Paper series; the numbering of the papers continued without interruption or change. ADBI’s working papers reflect initial ideas on a topic and are posted online for discussion. ADBI encourages readers to post their comments on the main page for each working paper (given in the citation below). Some working papers may develop into other forms of publication.
Suggested citation:
Uchikawa, S. 2009. Small and Medium Enterprises in Japan: Surviving the Long-Term Recession. ADBI Working Paper 169. Tokyo: Asian Development Bank Institute. Available: http://www.adbi.org/working-paper/2009/11/27/3388.japan.sme.recession/
Asian Development Bank Institute Kasumigaseki Building 8F 3-2-5 Kasumigaseki, Chiyoda-ku Tokyo 100-6008, Japan Tel: +81-3-3593-5500 Fax: +81-3-3593-5571 URL: www.adbi.org E-mail: info@adbi.org
Abstract
The relationship between large enterprises (LEs) and small and medium enterprises (SMEs) in Japan has undergone major changes during the long-term recession since 1991. While SMEs still play the important role of supplying parts and components to LEs through subcontracting, many LEs have started to reduce the number of their suppliers and the components they use in manufacturing. While efficient SMEs selected by LEs were able to expand their businesses, inefficient SMEs lost customers. The regression results in this study suggest that the decrease in number of establishments—specifically, the exit of inefficient SMEs—might improve total factor productivity growth rates. The traditional business model of being dependent on certain LEs and doing business within the cluster is not functioning as well as it used to. Heavy dependence on certain industries and highly segmented and specialized production processes prevent the clusters from adjusting to the new business environment. Some SMEs are still able to create new business by taking advantage of more flexible divisions of labor. SME policies must encourage diversification and collaboration that cut across traditional industry groupings to form a flexible division of labor.
Contents
1. Introduction ... 1
2. The Future of Japanese SMES ... 1
2.1 Subcontracting ... 1
2.2 Relation-Specific Skills ... 3
2.3 Changes in the Subcontracting System ... 3
2.4 Long-Term Downward Trends in Entry Rates ... 4
3. Impacts of Long-Term Recession ... 7
4. Regional Variation of Industrial Clusters ... 15
5. SME Policies in Japan ... 17
6. Results of Field Survey ... 18
7. Policy Recommendations ... 22
1. INTRODUCTION
Small and medium enterprises (SMEs) have long played an important role in supplying parts and components to large enterprises (LEs) in Japan through subcontracting. However, the relationship between LEs and SMEs has changed under the long-term recession since 1991. The streamlining of procurement by the LEs led to the selection of only the efficient subcontractors. While efficient SMEs can get more orders and can invest to improve their capacity, the inefficient ones lost business opportunities. During the long-term recession, the so-called “three excesses”—excess debt, excess capacity, and excess employment—had put a burden on all enterprises including SMEs. This paper examines the trends of the three excesses in SMEs.
SME policies need to be reviewed both from the industrial policy and regional policy standpoints. Industrial clusters can also be grouped into four types according to how they were formed historically and according to their characteristics. This paper investigates the trends and characteristics of four types of industrial clusters. Although the number of establishments has declined in all types of industrial clusters, some clusters are trying to activate local economy by diversifying their businesses and converting to high value-added areas.
SME policies in Japan have been modified to adjust to changing economic situations. The policy concept had already been changed from modernization to business conversion in the 1980s. Moreover, business innovations and start-ups were encouraged in the 1990s. The Small and Medium Enterprise Basic Law was revised fundamentally in 1999. The previous law defined companies with capital of less than 100 million yen (¥) or employing less than 301 employees as SMEs. The revised law raised the capital size of SMEs from ¥100 million to ¥300 million. This paper is based on the definition of the previous law.
The purpose of this paper is to come up with policy recommendations to support manufacturing SMEs based on the analysis of trends among SMEs. These recommendations are presented in the conclusion.
2. THE FUTURE OF JAPANESE SME
S
2.1
Subcontracting
In Japan, a multi-tier subcontracting system based on specialization was established to help develop the supporting industry during the rapid economic growth period in the 1960s and 1970s. The supporting industry is defined as the industry that supports assembly industries, such as electrical machinery and automobiles, by supplying parts and components, die, and mold. SMEs are main players in the supporting industry.1 As the technology available to
assemblers improved, so did that of SMEs in the supporting industry. An efficient division of labor between SMEs and LEs has been established in the electrical machinery and automobile industries. Subcontracting has contributed to the improvement of production efficiency in the Japanese manufacturing sector. Urata and Kawai (2001) credited the growth of total factor productivity (TFP) in the Japanese manufacturing sector between 1972 and 1986 to active patent introduction and active participation in subcontracting. Although the multi-tier subcontracting system has been changing, the efficient division of labor between SMEs and LEs is still working. This system can be considered a factor in the improvement of the production efficiency and competitiveness of Japanese manufacturing. Typical subcontracting is observed in the electrical machinery and automobile industries. This paper
1SMEs in the supporting industry belong to various categories of industrial classification, such as
focuses on subcontracting in general machinery, electrical machinery, transportation equipment, and precision machinery. These industries accounted for 46% of the value added of the manufacturing sector in 2007.
In Japan, major electrical machinery and automobile companies procure parts and components from three sources. First, they produce parts and components in their own factories using their own staff or resources. Second, they purchase parts and components from the market. The transactions with suppliers depend on market prices and are usually short term in nature. Third, they purchase parts and components from subcontractors based on long-term commitments. Economic theories try to explain why subcontracting is an efficient method of procurement for assemblers. Kimura (2001) summarized the theoretical foundation of subcontracting in terms of transaction cost, game theory, economics of information, and network approaches, and pointed out that technological characteristics are the key for an industry to develop a subcontracting system. LEs choose subcontracting when the upstream production requires specialized technology. This argument is based on the premise that efficient and reliable SMEs are available in Japan.
Figure 1 shows the typical four-tier structure of subcontracting. In the top tier are the LEs, which include not only assemblers of electrical appliances and automobiles, but also manufacturers of complete components. Some automobile component manufacturers are multinational enterprises, and their capital size is larger than that of automobile assemblers.2
Large electrical machinery companies supply auto components to automobile assemblers. Transactions among LEs in the top tier are not subcontracting. LEs have factories assembling products in different areas. Clusters of SMEs specializing in specific products have been formed to supply the factories of the LEs. The rise and fall of these clusters depend on the condition of the factories that function as the core of the clusters.
Figure 1: Structure of Subcontracting
F F i r s t T i e r L E s Second Tier L a r g e a n d M e d i u m Fourth Tier T i n y a n d S m a l l E n t e r p r i s e s T h i r d T i e r S m a l l a n d M e d i u m Source: Author.
In the second tier are the medium and large enterprises that assemble components and supply them to LEs in the first tier. The enterprises in the second tier have three common abilities. First, they have specialized technology that others cannot imitate. Second, they can play the role of coordinator of SMEs. The enterprises in the second tier procure parts from SMEs in the third tier and assemble them. As they can control the quality and delivery of
2 The common stock of Denso (an automobile component manufacturer) was pegged at ¥187.4
million on 31 March 2007 while Suzuki’s (an automobile assembler) was ¥120 million on the same day.
components and, therefore, can reduce total production costs, LEs benefit from this relationship by saving on overhead costs associated with controlling and coordinating SMEs. In the case of Toyota, while the company is indirectly linked with more than 30,000 enterprises, it also has direct transactions with hundreds of enterprises. Third, they have design ability. It is common for LEs to give rough designs to the enterprises in the second tier, which then draw up the specifications. In many cases, enterprises in the first and second tiers co-develop components for new products (Yoshida 1997).
Meanwhile, SMEs in the third tier specialize in specific processes and produce parts. They are also expected to meet demands on cost, quality, and delivery from their customers. Tiny and small enterprises in the fourth tier are mostly family owned and managed, and take charge of relatively simple processes at low margins. Due to their size, the management base of enterprises in the third and fourth tiers are generally weak.
There is a significant gap between wages in LEs in the first tier and those of SMEs in the third and fourth tiers. In 2007, while the per capita annual value of total cash wages and salaries was ¥3 million in enterprises employing four to nine people, those of enterprises employing 1,000 or more persons was ¥6.7 million (Government of Japan, Ministry of Economy, Trade, and Industry 2009). LEs can save on labor costs by subcontracting. More important, however, is that subcontracting is dependent on specialization (e.g., in part and component production) in the electrical machinery and automobile industries.
2.2
Relation-Specific Skills
Subcontracting does not necessarily entail a rigid and exclusive contract. Electrical machinery and automobile companies produce many models and change models regularly. Specifications for each part of the new model as well as the price thereof are determined during the development period prior to the model change. Once a subcontractor receives an order for a part (when the commercial production of a new model is launched), the order is normally renewed or continued. There is a tendency for LEs to assign the responsibility for supplying a part for a specific model to a single subcontractor to avoid duplicate investment. But, when the life of a given model comes to an end, there is no guarantee that a subcontractor that has been supplying a part for that model will receive an order for the same kind of part for the new model.
Subcontractors must meet the demands of a parent company at three critical points: (i) price reduction by some targeted percentage within a certain time span, reflecting efforts to reduce costs; (ii) high reliability in quality assurance; and (iii) high reliability in keeping up with the delivery schedule. On the other hand, parent companies support improvements in production efficiency by subcontractors through technical assistance, such as training subcontractors’ employees and dispatching engineers to subcontractors’ factories. Moreover, learning through repeated interactions with a particular parent company results in new skills being developed in addition to the basic technological capability that subcontractors accumulate. Asanuma (1989) referred to this accumulated learning as a relation-specific skill and noted that it usually leads to competitive spot bidding on the part of the subcontractors if the transaction is repeated often enough over a certain period.3
2.3
Changes in the Subcontracting System
Japan’s subcontracting system has changed during the long-term recession that began in 1991. Japanese automobile companies, including major complete component
3 Asanuma focused on the relations between typical LEs that manufacture the final products of the
automobile and electrical machinery industries and the companies that supply repeatedly transacted parts.
manufacturers, have changed their procurement strategies in three ways and have reduced transactions with subcontractors.
First, they began to procure components from subcontractors under different parent companies. Cross-group transactions became common in the Japanese market. Moreover, automobile companies gave up their strategy of producing all parts and components within the same company groups. They sold their non-earning subcontracting companies to other companies and concentrated on their high-performing sections.
Second, automobile manufacturers reduced the number of components they use. During the economic boom in the second half of the 1980s, they increased the number of models and even included different components within the same model to attract customers through product distinction. Naturally, this raised the number of man-hours on the assembly line and the research and development (R&D) and production costs of components. During the recession, however, manufacturers tried to use common components for different models to reduce the number of components. Moreover, some companies formed tie-ups with different companies to share common components. As the reduction of items encouraged the standardization of components, lot production of items increased and component manufacturers started to benefit from economies of scale. Meanwhile, automobile assemblers concentrated on efficient component manufacturers. 4 Hence, inefficient
manufacturers began to lose clients.
Third, large automobile and component manufacturers increased the share of parts and components they produced in-house. They did this for several reasons. Reduced demand during the long-term recession made many laborers redundant and their capacity was underutilized. Thus, LEs that had been outsourcing the production of parts and components began to produce them in-house to use redundant laborers. Also, the standardization of components induced by the reduction of items made production of components in-house more profitable due to economies of scale. The development of microelectronics reduced the range of skills required—a definite advantage for the SMEs. Quality control and production management is easier to do in-house. As technology developments reduced the number of man-hours needed on the assembly lines in LEs, the space and labor needed to produce parts and components in-house became available (Yoshida 1997).
A similar phenomenon can be observed in the electrical machinery industry.5 The
streamlining of procurement by the LEs led to the selection of only the most efficient subcontractors. LEs terminated transactions with inefficient subcontractors, possibly leading to the observed bipolarization among SMEs.
The change in LE procurement policies made subcontracting between LEs and SMEs unstable. In some cases, parent companies made unfair demands of subcontractors, such as requiring them to reduce the prices of components after an agreement had been made. In other cases, contracts were terminated suddenly before the agreed upon date.
2.4
Long-Term Downward Trends in Entry Rates
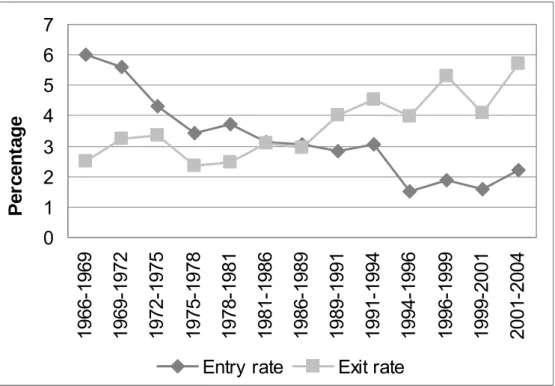
The number of manufacturing establishments employing four to 299 people steadily declined from 434,754 in 1985 to 254,675 in 2007. The sharp decline in the number of establishments was caused not only by the abolishment of enterprises but also by the lower number of enterprises entering the economy. As shown in Figure 2, the entry rate has experienced a prolonged decline since the 1970s. The main factor behind this appears to be the trend in sole proprietorships, which account for a huge number of Japanese enterprises. This
4 In 1999, Nissan announced its procurement policy to reduce its parts and components suppliers
from 1,145 to less than 600 before March 2002.
5 In 2009, Sony announced its procurement policy to reduce its parts and components suppliers from
2,500 to 1,200 before the end of 2010.
phenomenon, however, should not be regarded entirely as a problem of sole proprietorships because they have the potential to grow and employ more people. The exit rate has been higher than the entry rate since 1989–1991.
Figure 2: Trends in Entry and Exit Rates
0
1
2
3
4
5
6
7
1966-1969
1969-1972
1972-1975
1975-1978
1978-1981
1981-1986
1986-1989
1989-1991
1991-1994
1994-1996
1996-1999
1999-2001
2001-2004
Pe
rc
e
nt
a
g
e
Entry rate
Exit rate
Note: The entry rate indicates (1) the average number of establishments launched during a particular period as a proportion of (2) the number of establishments already in existence at the start of the period, and is calculated by dividing (1) by (2). The exit rate is calculated in a similar manner.
Source: Small and Medium Enterprise Agency (SMEA) (2007).
The White Paper on Small and Medium Enterprises in Japan (Small and Medium Enterprise Agency [SMEA] 2005) points out a long-term downward trend in the employer-to-employee income ratio in the manufacturing sector at the macro level (Figure 3). It regards the net operating profit of each establishment as employer income. The Ministry of Internal Affairs and Communications’ Unincorporated Enterprise Survey has data on the manufacturing sector’s average net operating profit per establishment. The Ministry of Health, Labor, and Welfare’s Basic Survey on Wage Structure also has data on the sector’s average annual income of regular employees in establishments with more than nine regular personnel. The employer-to-employee income ratio is calculated by dividing the average annual income of regular employees by the average net operating profit per establishment. The income of employees has risen in absolute terms in enterprises of all sizes since 1974. This rise is more prominent than the rise in the absolute level of entrepreneurs' incomes. The downturn in entrepreneurs' incomes in the 1990s accelerated the decline of the employer-to-employee income ratio. The average annual net operating profit per establishment went down from ¥5.2 million in 1993 to ¥3.1 million in 2006.
Figure 3: Trends in Employer-to-Employee Income Ratio in Manufacturing 0.40 0.60 0.80 1.00 1.20 1.40 1.60 1.80 2.00 2.20 19 73 19 75 19 77 19 79 19 81 19 83 19 85 19 87 19 89 19 91 19 93 19 95 19 97 19 99 20 01 20 03 20 05 (Ratio)
Note: The employer-to-employee income ratio is calculated by dividing the average annual income per regular employee by the average net operating profit per establishment.
Sources: SMEA (2005); Government of Japan, Ministry of Health, Labor, and Welfare, Basic Survey on Wage
Structure(available: http://www.mhlw.go.jp/english/database/db-l/index.html [accessed 19 November 2009]);
Government of Japan, Ministry of Internal Affairs and Communications, Statistics Bureau, FY 2008
Unincorporated Enterprise Survey,Trend Survey(available: http://www.e-stat.go.jp/SG1/estat/
ListE.do?lid=000001054597 [accessed 19 November 2009]).
Genda and Kanbayashi (2002) analyzed the micro data and concluded that the probability of being self-employed decreased greatly among middle-aged workers in both urban and rural areas from 1989 to 1994. As labor-intensive processes shifted from metropolitan to rural areas, many LEs and SMEs set up factories during the 1980s. Employment opportunities in factories increased dramatically even in rural areas (Kato 2003). The relative decline in the incomes of self-employed workers appears to have reduced self-employment and decreased the entry rate of businesses into the economy.
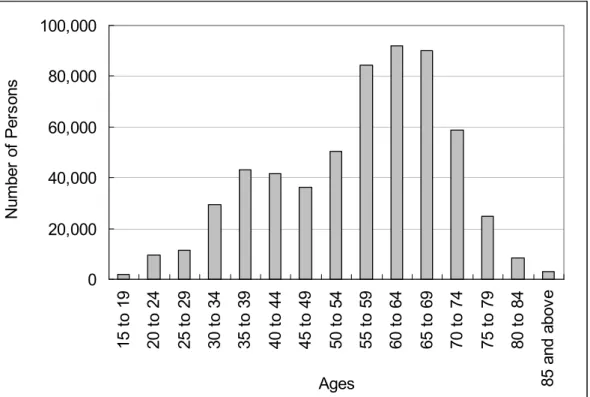
Moreover, the younger generation has lost interest in setting up enterprises or joining family businesses as they have a better chance of getting a high, stable salary elsewhere. The opportunity cost of setting up a business varies according to each individual and time period. In the late 1960s and early 1970s, the peak of the age-wage curve for SMEs was people in their thirties. Many SME entrepreneurs set up their own factories at this age because of their meager salaries as employees (SMEA 1979). For many employees who did not have a high level of education, starting their own businesses was the better option as it was difficult for them to get a job with a high, stable salary. Setting up their own businesses was a chance to improve their incomes while using their skills. Today, this generation has reached retirement age, but many are still running their businesses due to the absence of successors. In 2007, for instance, 47% of self-employed workers in the Japanese manufacturing sector were at least 60 years old (Figure 4). Many SMEs have already shut down their establishments and more are likely to follow owing to the lack of successors to the top position.
Figure 4: Structure of Self-Employed Workers in Japanese Manufacturing, According to Age 0 20,000 40,000 60,000 80,000 100,000 15 t o 19 20 t o 24 25 t o 29 30 t o 34 35 t o 39 40 t o 44 45 t o 49 50 t o 54 55 t o 59 60 t o 64 65 t o 69 70 t o 74 75 t o 79 80 t o 84 85 and abov e Ages N um ber of Per sons
Source: Government of Japan, Ministry of Internal Affairs and Communications, 2007 Employment Status Survey (available: http://www.e-stat.go.jp/estat/html/NewList/000001017285/NewList-000001017285.html [accessed 19 November 2009]).
Advanced machinery is necessary to meet the rising demands of customers. SMEs cannot maintain their businesses without advanced technology and accumulated skills. Thus, entry into manufacturing, particularly for the younger generation, has become more difficult—and costly—than it was during the 1960s. In addition, Japanese SMEs are facing stiff competition from importers of cheap goods from overseas.
3. IMPACTS OF LONG-TERM RECESSION
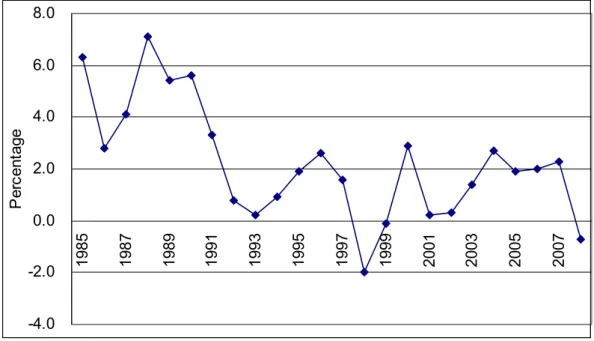
The Japanese economy has been facing long-term recession with deflation since 1991. Although gross domestic product growth rates recovered slightly in the mid-1990s, they became negative in 1998 and 1999 (Figure 5). Nonperforming assets became a serious problem in those years and SMEs faced financial difficulties due to the non-availability of bank loans. The shrinking domestic market affected the performance of the manufacturing sector and enterprises were burdened by the so-called “three excesses,” namely, excess debt, excess capacity, and excess employment.
Figure 5: Gross Domestic Product Growth Rates -4.0 -2.0 0.0 2.0 4.0 6.0 8.0 19 85 19 87 19 89 19 91 19 93 19 95 19 97 19 99 20 01 20 03 20 05 20 07 Pe rc en ta ge
Source: Government of Japan, Cabinet Office web site (available:
http://www.esri.cao.go.jp/en/sna/qe093/gdemenuea.html [accessed 19 November 2009]).
Figure 6 shows the interest-bearing debt redemption trend among SMEs and LEs between 1986 and 2007. The period is estimated by dividing outstanding interest-bearing debt at the end of each quarter by annual cash flow. Outstanding interest-bearing debt consists of short-term borrowing, long-short-term borrowing, and corporate bonds. Cash flow is calculated by adding half of the annual ordinary profit and depreciation expenses. The debt redemption periods for LEs and SMEs were 5.7 and 6.2 years at the end of the first quarter of 1986. During the economic boom, the gap between SMEs and LEs was smaller. While recession decreased ordinary profit, long-term debt rose continuously and the debt redemption period went up rapidly in the second half of 1993. Banks did not want to restrict themselves from extending loans to SMEs simply because they were afraid that their loans would become nonperforming assets. As a result, banks increased long-term loans to SMEs between 1990 and 1995 in spite of the recession. However, additional loans to avoid financial crunch made excess debt in SMEs more serious. As long-term debt decreased in 2001, financial strength started to improve in 2003. But this does not mean that the financial conditions of all SMEs improved. Some SME went bankrupt with the accumulation of debt and ultimately disappeared from the market.
Figure 6: Trends in Debt Redemption Periods 2 4 6 8 10 12 14 19 86 19 89 19 92 19 95 19 98 20 01 20 04 20 07 R e de m pt ion P e ri ods ( Y e a rs ) LE SME
LE = large enterprise, SME = small or medium enterprise. Notes:
1. The Database of Financial Statements Statistics of Corporations by Industry covers companies with more than ¥1 million capital, thus, tiny SMEs are excluded from this data.
2. Interest-bearing debt repayment period = outstanding interest-bearing debt / cash flow.
3. Outstanding interest-bearing debt = short-term borrowing + long-term borrowing + corporate bonds. 4. Cash flow = ordinary profit x 0.5 + depreciation expenses.
5. The moving average for the past four quarters is used for the interest-bearing debt repayment period.
Source: Government of Japan, Ministry of Finance, Database of Financial Statements Statistics of Corporations by Industry (available: http://www.fabnet2.mof.go.jp/nfbsys/Nennhou_oy.htm [accessed 10 February 2009]).
The value added of SMEs employing 4–299 people (based on 2000 price index) started to decline in 1991, but recovered and reached its peak in 1997. The year 1997 was a turning point. Table 1 suggests that small establishments have declined. The number of establishments employing 4–29 people decreased by 1.5% per annum between 1985 and 1997. The downward trend accelerated after 1997. During the recession period, many establishments closed down. The number of smaller establishments decreased faster and the number of establishments owned by LEs also went down. Although many factors caused the decline in the number of SMEs, the long-term recession is still the main reason. Excess debt had a significant effect on SMEs during the recession and forced many SMEs to exit the market. As expected, employment in SMEs with 4–299 employees also decreased by 1.2% per annum between 1985 and 1997. The decline became sharp after 1997. Because SMEs accounted for a large share of manufacturing establishments, employment in this sector went down significantly after 1997. The exit of some SMEs might have led to a reduction of excess capacity and excess employment in SMEs. Conversely, labor productivity has grown in all sizes of establishments in spite of negative or negligible growth between 1997 and 2007. The exit of inefficient companies might have actually improved labor productivity.
Table 1: Trends of Manufacturing Establishments Employing More Than Three Employees, According to Size
(%) Size (Number of Employees) Number of Establishments (1) Number of Employees (2) Value Added at 2000 Prices** (3) Labor Productivity (3)/(2) 1985– 1997 1997– 2007 1985– 1997 1997– 2007 1985– 1997 1997– 2007 1985– 1997 1997– 2007 4–29 -1.5 -4.3 -1.2 -3.6 2.5 -2.8 2.5 0.8 30–99 -0.3* -2.4 -0.2* -2.2 3.8 -1.6 3.8 0.6 100–299 0.2* -0.7 0.3* -0.6 4.6 0.5 4.6 1.1 300 and above 0* -0.6* -0.3* -1.2 3.5 0 3.5 1.2 All -1.3 -3.9 -0.5* -2.0 3.6 -0.6 3.6 1.4 Notes:
* Statistically insignificant at 95% confidence level.
**Value added is deflated by corporate goods price index of 2000 base (average index for domestic corporate goods, exports and imports) for manufacturing industry products.
Source: Government of Japan, Ministry of Economy, Trade, and Industry, Census of Manufacturers (available: http://www.meti.go.jp/statistics/tyo/kougyo/archives/index.html [accessed 19 November 2009]).,
To examine the effects of excess capacity and excess employment, TFP in the general machinery, electrical machinery, transportation equipment, and precision machinery industries was calculated for four categories according to number of employees: 30–99, 100–299, 300–999, and more than 999. This paper adopts the growth accounting approach based on two-input frameworks, taking single deflated value added as output, and labor and capital as inputs. The Translog index of TFP growth is arrived at by using the following equation:
SL(t)+SL(t-1) SK(t)+SK(t-1)
ΔlnTFP(t)= ΔlnY(t)-[ ×ΔlnL(t)]-[ ×ΔlnK(t)] (1)
2 2
In the above equation, Y denotes value added, L denotes labor, and K denotes capital. Δln Y(t) = ln Y(t) – ln Y(t-1). In the same way, Δln L(t), and Δln K(t) are defined. SL is the income
share of labor, and SK is the income share of capital. SL and SK add up to one. Using the
above equation, the growth rates of TFP are computed for each year.
The basic source of data used for the productivity estimates is the Census of Manufacturers. To make price corrections on the reported data on value added, suitable deflators were selected from the corporate goods price index. Capital input series were created, allotting data from the Annual Report on Gross Capital Stock of Private Enterprises (Government of Japan, Cabinet Office 2009) into four size groups. The estimates are shown in Figures 7a– 7d. TFP growth rates express different trends, depending on employment size in the transportation equipment and precision machinery industries.
Figure 7a: Trends of TFP Growth in the General Machinery Industry
Figure 7b: Trends of TFP Growth in the Electrical Machinery Industry
Figure 7c: Trends of TFP Growth in the Transportation Equipment Industry
Figure 7d: Trends of TFP Growth in the Precision Machinery Industry
Note: The moving average for three years is used. Source: Author.
Trends of excess debt and excess capacity may affect TFP growth rates in the four industries. A multiple regression analysis was used to study these effects on TFP growth rates. The analysis was based on pooled cross-section and time-series data. The regression equation is specified as:
TFPGit = α+β1ESTit +β2 RED+β3URit + u (2)
In this equation, TFPGit is the growth rate of TFP in industry i in year t; ESTit is the rate of
change in the number of establishments in industry i in year t; RED is the rate of change in
the interest-bearing debt redemption period in industry i in year t; and UR it is the rate of
change in the utilization rates of capacity in industry i in year t. The regression equation is
estimated by the fixed-effects model with the year dummy (to identify a dramatic change in a specific year) and without it.
The Ministry of Finance’s Database of Financial Statements Statistics of Corporations by Industry categorizes companies into four groups according to capital size: ¥10–50 million, ¥50–100 million, ¥100 million–¥1 billion, and more than ¥1 billion. As the classification of Census of Manufacturers depends on the number of regular employees, conversion is necessary to use the data from both sources. This paper assumes that enterprises with a capital of ¥10–50 million employ 30–99 people, enterprises with a capital of ¥50–100 million employ 100–299 people, enterprises with a capital of ¥100 million–¥1 billion employ 300– 999 people, and enterprises with a capital of more than ¥1 billion employ more than 999 people. The Establishment and Enterprise Census of Japan has created a table differentiating enterprises by industry, number of regular employees, and amount of capital. Table 2 shows the percentage of enterprises that meet the above-mentioned capital size conditions for each employment size category. Although enterprises with a capital of ¥50– 100 million and ¥100 million–¥1 billion constitute a relatively small share of those employing 100–299 and 300–999 employees, respectively, enterprises with a capital of ¥10–50 million and more than ¥1 billion account for more than 70% of enterprises employing 30–99 and 1,000 or more employees, respectively.
Table 2: Percentage of Enterprises That Meet Both Conditions on Employment Size and Capital Size in Total Number of Enterprises in 1999
(%) Number of Regular Employees General Machinery Electrical Machinery Transportation Equipment Precision Machinery 30–99 75.5 70.1 75.4 75.9 100–299 31.2 24.6 28.3 32.6 300–999 38.2 45.3 50.2 40.8 1,000 or more 86.8 76.7 82.9 73.5
Note: The assumption of conversion is based on the following: Enterprises with capital of ¥10–50 million employ 30–99 people. Enterprises with capital of ¥50–100 million employ 100–299 people. Enterprises with capital of ¥100 million–¥1, billion employ 299–999 people. Enterprises with capital of more than ¥1 billion employ more than 999 people.
Source: Government of Japan, Ministry of Internal Affairs and Communications, 1999 Establishment and Enterprise Census (available: http://www.e-stat.go.jp/SG1/estat/ListE.do?bid=000000290031&cycode=0 [accessed 19 November 2009]).
While the TFP estimates were based on the assumption of full utilization of capacity, the TFP growth rates might depend on underutilization of capacity due to the recession. This study estimates utilization rates on the basis of minimum capital output ratio (Sastry 1984). Capital output ratios are calculated. A benchmark year is then selected on the basis of the observed lowest capital output ratio. It is considered as capacity output. The estimate of capacity is obtained by dividing real capital stock by the minimum capital output ratio. The utilization rate is given by actual output as a proportion of the estimated capacity.
Thus, O U = ・100 C C C = ・100 (C/O)min
where U is capacity utilization, O is gross value added, and C is the estimated capacity. This estimation is crude but there are no better estimates of capacity utilization (Goldar and Kumari 2003).
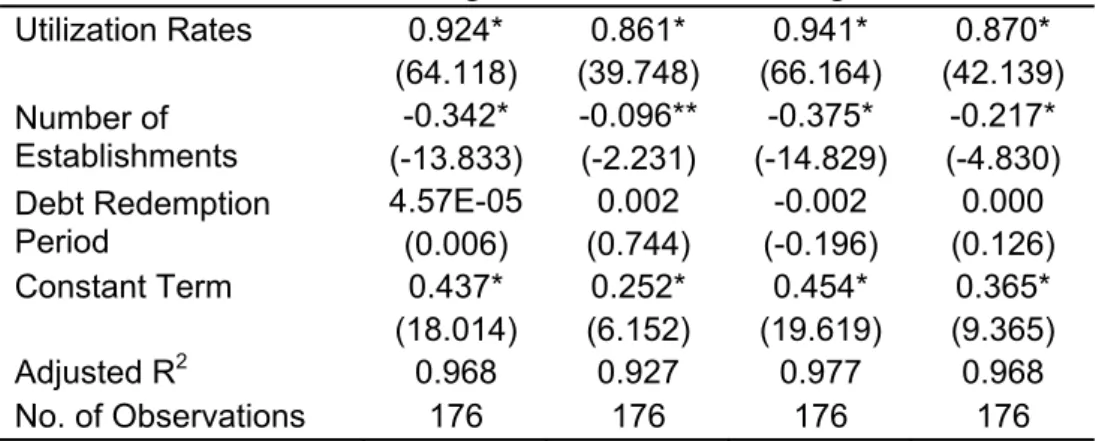
The regression results presented in Table 3 show a significant and negative correlation between TFP growth rates and the rate of change in the number of enterprises in both LEs and SMEs. It suggests that the decrease in the number of establishments might improve TFP growth rates. It can be interpreted that the exit of inefficient SMEs might have raised TFP growth rates. A significant and positive correlation between TFP growth rates and capacity utilization can be seen in both LEs and SMEs. Utilization rates might have affected TFP growth rates. A correlation between TFP growth rates and a change in the interest-bearing debt redemption period was not observed. Although some SMEs could afford to pay back their debt, they did not have enough funds to invest in machinery or the improvement of production methods. Low investment in these areas might undermine the SMEs’ competitiveness in the long term.
Table 3: Determinants of Productivity Growth (Dependent Variable: TFP Growth Rate)
Item Without Year Dummy With Year Dummy
Large SME Large SME
Utilization Rates 0.924* 0.861* 0.941* 0.870* (64.118) (39.748) (66.164) (42.139) Number of Establishments -0.342* -0.096** -0.375* -0.217* (-13.833) (-2.231) (-14.829) (-4.830) Debt Redemption Period 4.57E-05 0.002 -0.002 0.000 (0.006) (0.744) (-0.196) (0.126) Constant Term 0.437* 0.252* 0.454* 0.365* (18.014) (6.152) (19.619) (9.365) Adjusted R2 0.968 0.927 0.977 0.968 No. of Observations 176 176 176 176 R2= coefficient of determination. Notes:
Figures in parentheses are t-ratios. * Significant at 1%.
** Significant at 5%. Source: Author.
During the long-term recession, streamlining of procurement by LEs changed the multi-tier subcontracting system. LEs reduced the number of suppliers and components they used. While efficient SMEs selected by LEs were able to expand their business, inefficient SMEs lost customers. Excess debt forced many SMEs to exit the market. The exit of inefficient SMEs reduced excess employment and excess capacity and might have raised TFP growth rates. On the other hand, efficient SMEs improved their competitiveness through investments in machinery and improvement of production methods. It is expected that if
worldwide recession permanently shrinks demand in the four industries, more SMEs will be forced into closing down.
4. REGIONAL VARIATION OF INDUSTRIAL CLUSTERS
SME policies need to be reviewed from both the industrial policy and regional policy standpoints for three reasons. First, when an assembly factory is closed down, although the impact on the industry as a whole is limited, the impact on the region is huge. As many SMEs that had been supplying the closed factories lose customers, the industrial cluster where the closed factories are located is affected. Second, the leading industry in a cluster may change. When a leading industry starts to decline, municipal governments must promote other industries. Third, exchange and tie–ups among SMEs in different industries help to develop the local economy. In fact, the focus of SME policy has shifted from industry to cluster. The collaboration between SMEs in different industries was emphasized in the 1980s.
Industrial clusters can be categorized into four types according to how they were formed historically and according to their characteristics: (i) company town clusters, (ii) production region clusters, (iii) mixed urban clusters, and (iv) mixed invitation clusters (SMEA 2006). The advantages of the business environment differ according to the type of cluster and have changed in the process of industrialization.
Company town clusters are formed by the agglomeration of numerous subcontractor groups around the assembly factory of a particular LE. Typical examples are the region around Toyota City, which has Toyota Motor Corporation at its heart, and Hitachi City, which has Hitachi at its heart. Cluster regions have developed as a result of enterprises cutting the cost of expensive tasks such as production management and the acquisition of new customers, and their move to specialize in certain production processes. SMEs benefit from being within the same business groups as the LEs. The success of Toyota Motor Corporation raised the number of employees living in Toyota City, as well as the value added (at 2000 prices) by 1.5% and 0.6% between 1997 and 2007, respectively (Table 4). On the other hand, although the number of employees in Hitachi City was more than 40,000 before 1994, it came down to 25,000 in 2005. In the 1990s, Hitachi shifted the manufacturing base of its home appliances abroad. As a result, the number of employees at its major subcontractors was reduced to half the size it was in the 1970s (Japan Small Business Research Institute 2003). As clusters are affected by the difficulties experienced by LEs, SMEs are forced to diversify their businesses. The traditional business model of being dependent on certain LEs and doing business within the cluster is not functioning as well as it used to. Within the clusters, SMEs are discovering new clients and trying to diversify outlets.
Table 4: Trends of Manufacturing Establishments Employing More Than Three Employees in Four Types of Clusters
(%) Categories of Clusters Name of Cities Number of Establishments Number of
Employees Value Added
1985– 1997 1997– 2007 1985– 1997 1997– 2007 1985– 1997 1997– 2007 Company Town Toyota -0.5* -0.2* 0.4* 1.5 -0.6* 0.6 Hitachi -2.5 -3.6 -1.1 -3.5 2.2* 0.3* Production Region Tsubame -1.6 -3.7 -1.3 -3.1 2.3 0.2* Sabae -0.7* -5.0 -1.0 -3.4 1.7 -3.5 Mixed Urban Sumida -3.7 -6.2 -3.5 -5.3 0.4* 4.9* Ota -3.5 -4.2* -4.1 -5.9 -0.5* -4.6 Higashi-Osaka -1.5 -3.7 -1.4 -3.4 1.1* -2.7 Mixed Invitation Kitakami 1.5 -2.1 2.9 -1.1 4.6 2.9* Kofu -3.8 -4.8* -1.7 -2.7* 2.6 -0.4*
Note: * Statistically insignificant at 95% confidence level.
Source: Government of Japan, Ministry of Economy, Trade, and Industry, Census of Manufacturers (available: http://www.meti.go.jp/statistics/tyo/kougyo/archives/index.html [accessed 1 June 2009]).
Production region clusters are formed by enterprises belonging to a specific industry, such as consumer goods, concentrating in a particular region that has grown through the sharing of raw materials and technologies that accumulated in that region. Typical examples are the Tsubame-Sanjyo region in Niigata Prefecture, where cutlery and blade manufacturers have clustered, and Sabae City in Fukui Prefecture, where eyeglass frame manufacturers have clustered. SMEs in these regions receive orders through a joint order-taking system and have established a system of division of labor within the cluster to manufacture cheap, high-quality, mass-produced goods. However, tough competition with cheap goods produced in the People’s Republic of China has shrunk their domestic and export markets. Their system of mass production, which has been a source of competitive advantage, appears to be performing less well today. Heavy dependence on certain industries and the highly segmented and specialized production processes prevent the clusters from adjusting to the new business environment (SMEA 2006). The number of establishments and employees has clearly declined since 1997 in Tsubame and Sabae. In Sabae City, some SMEs are trying to enter the precision machinery and medical equipment industries utilizing accumulated skills.
Mixed urban clusters have formed in urban areas. There are many such clusters in the machinery and metalworking industries, and there often occurs a division of labor between enterprises in the same cluster, as well as business relations that cut across traditional industry groupings. Typical examples include Sumida City and Ota City in Tokyo Prefecture and Higashi-Osaka City in Osaka Prefecture. The number of establishments in Sumida and Ota decreased sharply even before the boom period began in 1985. Rising land prices encouraged the diversion of factory sites to housing areas. Recession accelerated the downward trends in the three cities between 1997 and 2007. But, some SMEs are growing. As it is difficult to establish systems of mass production in urban areas, where the cost of land and labor is relatively high, clusters located in urban areas specialize in high value-added products. Production functions in such clusters are based on flexible divisions of labor as a result of the clustering of diverse industries and technologies. Consequently, the clusters have been able to respond to changes in the industrial structure during the
term recession. It is noteworthy that SMEs in these clusters have the production and processing abilities to deal with product development and trials.
Mixed invitation clusters are formed as a result of local government efforts to attract enterprises and the implementation of industrial relocation plans. During the 1970s, the government regulated the size of factory sites in metropolitan areas and subsidized the transfer of factory sites to rural areas. As many of the invited SMEs belong to industry groups outside the cluster, collaboration within the clusters has not been very active. Typical examples are the Kitakamigawa basin region in Iwate Prefecture and Kofu City in Yamanashi Prefecture. The clusters have developed because of the increasing number of labor-intensive plants, enticed by large orders from enterprises in that region and the comparatively cheap labor. Some SMEs in mixed urban clusters set up secondary factories in mixed invitation clusters due to regulations pertaining to factory sites. Various SMEs have been added to these clusters such that they have become more complex and are no longer dependent on a specific industry. However, some factories have withdrawn from the clusters due to the availability of cheaper labor in other Asian countries. The number of establishments decreased in Kofu City and Kitakawa City during the 1990s. This shows that with globalization, cheap labor is fading as a competitive edge for clusters in Japan.
The above analysis suggests that diversification and collaboration that cut across traditional industry groupings are key points to activating the local economy. Although the decline in the number of SMEs has been a common phenomenon in the four types of clusters, some clusters are still creating new businesses by taking advantage of more flexible divisions of labor.
5. SME POLICIES IN JAPAN
SME policies in Japan have been modified to adjust to changing economic conditions. SME policies during the 1980s were noteworthy for three reasons. First, they tried to encourage R&D in SMEs, rather than the diffusion of existing technology. SMEs could get low-interest loans from government financial institutions after local governments approved their technology development plans in high-technology areas such as electronics and biotechnology. Subsidies and tax concessions were provided for R&D activities conducted by SMEs. Second, the government recognized the positive effects of technology exchange and tie-ups among SMEs in different industries and began to encourage these activities. During the recession in the 1970s, SMEs in the machinery industry collaborated to produce high value-added products. The collaboration was effective for the joint development of unit components. Thus, in 1981, the government started technology exchange plaza projects to facilitate exchange and tie-ups among SMEs in each prefecture. In 1988, the government began to subsidize and give tax concessions to new technology developments by cooperative associations among SMEs in different industries. Third, the government encouraged new project ideas. Prefectural and municipal governments and the private sector got together and set up business incubators to reactivate local economies negatively affected by the recession. Subsidies from the government and low-interest loans from government financial institutions were provided to incubator projects. However, the occupation ratio of incubator projects was low due to the high rents. Such high rents were charged because prefectural and municipal governments gave priority to the acquisition of subsidies from the central government over careful examination of the feasibility of projects (Kurose 2006).
The Small and Medium Enterprise Basic Law was revised fundamentally in 1999. It was considered the backbone of SME policies. Its policy concept was to rectify the gap between SMEs and LEs in terms of labor productivity by upgrading the structure of SMEs and improving the conditions of trade. The government also recognized that SMEs could not introduce modern technology given their small size and the excessive competition among
them. The policy concept had already been changed from modernization to business conversion in the 1980s. Moreover, business innovations and start-ups were encouraged in the 1990s.
Amendment of the law confirmed the change in SME polices. The new Small and Medium Enterprise Basic Law was based on a new philosophy of promoting diverse and vigorous growth and the development of independent SMEs rather than on rectifying gaps. It has three key goals: (i) promoting business innovation and new business start-ups, (ii) strengthening the management base of SMEs, and (iii) facilitating adaptation to economic and social changes. Business innovation is a broad concept and covers new products that SMEs are trying to develop and produce. The new law does not have any intent to direct SMEs in specific areas, as was the case with the old law. SME policies became competition-oriented. Moreover, the new law defined the responsibility of municipal governments. Before the amendment, only the central and prefectural governments were involved in SME promotion.
However, SME policies cannot stop the long trend of SME decline during the recession. The exit of many SMEs has significantly affected local economies. Some municipal governments have implemented local ordinances promoting SME development to activate their local economies. Municipal governments can play an important role in collecting information, interacting with SMEs, and organizing exchange among SMEs.
In 1979, Sumida City became the first municipality in which the government implemented a local ordinance on SME development. The SME promotion policies of Sumida City are unique for three reasons. First, the government set up a database containing pertinent information about SMEs in the city. In 1977 and 1978, 180 employees of the city office visited all 9,313 registered establishments to conduct a survey. They also carried out a hearing with personnel of the SMEs. The hearing was a good opportunity for employees of the city office to understand the problems that SMEs were facing. The experience was useful in the development of a master plan for SME promotion in 1986, 1989, and 2003. Second, SME owners were given the opportunity to participate in policymaking. In 1980, the government set up the Industrial Promotion Committee, which consisted of SME owners, experts, and government employees. In consultation with the said committee, the government runs an SME center that has technical advisers and is equipped with expensive machine tools and instruments that SMEs in the city can use. Third, SME promotion was strengthened by linking it to local tourism. The Industrial Promotion Committee recommended the setting up of small museums to present the industry and culture of Sumida City to local and foreign tourists, as well as small shops on the premises of the factories to sell products made by Sumida City SMEs. SME promotion thus became a part of policies to activate the local economy.
The direction of SME policies can be appreciated on three fronts. First, private sector initiatives are being facilitated. The government should not force business models like modernization policies. SMEs have the ability to find new business areas. Second, R&D activities are being encouraged. SMEs have a competitive advantage in R&D activities because they can specialize in niche areas. Third, municipal governments can play an important role in promoting SMEs. Some municipal governments have followed the best practice of Sumida City. Based on the experience of Sumida City, they have learned to give priority to SME promotion, tap local resources, and take into consideration the character of the local economy when making their plans. They likewise have realized the importance of the interaction between the local governments and SMEs in making their plans work.
6. RESULTS OF FIELD SURVEY
To investigate diversification by SMEs and its policy implications, a survey was conducted in Ota City of Tokyo Prefecture and in Southern Kyoto Prefecture in May, June, and November
19
of 2004. The target SMEs were selected mainly from the award-winning SMEs in Ota City and Kyoto Prefecture. Most of them were above-average SMEs in terms of standard qualities and had unique traits. Table 5 shows the characteristics of each company. Those in Ota City had flexible divisions of labor as mentioned earlier. Although the government of Ota City enacted local ordinances that affect SME development and has been actively promoting SME development, the number of SMEs has declined since the 1980s. After the factory sites in metropolitan areas were regulated, some SMEs established their secondary factories for mass production in rural areas. As Southern Kyoto is close to Osaka, subcontracting SMEs have developed in the area. SMEs in Japan are becoming less competitive in labor-intensive processes as a result of competition from neighboring Asian countries. SMEs that are doing well in urban areas might have lessons to offer. Five points were found out from the survey.
Table 5: Characteristics of Surveyed SMEs 5.a: Ota City
Products Number of Regular Employees Main Customers Location Participation in Cooperation Relation to LEs Diversification Overseas Affiliates Secondary Factories in Japan Originality
Plating 80 Automobile, Electrical
equipment Industrial estate (modernization scheme) Cooperative association (Pollution control, R&D)
Supplier Molding Ota City
Precise process 100 Electronics, Semiconductor Own factory Member of Tokyo Chamber of Commerce
and Industry Supplier
Secondary and Tertiary
factories Rural area
Electrical
equipment 9 Power plant
One floor of private residential apartment
Subcontractor PRC (planning)
Die 5 Machine manufacturers Industrial apartment in
industrial estate
Metal process 8 Semiconductor
Industrial apartment owned by Ota City Subcontractor Machine (robot, etc.) manufacturing including R&D and software 12 Automobile Industrial apartment owned by Ota City
Joint R&D with SME
and universities R&D on consignment Development of new products Rural area Original products
Metal process 18 Electrical equipment Own factory Process of trial
Metal process 45 Semiconductor Own factory Supplier
Electrical equipment 25 Electrical equipment (R&D and sales) Industrial apartment owned by Ota City Development of
new products Original products
21 Products Number of Regular Employees Main Customers Location Participation in Cooperation Relation to LEs Diversification Overseas Affiliates Secondary Factories in Japan Originality
Precise process 20 Machine tool, Semiconductor Own factory Cooperative association Subcontractor
Metal process 46 Transportation equipment Own factory Subcontractor Heat treatment Rural area
Machine
manufacturing 92 Automobile Own factory Supplier Development of new products Thailand Original products
Precise die and
press 120
Electrical
equipment Own factory
Joint R&D with
universities Supplier Production of machinery Thailand Philippines PRC Rural area Original products
Metal process 8 Semiconductor
Industrial apartment owned by Ota City
Supplier
Plating 12 Own factory
Machine
manufacturing 11 Electrical equipment Own factory Supplier
Machine
manufacturing 37 Electrical equipment Own factory R&D on consignment
Engineering production of trial 5.b: Kyoto Products Number of Regular Employees Main Customers Location Participation in Cooperation Relation to LEs Diversification Overseas Affiliates Secondary Factories in Japan Originality
Precise die and
press 140
Semiconductor, Electrical
equipment Own factory
Exchange association
among SMEs Supplier Production of machinery Rural area
Machine tool
Manufacturing 48 Own factory Supplier PRC Original products
Precise plastic
mould 42 Electrical equipment Own factory Exchange association among SMEs Supplier
PRC = People’s Republic of China. Source: Author.
First, most of the 20 SMEs had outstanding technology and special skills, and had established their brands among their clients. With the high price of land and high wages that put SMEs in urban areas at a disadvantage, they must have unique sales points. Five SMEs developed original products that other companies, including LEs, were not producing and were selling them. Other SMEs also had special skills that other companies could not imitate easily. For example, although a metal processing SME has higher margin rates than other companies because it can only process difficult-to-cut materials in the short term, it can get orders regularly. Originality, unique technology, and skill are more important than production costs for SMEs in urban areas.
Second, three of the 20 SMEs were R&D-oriented business ventures that concentrate on the design and development of new products. The first SME produced equipment for mechanization. It had obtained patents from Japan, Germany, United Kingdom, and United States. The managing director pointed out the possibility of a development-oriented venture business. As LEs reduced the number of engineers on staff during the recession, they must rely on outsourcing to develop peripheral equipment. The second SME also mentioned the same point. Because small venture companies look for niche markets, they have many opportunities to develop various products. Although experience is necessary for the development of new products, engineers in LEs do not often get many chances to expand their expertise because they concentrate only on major projects. Meanwhile, SMEs concentrate on product design, development, and sales, but outsource manufacturing. The third SME is shifting to become an engineering company so it is likely that it will stop manufacturing in the future.
Third, four of the 17 SMEs in Ota City were located in industrial apartments. They had factories on the lower floors and residences on the higher floors. It is noteworthy that two R&D-oriented business ventures were in such industrial apartments. It can be surmised that industrial apartments helped some new industry-oriented SMEs to enter the market.
Fourth, five of the 20 SMEs had secondary factories in rural areas. Secondary factories take charge of mass production, while head factories concentrate on small-amount production of many varieties of products related to R&D and trials.
Fifth, four of the 20 SMEs were subcontractors. Among them, three SMEs had transactions with other companies while only one completely depended on a parent company. That company is eventually going to move its operations to the People’s Republic of China to follow its parent company. This shows that dependence on a parent company makes the management base of an SME fairly weak.
The above analysis suggests three ways through which SMEs can survive in urban areas. First, SMEs that have outstanding technology and special skills can survive. Although SMEs in urban areas do not have an advantage in mass production, they have the edge in small-amount production of many varieties of products. As LEs in metropolitan areas actively conduct R&D, SMEs have a chance to be involved in trials and R&D-related business. Second, R&D-oriented business ventures have the opportunity to grow in niche areas. As manufacturing is outsourced, efficient links between the R&D efforts of SMEs in urban areas and manufacturing spots is important. Third, setting up industrial apartments is an effective way to relax constraints for new industry-oriented SMEs looking to set up factory sites in urban areas.
7. POLICY RECOMMENDATIONS
During the long-term recession, the streamlining of procurement by LEs changed the multi-tier subcontracting system. LEs reduced the number of suppliers and components they used. While efficient SMEs selected by LEs were able to expand their business, inefficient SMEs lost customers. The regression results show a significant and negative correlation
between TFP growth rates and the rate of change in the number of enterprises in four industries: general machinery, electrical machinery, transportation equipment, and precision machinery. This suggests that a decrease in the number of establishments might improve TFP growth rates. It can be interpreted that the exit of inefficient SMEs might have raised TFP growth rates. Only efficient SMEs that meet the demands of cost, quality, and delivery from LEs will survive during the present recession. It is expected that if worldwide recession permanently shrinks demand in the four industries, more SMEs will be forced into closing down.
Although the decline in the number of SMEs has been a common phenomenon in the four types of clusters, some SMEs have still been able to create new businesses by taking advantage of more flexible divisions of labor. The traditional business model of being dependent on certain LEs and doing business within the cluster is not functioning as well as it used to. Heavy dependence on certain industries and highly segmented and specialized production processes prevent the clusters from adjusting to the new business environment. SME policies must encourage diversification and collaboration that cut across traditional industry groupings to form flexible divisions of labor.
SMEs in Japan are becoming less competitive in labor-intensive processes, as a result of stiff competition from neighboring Asian countries. SMEs that are doing well in urban areas might have some lessons to offer. Results of a field survey suggest three ways in which SMEs can survive in urban areas. First, SMEs that have outstanding technology and special skills can survive. Although SMEs in urban areas do not have the edge in mass production, they do have an advantage in small-amount production for many products. Second, R&D-oriented business ventures have a chance to grow in niche areas. As manufacturing is outsourced, efficient links between the R&D efforts of SMEs in urban areas and manufacturing spots is important. Third, setting up industrial apartments is an effective way to relax constraints for new industry-oriented SMEs looking to set up factory sites in urban areas.
The following policy recommendations are based on this analysis:
• Unfair trade should be regulated by law. In some cases, parent companies have
made unfair demands of subcontractors, such as demanding that they reduce the prices of components after an agreement had been signed. In other cases, contracts have been abruptly terminated. Such unfair treatment might affect SMEs.
• Although the financing of working capital for SMEs has been secured, careful examination of additional financing is necessary. Although the recession decreased ordinary profits, banks increased long-term loans to SMEs between 1991 and 1995 because they were afraid that these loans would become nonperforming assets. Additional loans to avoid financial crunch made excess debt in SMEs more serious.
• The entry of SMEs should be encouraged by providing incentives such as
subsidies, low-interest loans, tax concessions, and incubator facilities as these can contribute to employment creation and the opening of new industries. The costs of entering the market have risen due to technological development in the past years. Advanced machinery is necessary to meet the increasing demands of customers. SMEs cannot maintain their businesses without advanced technology and accumulated skills. Entry into manufacturing, particularly by the young generation, is thus becoming more difficult than it was during the 1960s. On the other hand, R&D-oriented business ventures have a chance to grow in niche areas. Such entry should be supported by policies.
• Municipal governments should play an active role in coordinating collaboration that
cuts across traditional industry groupings. Based on the experience of Sumida City, municipal governments have learned to give priority to SME promotion, tap local
resources, and take into consideration the character of the local economy when making their plans. They likewise realized the importance of the interaction between local governments and SMEs to make their plans work.
25
REFERENCES
Asanuma, B. 1989. Manufacturer-Supplier Relationships in Japan and the Concept of Relation-Specific Skill. Journal of the Japanese and International Economics 3(1): 1–
30.
Genda, Y., and R. Kanbayashi. 2002. Declining Self-Employment in Japan. Journal of the Japanese and International Economics 16(1): 73–91.
Goldar, B., and A. Kumari. 2003. Import Liberalization and Productivity Growth in Indian Manufacturing Industries in the 1990s. The Developing Economies 41(4): 436–60.
Government of Japan, Cabinet Office. 2009. Annual Report on Gross Capital Stock of Private Enterprises. http://www.esri.cao.go.jp/jp/sna/toukei.html#s-kakuho (accessed 19 November 2009).
Government of Japan, Ministry of Economy, Trade, and Industry (METI). 2009. 2007 Census of Manufacturers.
http://www.meti.go.jp/statistics/tyo/kougyo/result-2/h19/kakuho/sangyo/index.html (accessed 10 June 2009).
Japan Small Business Research Institute (JSBRI). 2003. Sangyo Shuseki no Aratana Taido
(New Trends of Industrial Clusters). Tokyo: Dobunkan. [In Japanese]
Kato, H. 2003. Chiiki Chushokigyou to Sangyoshunseki (Regional Small and Medium Enterprises and Industrial Clusters). Tokyo: Shinhyoron. [In Japanese]
Kimura, F. 2001. Subcontracting and the Performance of Small and Medium Firms in Japan.
Washington, DC: World Bank Institute.
Kurose, N. 2006. Chushokigyo Sisaku (Small and Medium Enterprise Policies). Tokyo:
Nihon Keizai Hyoronsha. [In Japanese]
Sastry, D. U. 1984. The Cotton Mill Industry in India. Delhi, India: Oxford University Press.
Small and Medium Enterprise Agency (SMEA). 1979. White Paper on Small and Medium Enterprises 1979(Japanese version). Tokyo: Gyosei Corporation.
———. 2005. Structural Change in Japanese Society and the Dynamism of Small and Medium Enterprises. White Paper on Small and Medium Enterprises in Japan. Tokyo: Japan Small Business Research Institute.
———. 2006. Small and Medium Enterprises at a Turning Point: Strengthening Ties with Overseas Economies and Population Decline in Japan. White Paper on Small and Medium Enterprises in Japan. Tokyo: Japan Small Business Research Institute. ———. 2007. Small and Medium Enterprises: Harnessing Regional Strengths and
Confronting Changes. White Paper on Small and Medium Enterprises in Japan. Tokyo: Japan Small Business Research Institute.
Urata, S., and H. Kawai. 2001. Technological Progress by Small and Medium Firms in Japan.
Washington, DC: World Bank Institute.
Yoshida, K. 1997. Tenkini Tatsu Chushokigyo (Small and Medium Enterprises on the Cross