Review of System Dynamics models for
electricity market simulations
by Felix Teufel, Michael Miller, Massimo Genoese and Wolf
Fichtner
KIT – University of the State of Baden-Wuerttemberg and
National Research Center of the Helmholtz Association
www.iip.kit.edu
No. 2
| June 2013
WORKING PAPER SERIES IN PRODUCTION AND ENERGY
1
Review of System Dynamics models for electricity market simulations
Teufel
a, Miller
b, Genoese
b, Fichtner
baEnBW Energie Baden-Württemberg AG, Research and Innovation, Karlsruhe, Germany
bInstitute for Industrial Production at the Karlsruhe Institute of Technology, Karlsruhe,
Germany
Abstract
This paper provides a review on modeling electricity markets with System Dynamics (SD) focusing on deregulated electricity market models. First the SD method is classified within the wide field of electricity market modeling. Then all distinctive properties of the SD method in this context are elaborated. After an overview of first SD models in energy economics, a comprehensive review of models of deregulated electricity markets is presented. The review captures more than 80 publications in the field of SD energy market modeling. Some tendencies could be identified: Firstly SD models are more and more combined with other methods like generic algorithms, experimental economics or analytical hierarchy processes. Secondly, stochastic variables are considered increasingly. Thirdly, models show a higher level of detail and increasingly evaluate aspects such as new markets designs or new market components and their interdependencies.
Key Words
Deregulated electricity market, market model, market design, system dynamics, model review, investment decisions, regulation, market power, evaluation of strategic concepts
Highlights
A review on System Dynamics models for electricity market simulations is provided
More than 80 publications and models have been analyzed and are presented synoptically
A classification of the System Dynamics methodology within electricity market modeling approaches is provided
Synoptical table of over 80 models is presented
2
1.
INTRODUCTION
Electricity markets are facing substantial changes globally. The deregulation of the electricity sector, increasing supply of renewable energy production as well as regulatory interventions addressing topics such as climate change, security of energy supply and affordable energy prices lead to constantly changing boundary conditions.
This requires both market actors and market designers to examine and fully understand the impact of changing certain framework conditions. As extrapolating historical data is not sufficient, electricity market models that incorporate changing conditions are needed.
Different methods for modeling are utilized and have been established. This paper focuses on System Dynamics (SD) models of the liberalized electricity market. As this study covers a very wide range of publications, like resource models, supply-demand models, generation models, the application of these models is not discussed in detail. However, this study gives a broad selection and comparison of more than 80 publications of SD electricity market models. The paper starts by outlining how to model in SD and gives a classification of SD in electricity market modeling.
The aim of this review is to comprise the status quo of SD electricity market models. The paper provides a categorization of these publications by identifying major fields of applications. Furthermore properties of the SD methodology are introduced and the modeling approach is classified within the wide field of electricity market modeling. Moreover the identification of differentiating factors of the reviewed models are identified and synoptically presented in a tabular overview. The review closes with a summary and outlook, which includes the identification of modeling trends.
2.
SYSTEM DYNAMICS IN ELECTRICITY MARKET MODELING
a.
CLASSIFICATION OF ELECTRICITY MARKET MODELING
Besides the System Dynamics modeling technique, several other modeling methods are applied to electricity markets. Ventosa et al., (2005) identify three main modeling categories: optimisation models, equilibrium models and simulation models. Enzensberger, (2003) distinguishes Top-Down and Bottom-Up models, where optimization and simulation models are part of the bottom-up approaches and equilibrium models part of the top-down approaches. Top-Down models have a more macroeconomic perspective and seek to model developments within the entire economy covering the most relevant sectors. Usually this broader perspective requires a higher aggregation level instead of modeling explicit technology options like single power plants. Important classes within the field of top-down
3 models are Input-Output [I/O] models and Computable General Equilibrium Models [CGE] (Sensfuß, 2008). Bottom-Up models are also called partial models as they usually focus on the considered sectors (e.g. electricity and heat) and do not cover interactions with the entire economy. Möst & Fichtner (2009) compare optimizing models and system dynamics models. They state that optimization models try to optimize a system with given boundaries (e.g. electricity demand) finding e.g. a cost minimal solution. Simulation models in general instead try to simulate the effects of different actions. Agent-based models and system dynamics models are the two main representatives of simulation models. As stated in the previous section, SD simulate causal effects within components of a system in time. This enables to include an actor’s perspective into the simulation, which is also a main advantage of agent-based simulation models. Whereas in agent models learning behavior of market participants can be modeled, in System Dynamics models difference equations are used to model the temporal and structural interdependencies between the elements of the models. These models generally are used to model liberalized electricity markets and particularly to model market imperfection and strategic behavior of the market participants.
b.
PARTICULARITIES OF MODELING ELECTRICITY MARKETS WITH SYSTEM
DYNAMICS
To create a model with SD, Forester (1961) claims, that there are basically three “databases” that provide the knowledge base. The first fundamental database is data about historical developments and presumptions on possible approaches how to solve the faced problem. Forester calls this the “mental database”, which can be described as compilation of cognitive impressions. Expectations about future system performance are also part of mental databases, however should not be considered in the model. As many systems show non-linear behavior those intuitive solutions and approaches are usually not valid as they tend to assume linearity.
“Written databases” are either transcripts of mental models from the “mental database” or approach the considered problem only partially and do therefore play a minor role in SD modeling.
Due to the important role of causalities in SD modeling, the third database, called “numerical database”, is of little importance. This is in contrast to many other methods that conduct extrapolation on basis of that information. The numerical database is an incoherent accumulation of quantitative data, which does not contribute to the description of feedback
4 loops, a major property of representing certain causalities within SD models.
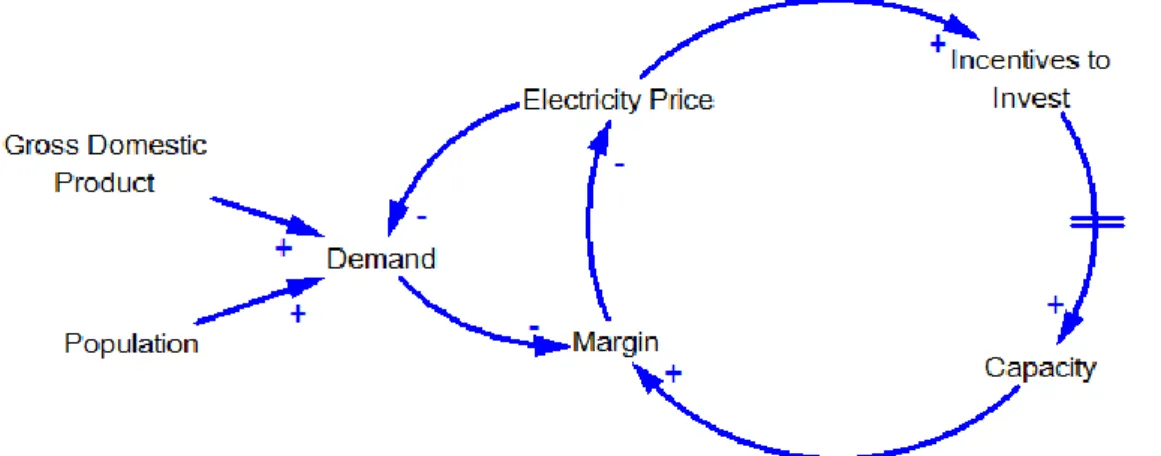
By taking this conceptual differentiation of information sources into account, a distinctive property of the SD methodology can be exemplified. Not only the final SD model but also the modeling process contributes to a better understanding of a system and relevant causalities as assumed linear system behavior is neglected and exaggerated focus on numerical data is prevented. Vogstad (2005a) describes this as follows: “Selecting the important relationships from the less important ones can only be done by trial and error, due to our cognitive incapabilities of dealing with complex nonlinear systems. Defining the adequate system boundaries of a model is therefore an iterative process. As we understand more about the problem, we are able to identify important relationships from the less important ones.” As SD simulations are quantitative models, causalities and coherences are implemented with differential equations (Botterud, 2003). This is done by the help of stock and flow variables. A simplified model is illustrated in Figure1.
Figure 1: simplified Scheme of a dynamic electricity market modeling (according to Arango et al. (2002))
Arango et al. (2002) describe the dynamic behavior of electricity markets with a focus on the development of installed electricity production capacities. The aggregated view shows that electricity demand depends on demographic and economic development as well as on the elasticity of electricity demand. A high electricity price stimulates investments in electricity generation facilities, which lead to higher capacity and thus to higher margins. The double prime between the variables “incentive to invest” and “capacity” indicates that planning, approval and building processes delay the actual increase of capacity. Positive and negative signs stand for reinforcing or counteracting influences. Sterman (2000) states: “All dynamics arise from the interaction of just two types of feedback loops, positive (self-reinforcing) and
5 negative (self-correcting) loops. Positive loops tend to reinforce or amplify whatever is happening in the system, while negative loops counteract and oppose change. […] By stringing together several loops we can create a coherent story about a particular problem or issue.”
Literature lists six major characteristics as differential factors comparing the SD methodology to conventional approaches of electricity market modeling.
One is the above mentioned capability to implement delays, which is very important when dealing with energy economics. Time consuming planning, approval and building processes need to be incorporated into the model.
Furthermore the consideration of bounded rationality is of particular importance. In contrast to optimization problems, where perfect information and rational agents are assumed modeling in SD gives the opportunity to implement realistic processes with immanent preoccupations, misinterpretation and wrong considered effectiveness.
Thus, decisions and its developments can be modeled descriptively, by considering bounded rationality. Hence it is possible to implement decision processes without determining normative optima, like it is done in other methods (Jäger et al., 2009).
Whereas classical optimization methods assume reliable and complete information about future development, SD allows modeling uncertainties concerning price, quality of information, future demand and expected regulatory specifications (Dyner, 2001). This principle is known as “imperfect foresight”.
Most other models assume immediate convergence to market equilibrium. Yet, SD models consider that suboptimal decisions and delayed impact results only in an approximation of supply and demand (Jäger et al., 2009).
As SD modeling focuses on causal relations, further aspects such as qualitative influences are easily incorporated. Botterud (2003) writes: “Consequently, system dynamics models usually have an aggregate level of detail, while the scope of the models can reach beyond what is usually included in traditional analytical methods.”
The applicability of SD models for electricity market modeling is described in detail by Pereira & Saraiva (2009). Sanchez et al. (2007) and Sanchez (2009) give a detailed review about the classification of other methods, which will be addressed in the next section.
3.
METHODOLOGY AND MODEL REVIEW
The broad diversity of addressed questions, model structures, aims and range of application was collected. For this reason, the publications have been evaluated regarding background
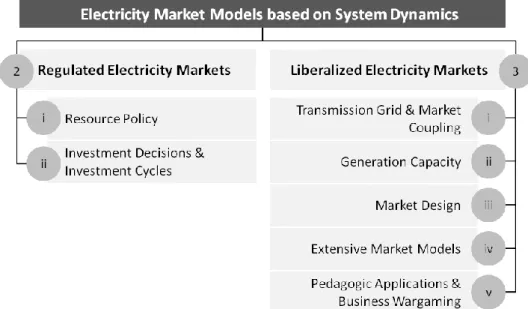
6 information, characteristics, fields of application, model type and further information. Based on the major research question the considered models are structured on a thematic basis as shown in Figure 2.
Figure 2: Major research questions as thematic structure.
In general, the models can be categorized in models which have been developed for regulated electricity markets and models for deregulated electricity markets. Former models mainly discuss dynamics of the energy system and are briefly described in the following section, as they are the basis for the further developed models for the liberalized markets. These models have been characterized into those who consider grid restrictions, addressing issues of market design, market power and extensive models. Minor roles play other models developed for pedagogic and business wargaming applications. The most important models representing also the largest subsection in this paper are the models analyzing the dynamics of investment decisions and investment cycles. The overview will be provided in the following chapter, before summarizing all results in table 1.
a.
REGULATED ELECTRICITY MARKETS
i.
RESOURCE POLICY
After Forester had published the principles of the SD method in 1961, models regarding energy were mainly developed to analyze the impact of resources on economic development.
7 Following their global scope the first models were named World. On the basis of the model World3, the well-known book “Limits to Growth” by Meadows et al. (1972) was published. Apart from the methodological provenance those models are important as these highly aggregated models are the root for policy evaluation with SD.
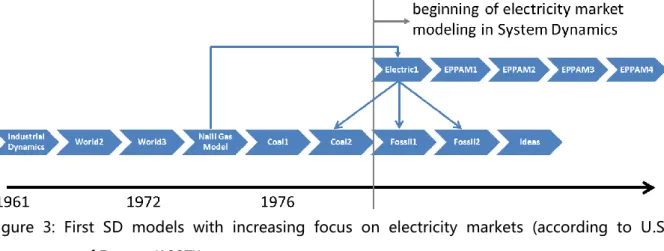
The advancement of the Woarl3 model, for example COAL1 and COAL2 by Naill (1972) and Naill (1976) provided the basis for the evaluation of energy policy measures in the United States for a long period. FOSSIL1, which is based on COAL2, was the first model that explicitly modeled the electricity market. Backus (2009) describes the history of extensions and advancements of those models in detail. The U.S. Department of Energy (1997) provides a synoptic review of the evolution of these models over the time as shown below.
Figure 3: First SD models with increasing focus on electricity markets (according to U.S. Department of Energy (1997))
Fossil2, a second generation successor of the Coal2 model, is another eminent model that was used as starting point for further models such as “Integrated Dynamic Energy Analysis Simulation (IDEAS)”and “Feedback Rich Energy Economy (Free)”.
Biair (1991) states, that Fossil2 simulates the energy demand and supply in the United States in a period of 20 to 40 years. Future demand of each energy category like light, thermal energy, steam heat and mechanical energy is modeled endogenous. The energy price is calculated in a demand feedback loop.
The U.S. Department of Energy (1993) published the model named “Integrated Dynamic Energy Analysis Simulation (IDEAS)”. IDEAS is a long-term model of the U.S. energy demand and supply, which was used to analyze the dependence on oil imports. According to the U.S. Department of Energy (1993) the results were used to determine measures of energy policy.
8 The model “Feedback Rich Energy Economy (Free)” implemented by Fiddaman (1997) and Fiddaman (1998) examines the relationship between environment, politics, economy and society. Particularly the relation of economic development and energy demand is discussed. The previously discussed models were quite aggregated. Dependencies between resource availability, security of supply, economic development and environment have been examined. Contrary to this broad scope electricity utility policy and planning analysis models (EPPAM) only consider the electricity supply.
Aspects such as energy efficiency, environmental policies, operational stability, production capacity expansion and the development of electricity prices are examined with the help of models of the conservation policy analysis model family (CPAM) (Ford, 1997), (Ford et al., 1987), (Neubauer et al., 1997), (Dyner et al., 1993).
Resource policy screening models (RPSM) expand CPAM models with respect to the modeled generation technologies. Combined heat and power generation and smaller generation units, mainly renewables are taken into account (Neubauer et al., 1997).
Energy2020 is derived from the models shown in Figure 3. After refining the modeling of supply and demand side for energy supply in the United States, this model addresses the need for a more regional perspective on energy policy (Backus, 2009). Besides the U.S. and Canada, this model was already used in more than 20 countries.
Apart from the above mentioned models that derived directly from the MIT model family numerous other models were developed in the field of electricity generation and supply. Their main focus is the simulation of future dynamics and impacts of political decisions.
The model Threshold21 accomplishes the social, the economical and the ecological system. It can be used for analyzing aspects such as population growth, education, energy policy and economic developments. Among others Bassi (2006, 2007, 2008), Barney et al. (1995) and Balnac et al. (2009) describe this approach.
Another model on this aggregated level combines approaches of decision theory and multi-sector input-output models with SD (Osgood, 2003). However electricity markets are not modeled explicitly in this program.
ii.
INVESTMENT DECISIONS AND INVESTMENT CYCLES
Ochoa & Van Ackere (2007) examine the Swiss electricity market regarding the electric resource adequacy. The influence of the emergent liberalization and the nuclear phase out on the development of production capacity, import and export are evaluated. Results of the study
9 lead to the conclusion that Switzerland needs a long-term binding regulatory framework for future investments.
Ochoa (2007) confirms the aforementioned findings by focusing on the import dependency of Switzerland. The simulation shows that with clear regulatory specifications the electricity price can be reduced through imports from France. Moreover, earnings can be generated through exports, mainly to Italy.
Rego (1989) describes the capacity bottleneck problem in the regulated electricity industry in Argentina. A SD model with a capacity growth control mechanism is developed to analyze the trade-off between delayed development (costs due to lost load) and accelerated expansion (financial costs). For this purpose price calculations are based on a load duration curve and a merit order dispatch. Findings of the simulations are the optimal policies in terms of minimizing the short- and long-term supply-demand gap.
A tendency towards models with an increased level of detail can be observed. Yet there are still aggregated models which are relevant for energy policy. The focus of this review however lies on models of deregulated electricity markets. Therefore the above mentioned models have to be seen as a selection of major models that form the basis of electricity market modeling with SD. The focus of this paper is on deregulated market models that are presented in the next chapter.
b.
DEREGULATED ELECTRICITY MARKETS
In the following, deregulated and liberalized electricity market models implemented in SD are briefly described.
i.
GENERATION CAPACITY
Arango et al. (2002) analyze the investment in power generation capacities in Colombia. “Micro world” is an interactive SD model and game. A potential investor reaches periodic decisions within a defined scenario. This enables the decision maker to assess the impact of investments in electricity generation capacity. The user is able to observe the evolution of the system regularly and reach a decision whether to do or defer an investment in power generation. In this context risk and uncertainty analysis with regards to capacity expansion is considered. Uncertainty is implemented by modeling variables stochastically. Among others electricity price, regulation, demand growth and technology development. Major decision factor is the estimated project cash flow. The model simulates investment cycles. The
10 particular generation mix of Columbia is reflected by implementing a hydrology module. Hence restrictions of the transmission network, fuel markets, impact of possible new regulation, and influence of the load curve over dispatch are neglected.
Gaidosch (2007) focuses on the German electricity market. The model simulates a time period 30 years and tries to identify drivers for investment cycles in power plant investments. Although the model could support decision processes, the identification of drivers of investment cycles is focused. Thus the model supports the analysis of the impact of various politico-economic measures. The investigation shows, that the existing market structure of the German electricity market does not prevent from investment cycles with high price volatility. Sanchez et al. (2008) also examine long term investment dynamics. For this purpose System Dynamics is combined with approaches from credit risk theory and game theory. The cost of taking a new loan increases with the volume of investments made. Thus higher credit costs result in a decreasing discounted present value of a project. Transmission restrictions are not considered. The model is generic and not calibrated to a specific market.
Kadoya et al. (2005) evaluate to which extent deregulation is the cause of cyclical investment behavior. The model is calibrated to the two electricity markets Pennsylvania-New Jersey-Maryland Interconnection (PJM) and Independent System Operator-New England (ISO-NE). The simulation results lead to the conclusion that deregulation causes cyclic investment behavior. Special feature of the model is a detailed profitability assessments used by companies for investment decisions. Prices therein are captured with price forward curves. Ford (2001) examines a model based on fundamentals, which Gaidosch (2007) formulated in his outlook. The model is based on Ford (1999). In total five different scenarios are studied concerning investors behaviors. The scenarios differ in the knowledge about power plants under construction and the consideration of these. Results of all scenarios are that there is a cyclical investment behavior in power plant construction.
Syed Jalal & Bodger (2010) try to discover future dynamics with respect to cyclical investment behavior for New Zealand’s electricity market. The most important feedback loops are the permission and the construction loop, the interactive loop that combines investments and market as well as the actual investment decision loop. Contrary to a study by the New Zealand Electricity Commission, the authors detect a risk of cyclical investment behavior.
Pereira & Saraiva (2009, 2010, 2011) present an approach that combines a genetic algorithm and SD. Their aim is to provide decision makers the opportunity to simulate decisions based on the model. The generic algorithm is used to maximize the profits of each participant. With help of the SD model the long term electricity demand and electricity price development is
11 simulated. Decisions are supported by simulation projections for the specific point in time. The model can be used by enterprises to create risk reduced and robust expansion plans and by regulatory authorities to gain a better understanding of market developments.
Olsina et al. (2006) describe the mathematical background of cyclical investment mechanisms in detail. The model is suitable for enterprises and regulatory authorities to create complex scenarios and gain insights affecting investment decisions. “Imperfect foresight” and delayed disposability of power plant investments are taken into account. The study shows that by choosing the optimal generation technology mix, variable and fixed costs are covered. Therefore preferably the competition between different technologies is simulated as an alternative to competing market participants.
Bunn et al. (1993) point out characteristic SD properties in contrast to classical optimization methods of operations research. They develop a long-term planning model considering increased expected return on invests, changes in taxation frameworks and conditions for acquisition of capital. An optimization and a SD model are used. Major component of the model is the feedback loop of capacity payments for utilities, which is orientated at the loss of load probability per half-hour. The aspects of market structure, risk and strategic competition is main focus of the analysis. The study claims that the price is an insufficient reliable indicator of future needs of power plants. Therefore utilities act risk averse and invest in more flexible technologies like gas. In addition, market shares are shifted due to different credit terms of competitors and the increased risk leads to higher consumer prices.
Larsen & Bunn (1999) summarize the above mentioned aspects and address the challenges resulting of the transition from a monopolistic to a competitive market. The authors examine with the help of the above described model, if investment behavior is changed by the transition from a monopolistic to a polypolistic market.
Gary & Larsen (2000) compare SD models with equilibrium models with regard to the approach of reaching supply-demand equilibrium. Using causal diagrams, it is illustrated that equilibrium models assume immediate equilibrium whereas SD models often doesn’t achieve this state at all due to time delays and feedback loops. Focus of the investigation is the development of power plant capacity under consideration of dependencies between the gas and the electricity market. The electricity marked is assumed to be designed as a pool, such that the pool price increases in case the reserve margin decreases. This provides a signal to invest in new capacity.
Acevedo & Aramburo (2009) implement their model with the aim of providing decision support. They are using approaches of experimental economics combined with an electricity
12 market model in SD to study cyclical investments. Two different model variants are implemented. Whereas in the first variant producers always offer their full capacity of generation units the second variant requires the user to decide on the share of actually offered capacity on the market. The only restriction is that the user offers at least 70 % of the installed capacity. Major result of the simulation of 12 simulated experimental markets is that the requirement for full capacity bidding leads to cyclical investment behavior whereas the ability to decide on the actual offered capacity leads to weaker indications of cyclical tendencies. In those simulations a tendency towards Cournot Nash prices was observed. These results indicate that varying capacity utilization allows having higher prices.
Sanchez et al. (2007) focus on another element of deregulated electricity markets. The model considerers oligopolistic market structures and vary credit terms depending on the company situation. A conjectured-price-response mechanism considers that bidders are not only price takers but even influence the price with their bidding behavior. Sellers estimate their influence on the expected price and chose the best combination of quantity supplied and price accepted. The market equilibrium with the provided quantity and the associated price is then calculated. The oligopolistic structure of electricity markets is captured by a preferential treatment of larger enterprises with respect to credit terms.
Tan et al. (2010) model the process of analyzing investment alternatives using the example of wind turbines. In this context, SD is combined with decision trees. This combination allows incorporating the consideration of the complexity of such processes with SD and the flexibility of the management by applying the decision tree method. Results of the simulation runs are cash-flows of the projected periods. The resulting decision tree is solved by backward induction.
Vogstad et al. (2002) model the Nordic electricity market and depict short term against long term impacts of energy policy guidelines. The model simulates the electricity price, demand development, technological progress and resource availability in a 30 year timeframe. Investment decisions regarding generation capacities result from mechanisms that are defined ex ante. Generation technologies are either conventional (nuclear, coal, natural gas, natural gas with CO2 sequestration, natural gas peak load) or renewable (hydro, bio, wind onshore, wind offshore). Price elasticity and the evolution of demand are implemented exogenously. With the help of the hourly resolution technical restrictions like load gradients, start up or shut down costs are considered.
Jäger et al. (2009) develop Zertsim based on (Vogstad, 2005a) and calibrate their model on the German electricity market. The outputs of Zertsim are electricity prices, the development of
13 generation capacities (investment decisions) and CO2 emissions. Jäger et al. propose this
model as starting point for discussions about the future of electricity markets.
Qudrat-Ullah & Davidsen (2001) examine the Pakistani electricity market. In spite of the geographical potentials for hydroelectric power generation, mostly carbon, gas and fuel based electricity generation capacities are in place. The simulation assesses how the continuation of existing energy policy guidelines would affect the future generation portfolio. The assessment is carried out with respect to three criteria: the electricity supply, the resource import dependency and the evolution of CO2 emissions. The yearly calculated demand is induced by the GDP and the electricity intensity of the economy. The latter is dependent on the average price of electricity and takes changes in electricity generating capital into account. The study concludes that the generation portfolio would significantly change towards more gas power plants with the underlying assumptions. Yet water power would decrease its share of total electricity production.
In MDESRAP, Qudrat-Ullah (2005) examines the link between electricity supply, resources and pollution. It is analyzed how investment incentives affect the generation mix and resulting emissions. Production, resources, costs and pricing, environment, capital, investment decisions and electricity demand are modeled modularly. Generation technologies are offered at the market with full costs. Qudrat-Ullah points out the suitability of the model for political decision-making processes to identify appropriate policy guidelines and measures.
Bunn & Larsen (1992, 1994) analyze investment cycles in electricity generating capacity. Drivers of the cyclic behavior are identified for the deregulated British electricity market. Particularly the stability of the system under influence of regulatory authorities is focus. Capacity payment as correcting variable is at the regulator’s command. The research explores, if investors can deduce investment decisions from the capacity payment. Their gist states that instruments like statutory publication of future investment plans lead to a more stable system.
To investigate the consequences of different regulatory measures, Ford (1983) uses a very abstract and simplified model with just two feedback loops for demand development and capacity expansion. The model explores the impact of shorter planning and permission periods on the cyclical investment behavior. Furthermore the model examines the consequences of a resource shortage. The quantitative results of the simulation might be used for decision support and political discussions.
Ford (1999) evaluates the reasons for cyclical investments in electricity generation units. The impact of several aspects, such as capacity payment, investor’s behavior and the linkage of
14 the electricity and gas market is closely analyzed. Ford (1999) states, that the introduction of a constant capacity payment reduces the cyclical investment behavior. In comparison to business clients, private clients only seem to be affected slightly by the introduction of capacity payments. For business clients, prices rise in the short term, but decrease after a certain time, so the concept would not be disadvantageous either.
Dyner (1997) introduces a SD model to evaluate different political or regulatory incentives in the Columbian electricity market. The model is structured in socio economic influence, price formation and electricity demand and supply. Different political scenarios are simulated. Considering CO2 taxes, capacity payments and wind power subsidies, Sanchez et al. (2007) examine the capacity expansion of electricity generation units. The model includes a strategic production cost component, a future market and a component that evaluates the credit ranking of the simulated companies. The combination of volatile feed-in (mainly renewable) and controllable generation units is examined in particular. The demand-supply balance is determined by the annual calculation of a price duration curve. Investment decisions for new wind turbines or combined cycle power plants are based on the calculation of a discounted present value of each project.
Hasani & Hosseini (2011) evaluate seven different mechanisms to ensure adequate generation capacity available. Whereas certain markets were modeled without specific market mechanisms, others introduce a price ceiling, a price floor and capacity markets. Result of the investigation is that in a capacity market the monthly update of the price signal leads to weakened cyclical investment behavior. Furthermore, Hasani & Hosseini (2011) state that a hybrid version combining a capacity market with a cost-based mechanism is most effective. He et al. (2008) examine different regulatory instruments with the aim of avoidance of cyclical investment behavior in the liberalized market. Five scenarios are evaluated, in which the interaction of different market players and different generation technologies are not considered. In yearly simulation sequences the hourly electricity prices are calculated and integrated into a price duration curve. He et al. conclude, that under perfect market conditions, the energy-only mechanism is able to achieve the optimal level of generation investment and leads to stable and reliable market conditions. However, as real markets are not perfect, the energy only mechanism is likely to fail. Capacity payment mechanisms might help to overcome investment barriers, but could also induce over-investments problems. Assili et al. (2008) evaluate different capacity payment mechanisms. A perfect market is assumed, where capacities are offered at marginal costs. Under these conditions, Assili et al. (2008) reason, that for long term consideration the simulation of competing technologies is
15 more appropriate, than modeling different market players. The result of the SD-model is that a variable capacity payment leads to a stabilized marked dynamic. Fixed capacity payments also weaken investment cycles. However without capacity payments significant investment cycles could be observed.
Dyner et al. (2007) examine the Columbian market with the aim to identify if the reliability charge mechanism serves its purpose. A particularity of the Columbian market is the high share of hydropower with about 70 %. In this model, the regulation authority procures an ex ante defined quantity of pull options for electricity supply. Suppliers obtain an option premium regardless if appointed power is requested. In bottleneck situations with high prices, the regulation authority can request agreed quantities for a defined strike price. The study’s result is that a reliability charge serves its purpose in principle. However the considered instrument’s impact takes effect after a certain time, so that minor bottleneck situations may occur.
Dyner et al. (2001) analyze different regulatory requirements: role of a reserve market and an options market. The model’s result is that both approaches lead to stable markets.
Arango (2007)examines the consequences of different regulatory approaches for investments in new generation units. Beside an options market, safeguarding against failure is simulated. Utilities gain acceptance of bid, if their price is below the intersection of supply bidding and demand curve. For capacity expansion four technologies are available. Transmission grid restrictions are considered with the help of geographical distribution of generation units. Possible investments are evaluated with the real options approach. Aspects like reliability, generation costs and volatility are considered.
Park et al. (2007) evaluate different methods for rating capacity payments. For this purpose Park et al. compare a system with fix capacity payments with a mechanism where the capacity premium is based on loss of load probability (LOLP) as function of reserve margin. The model is made up of the modules pricing, capacity development and investment decision. Different scenarios are compared with a basis scenario, in which electricity prices are determined by base load marginal price and system marginal price. Beside those revenues, utilities receive capacity payments for repressed capacity. Yearly investment decisions are reached with the help of discounted present value.
ii.
MARKET DESIGN
Ford (2006) analyzes the consequences of an introduction of a taxation of CO2 emissions and a fixing of CO2 emission allowance. With the model of Ford (2008) different scenarios are
16 compared with the macroeconomic forecast of the Energy Information Administration California. Both scenarios conclude that rising electricity supply costs come along with CO2 emission reduction in the same percentile amount. Ford (2006) states, that both instruments are expedient.
Vogstad (2005b) evaluates the influence of emissions trading on the electricity market. Different trading strategies for renewable energy certificates are identified by experiments considering borrowing and banking. On the basis of historical prices, future prices are anticipated daily. As the setup is experimental, strategic aspects, like focusing on trends or consciously retention of certificates are covered.
Based on the same model, Ford et al. (2007) evaluate situations with strong wind feed-in, extensive banking and borrowing of green certificates as well as a combination of renewable energy certificates and CO2-emission capping.
Using a SD model, García-Álvarez et al. (2005) study the bidding behavior of the Spanish electricity market players regarding market power. The result is that the major utilities in Spain can perform market power. The authors, however, only describe their results and do not describe in detail the underlying model.
Although gas and electricity utilities are active on both fields, the regulation of gas and electricity markets is sometimes done by different authorities. Bunn et al. (1997) discuss the topic of market power, which is achieved by simultaneous activities in the field of gas and electricity supply. The model is described in detail by (Bunn & Larsen, 1992, 1994). Three trading strategies, namely increased volatility, retention of capacity and new hedging contracts are considered. The result of the Investigations is that in the considered market of the UK market power persists.
iii.
TRANSMISSION GRID AND MARKET COUPLING
Ojeda & Garces (2007a, 2007b) evaluate the effects of a market coupling. The pooling is evaluated by seven scenarios, like nuclear power face out or increased wind power generation. Ojeda & Garcés (2007a, 2007b) conclude, that the reliability of electricity supply is improved by a jointly arrangement of the reserve power market. This occurs even though the modeled system operator maximizes its profits.
Ojeda et al. (2009) model a market based transmission network connection of two markets. The grid operators are interested in new grid capacities, if he can profit from price spreads and the right of use can be sold for an attractive price. Two regulatory approaches are evaluated, namely the retention of transmission capacity and generation capacity. By virtue of the
17 simulation results Ojeda et al. (2009) recommend the permission of strategic behavior of transmission network operators.
Dyner et al. (2011) discuss the question, how many electricity markets can be merged by market coupling mechanisms. Several political directives are discussed. The result of the simulation is, that the market integration leads to a diminution of electricity prices and to a more efficient electricity production, related to CO2 emissions whereat technical, political and regulatory issues may not be neglected. Dimitrovski et al. (2004, 2007a) deal with the previous question how transmission grids can be modeled best possible.
Turk & Weijnen (2002) model a generic SD model for infrastructure markets. In retro perspective on the crisis of the Californian electricity market, the authors examine the causal relationship and criteria of the reliability of an infrastructural system. Conclusion of the study is that only through continuous monitoring of the identified performance criteria and appropriate measures based on this monitoring allows ensuring stability in grid operation in the long term.
Hui (2009) models in detail the problem of investment in grid infrastructure. Different incentive systems are evaluated and an improved planning process is developed.
Dimitrovski et al. (2007b) combine in their model of the Western Electric Coordination Council (WECC) short- and long-term mechanisms. Topics like regulation, investor behavior, environmental impacts and system design are addressed. A special feature is that transmission grid constraints are considered. Although the model is applied for the West African Electricity Pool, it can be applied for different countries.
iv.
EXTENSIVE MARKET MODELS
While most of the modeling approaches for deregulated electricity markets do not consider competition inherent uncertainties, most of the regulated market models don’t take into account competitive dynamics and decentralized decisions. Therefore Botterud (2003) picks up this requirement and creates a model that can be used both by companies for decision support in their investment decisions in generation units as well as by regulatory authorities to simulate the market with different regulatory frameworks. Finally approaches to identify optimal investment alternatives and economic approaches for decentralized energy systems are combined. In contrast to most of the SD models in the electricity sector, Botterud (2003) determines uncertainties with a real options approach, instead of the discounted present value. The most important aspects of the model are summarized by Botterud et al. (2002).
18 With its SD model, Olsina (2005) addresses issues within a long-term horizon. The model examines the contribution of different market mechanism to long-term security of supply. The timing of decisions for new capacities is studied and the role of other variables that determine long-term development is considered. This also involves the question how cyclical investment behavior comes into existence. The simulation results show, that regulatory influence has to be initiated quite early, so that the necessary capacity is always available and electricity prices stay stable. The reason therefore is mainly the long delay periods. As major determinants Olsina (2005) identifies development of demand, interest rates, market concentration and price caps. Olsina (2005) argues that regulatory price caps can be used thoughtful to provide price stability.
Sanchez (2009) pursues the objective to abolish shortcomings of the SD method by integrating other simulation methods. Furthermore an important development is that Sanchez (2009) takes the oligopolistic structure of electricity markets into account. By the improved modeling of the spot and the forward market, the bidder behavior, the forecast of future prices and generation capacity models are closer to reality than before. The implementation of these aspects is described in (Sanchez, 2009). The specific application of this model is described in (Sanchez et al., 2007, 2008).
Vogstad (2004) models with “Kraftsim” the “Nord Pool” electricity market in an extensive manner. In particular, the competition between generation technologies is discussed while the competition between companies is considered secondary. Because price and demand development is modeled endogenous analysis of energy political and regulatory framework is feasible. Focus of Vogstad’s study is the supply side of the electricity market and its emissions of CO2. Even a green certificate module is integrated. Result of the examination is that in the short term more renewable generation units will be built. However, the aggregate CO2 emissions rise in the long term, because of replacement power stations of the renewable units. The green certificate module is used for developing trading strategies for market participants and for predicting the price development of the certificates. Another component of the model is the modeling of hydro power plants and hydro power storage. By quantifying the value of the stored water, generation strategies can be developed.
A peculiarity of the model of Grobbel (1999) is that grid restrictions are considered. The model is characterized by a high resolution with numerous technical details of the German electricity
19 market. Nearly 5000 feedback loops are modeled. By considering the grid constraints, also regional differences are taken into account and are integrated into the model.
With the model LEMM (Liberalized Electricity Market Microworld) of Pasaoglu (2006) different business strategies for utilities can be evaluated as well as programs for regulatory authorities. The short and long-term dynamics of supply and demand sides are considered. Pasaoglu (2006) quotes “Excellent tool to be used in understanding, investigating and experimenting on a decentralized electricity market, especially in regard to investor behavior, supply, demand and price fluctuation, short and long term effects of various decisions and resource limitations.” Decisions are taken by using an analytical hierarchy process. The model is made up of a demand, capacity expansion, electricity generation, accounting and finance module. For new investments in generation units, utilities can choose out of different technologies like solar, wind, carbon, gas, oil and hydropower. Beside political and socio-economic aspects factors like resource availability, environmental impact and costs are considered. Pasaoglu & Or (2006) apply the model LEMM and simulate several scenarios. They emphasize, that in a deregulated environment “imperfect foresight” prevails.
v.
PEDAGOGIC APPLICATIONS AND BUSINESS WARGAMING
Franco et al. (2000) implemented the model EnerBiz II, for training Columbian energy and electricity traders. Franco et al. (2001) build on the existing model and permit imparting of knowledge in strategy development and risk management. Dyner et al. (2009) focus on the precise training cycle and user interface of the software. Pasaoglu (2011) describes the educational benefits of using a SD model like Pasaoglu (2006) and Pasaoglu & Or (2008) for explaining causal relationships in an electricity market. Vlahos (1998) explains in his publication the model set up of “the electricity markets micro world” and which actors play a crucial role and how the software can be used for educational purposes. Dyner et al. (2003) describe in detail how SD models can be used for training purposes in the environment of deregulated electricity markets.
Ochoa et al. (2002) examine the concept of portfolio strategy with regard to electricity trading. The SD model is used to simulate utilities’ choice to invest in three different divisions, namely information technology, education programs and marketing activities. Each of these aspects is described with the help of a feedback loop. Ochoa et al. (2002) state, that investments have an impact on the level of differentiation, segmentation and cost leadership.
20 For the management of water reservoirs and running-water power stations Van Ackere & Ochoa (2009) investigate different decision rules, however, pump storage units were not considered so far, because of their complex operation mode. A total of more than 80 strategies were evaluated. Price is determined by a merit order dispatch. Deregulated markets and regulated markets are considered. Result is that the introduction of strict guidelines, which aim to reduce the strategic use of hydropower plants leads to little use of hydropower plants. In this scenario operators only deplete the reservoir at very high prices. This results in high overall costs. Even a loss of welfare is observed.
A tabular model overview about the above mentioned publications and models is provided below.
21
TABLE 1: OVERVIEW OF CONSIDERED MODELS
Author (Year) Research focus, particularity Geographical Area
Scenario Time Horizon
Simulation Time
Step Institution Regulated / monopolistic market
Meadows et al. (1972) Limits to growth Global Late 21st century
Massachusetts Institute of Technology (MIT)
Naill (1972) Resources Global
Massachusetts Institute of Technology (MIT)
Naill (1976) Resources Global
Massachusetts Institute of Technology (MIT)
Sterman (1987) Expectation formation - - -
Massachusetts Institute of Technology (MIT)
Ford et al. (1987) Policy analysis Columbia 20 years Yearly Washington State University, Pullman
Rego (1989) Delay and financing Argentina 1988 - 2003
National Council of Scientific and Technological Research of Argentina (CEMA)
Biair (1991) Analytical models - - -
Massachusetts Institute of Technology (MIT)
Dyner et al. (1993) Residential energy policies Medellin
Metropolitan Area, Colombia
20 years Yearly Universidad Nacional de Colombia
U.S. Dept. of Energy
(1993) Energy analysis U.S.A. 40 years Quarterly
U.S. Department of Energy
Barney et al. (1995) Sustainable development Bangladesh 50 years
No information found
Millennium Institute, Arlington
Fiddman (1997) Climate economy model Generic
1960 – 2100 and 2300
No information found
Massachusetts Institute of Technology (MIT)
22
Neubauer et al. (1997) Models to study competition Pacific North West 1993 - 2010
No information found
FNT Consulting, Portland
U.S. Dept. of Energy
(1997) Introduction to SD - - -
U.S. Department Of Energy
Fiddman (1998) Climate-economy model Generic
1960 – 2100 and 2300
No information found
Ventana Systems, Inc., Sultan
Osgood (2003) Renewable resources - - - -
Bassi (2006) U.S. energy model U.S.A. 2005 - 2050 Yearly Millennium Institute, Arlington
Forest (2006)
Revisiting classic energy
models - - -
Leeds Metropolitan University, UK
Bassi (2007) Behavior description U.S.A. 2007 - 2050 Yearly Millennium Institute, Arlington Ochoa (2007) Policy changes Swiss - - Universite de Lausanne, Switzerland Bassi (2008) Understanding energy issues U.S.A. 2007 - 2050 Yearly Millennium Institute, Arlington Backus (2009) Energy policy - - - Sandia National Laboratories, NM Ochoa & Ackere (2009) Dynamics of Swiss market Swiss 2004 - 2024 Monthly London Business School
Deregulated / liberalized market – Investment decisions, regulation
Ford (1983) Policy evaluation Generic 1980 - 2005 Yearly
Los Alamos National Laboratory, New Mexico
Bunn & Larson (1992) Investment behavior England and Wales 1990 - 2030 Yearly London Business School Bunn et al. (1993) Privatization United Kingdom 1993 - 2030 Yearly London Business School Bunn & Larson (1994) UK electricity investment England and Wales 1994 - 2030 Yearly London Business School
Dyner & Bunn (1997) Energy policy Columbia Columbia 15 years Qarterly Universidad Nacional de Colombia
Ford (1999) Cycles in electricity markets
Western United
States 1998 – 2018 3 months
Washington State University, Pullman
Larsen & Bunn (1999) Strategic and regulatory risk Generic No simulation No simulation City University Business School, London
Gary & Larsen (2000)
Performance of
out-of-equilibrium markets Generic 1996 - 2020 Yearly
London Business School, Sussex
Dyner et al. (2001) Planning to strategy Generic No simulation No simulation Universidad Nacional de Colombia
Ford (2001)
Study of power plant
construction California 8 years Hourly
23
Qudrat-Ullah & Davidsen (2001)
Electricity supply, resources
and pollution Pakistan 2000 - 2030 Yearly
National University of Singapore
Arango et al. (2002)
Investment in generation
capacities Colombia No limit 6 months
University of Bergen and Colombia
Vogstad et al. (2004) Environmental policy
Nordic electricity
market 30 years Yearly
NTNU Trondheim
Kadoya et al. (2005) Deregulation PJM & ISO-NE 2005 -2025 6 blocks per day Institute of electrical engineers of Japan Qudrat-Ullah (2005) Decision support Pakistan 30 years Yearly York University, Toronto
Olsina et al. (2006) Long term dynamics
Deregulated power
markets 2000 - 2020 1/16 monthly
Univ. Nacional de San Juan, Argentina
Arango (2007) Alternative regulation Colombia 2000 - 2012 Daily, Monthly
Universidad Nacional de Colombia, Medellin
Dimitrovski et al. (2007) Long term expansion
Western Electric
Coordinating Council 2005 - 2035 Monthly
School of Electrical Engineering and Computer Science
Dyner et al. (2007) Secure electricity supply Colombia 10 years Monthly
Universidad Nacional de Colombia, Medellin
Goidosch (2007) Investment cycles Germany 2004 - 2034 Monthly, Yearly TU Berlin
Park et al. (2007) Investment incentives Korea 2006 - 2020 Yearly Korean Electric Power Research Institute
Sanchez et al. (2007)
Generation expansion
planning Competitive markets
Universidad Pontificia Comillas, Madrid
Assili et al. (2008) Capacity payment
Liberalized electricity
markets 30 years Yearly
Ferdowsi University of Mahhad, Iran
He et al. (2008) Capacity mechanism analysis Generic 30 years Yearly
North China Electric Power University, Beijing
Sanchez et al. (2008) Long-term investment Generic Generic Yearly Universidad Pontificia Comillas, Madrid Acevedo & Aramburo
(2009) Capacity utilization
Deregulated power
markets Not specified Yearly
Universidad Nacional de Colombia
Jäger et al. (2009) Energy policy
German electricity
market 30 years Yearly
EIFER, Karlsruhe
24
PT Syed Jalal & Bodger
(2010) Generation expansion New Zealand 2010 - 2050
No information found
University Tenaga Nasional Putrajaya, Malaysia
Tan et al. (2010) Evaluating risky projects Generic 20 years Monthly University of Texas, Austin
Hasani & Hosseini (2011) Capacity mechanisms Generic 2010 - 2040 Hourly Sharif University of Technology, Tehran
Deregulated / liberalized market – New market design/structure and components/market power
Bunn et al. (1997) Latent market power United Kingdom 1994 - 2004 No information London Business School García-Álvarez et al.
(2005) Effects of deregulation Spain 72 days Hourly
University of La Coruna
Vogstad (2005b) Market design Sweden, Norway 2005 - 2020 Secondly
Norwegian University of Science and Technology
Ford (2006)
Impact of carbon market on electricity system
Western electricity
council (WECC) 2005 - 2025 Monthly
Washington State University, Pullman
Ford et al. (2007) Price patterns for certificates Northwestern U.S.A. 2006 - 2020 Monthly Washington State University, Pullman
Ford (2008)
Reduction in carbon dioxide emissions
Western electricity
council (WECC) 2005 - 2025
No information found
Washington State University, Pullman
Transmission grid
Ojeda & Garces (2007a) Merchant interconnection Generic 20 years Yearly
Bremer Energie Institut, Germany Instituto de Energía Eléctrica, Argentinia
Ojeda & Garces (2007b)
Dynamics of Swiss electricity
market Generic 20 years yearly
Bremer Energie Institut, Germany Instituto de Energía Eléctrica, Argentinia Ojeda et al. (2009) Transmission interconnections Generic 20 years Yearly Instituto de Energia Electrica, Argentina Dyner et al. (2011) Electricity market integration Latin America 2010 - 2025 Monthly Universidad Nacional de Colombia
Extensive models Grobbel (1999) Competition in electricity generation Germany and neighboring
countries 15 years Weekly
University of Oldenburg
Turk & Weijnen (2002)
Analyzing market performance Generic No information found No information found
Delft University of Technology
25
Dimitrovski et al. (2004)
Investment and growth in electric power systems
Western US & West
Africa 2000 - 2025 Hourly
Washington State University, Pullman
Olsina (2005) Long-term dynamics Generic 20 years Monthly
Universidad Nacional de San Juan, Argentina
Vogstad (2004) Nordic electricity market
Nordic Electriciy
Market 30 years Weekly
Norwegian University of Science & Technology, Trondheim
Pasaoglu & Or (2006) Liberalized electricity market Generic 20 years Monthly Bogazici University, Istanbul
Dimitrovski et al. (2007) Long-term modeling
Western Electric
Coordination Council 20 years Hourly
Washington State University
Hui (2009) Transmission Investments Generic 20 years Yearly Washington State University
Sanchez (2009) Long-term planning Generic 20 years Yearly Universidad Pontificia Comillas de Madrid
Other models
Vlahos (1998) Electricity markets Generic Defined by user Defined by user London Business School
Franco et al. (2000) Training traders Colombia 10 years
Quarterly (4 per year)
Universidad Nacional de Colombia, Medellin
Franco et al. (2001)
Strategy and risk
management Colombia 10 years
Quarterly (4 per year)
Interconexion Electrica E.S.P.
Ochoa et al. (2002) Strategic electricity trading Generic
No information found
No information found
Universidad Nacional de Colombia
Dyner et al. (2003)
Simulation for organizational
learning Generic No information No information
Universidad Nacional de Colombia
Dyner et al. (2009) Games for electricity traders Colombia 10 years
Quarterly (4 per year)
Universidad nacional de Colombia, Medellin
van Ackere & Ochoa
(2010) Hydro-energy reservoir Generic 1 year Hourly
Université de Lausanne, Switzerland
26
4.
SUMMARY AND OUTLOOK
The method SD is widely used for electricity market modeling. Generally, system-wide research questions such as the investigation of cyclic investment behavior in generation capacity dominate. However the modeling of selected aspects of electricity markets is supported by the capability to describe decision processes descriptively by considering the concept of bounded rationality. Furthermore, “imperfect foresight” such as uncertainties during capacity expansion planning supports realistic models. Moreover unlike most alternative methods, qualitative aspects can easily be incorporated into SD models, and therefore SD is an appropriate method for modeling electricity markets.
By the help of the presented review, three major trends in SD modeling could be identified: Firstly, SD models are increasingly combined with other methods: E.g. Pereira & Saraiva (2009, 2010, 2011) combine SD with generic algorithms, Acevedo & Aramuro (2009), Vogstad (2005b) incorporate experimental economics, Pasaoglu (2006) integrates an analytical hierarchy processes, Dyner et al. (2011) implement an iterative algorithm, Tan et al. (2010) use the method of decision trees, Sanchez et al. (2008) combine SD with game theoretical approaches and Butterud (2003) and Arango (2007) consider the real options approach. Secondly, models with stochastic variables can be found progressively. For example Vogstad (2006), Butterud (2003) and Olsina et al. (2006) build on variable distributions by applying Monte Carlo Simulations within their models.
Thirdly, models are more and more detailed and simulate aspects such as new markets designs: E.g. Vogstad et al. (2002) model CO2-certificates, Vogstad (2005b) and Ford et al. (2007) model green electricity certificates and Anderson & Parker (2011) model the integration of renewable energy sources and the use of storages.
Due to the turnaround in energy policy, decentralized electricity generation, consideration of grid restrictions (see Dimitrovski et al. (2007)) or the demand side might gain in importance. Another emerging topic is the future role of storage power stations, which will probably gain in importance in SD modeling. This comes along with smaller simulation steps and high-resolution RES feed-in profiles. These aspects might be included in SD models in the future.
27 Acevedo, J.A.C., Aramburo, S.A., 2009. Capacity utilization in electricity market behavior: an experimental analysis. Proceedings of the 27th International Conference of the System Dynamics Society.
Arango, S., 2007. Simulation of alternative regulations in the Colombian electricity market.
Socio-Economic Planning Sciences, Volume 41, Issue 4, pp. 305-319.
Arango, S., Smith, R.A., Dyner, I., Osorio, S., 2002. A System Dynamics Model to Analyze Investments in Power Generation in Colombia.
Assili, M., Javidi, D.H.M., Ghazi, R., 2008. An improved mechanism for capacity payment based on system dynamics modeling for investment planning in competitive electricity environment.
Energy Policy, Elsevier, Vol. 36, No. 10.
Backus, G., 2009. A History of Making Energy Policy. Proceedings of the 27th International Conference of the System Dynamics Society.
Balnac, K., Bokhoree, C., Deenapanray, P., Bassi, A.M., 2009. A System Dynamics Model of the Mauritian Power Sector. Albuquerque, New Mexico, USA.
Barney, G.O., Eberlein, R., Qui, W., Sharma, P., 1995. The Threshold 21: Sustainable Development Model. Tokyo, Japan.
Bassi, A.M., 2006. Modeling U.S. Energy with Threshold21 (T21). [Online]
Available at:
http://www.millennium-institute.org/resources/elibrary/papers/Modeling%20US%20Energy%20with%20T21.pdf Bassi, A.M., 2007. Threshold 21 (T21) USA: Behavior Description. Boston, Massachusetts, USA. Bassi, A.M., 2008. Understanding Energy Issues and Informing the U.S. Energy Policy Debate with T21, an Integrated Dynamic Simulation Tool, VDM.
Biair, P., 1991. The role of analytical models: issues and frontiers. Stanford.
Botterud, A., 2003. Long Term Planning in Restructured power Systems: Dynamic Modelling of Investments on New Power Generation under Uncertainty. Dept. of Electrical Power Engineering, NTNU.
Botterud, A., Korpas, M., Vogstad, K., 2002. A dynamic simulation model for long-term analysis of the power market. Sevilla.
28 Bunn, D.W., Dyner, I., Larsen, E.R., 1997. Modelling Latent Market Power Across Gas and Electricity Markets. System Dynamics Review 13, pp. 271-288.
Bunn, D.W., Larsen, E.R., 1992. Sensitivity of reserve margin to factors influencing investment behaviour in the electricity market of England and Wales. Energy Policy, Volume 20, Issue 5, pp. 420-429.
Bunn, D.W., Larsen, E.R., 1994. Assessment of the uncertainty in future UK electricity investment using an industry simulation model. Utilities Policy, Volume 4, Issue 3, pp. 229-236. Bunn, D.W., Larsen, E., Vlahos, K., 1993. Complementary Modeling Approaches for Analysing Several Effects of Privatization on Electricity Investment. The Journal of the Operational Research Society. Vol. 44, No. 10, pp. 957-971.
Dimitrovski, A., Ford, A., Tomsovic, K., 2007b. An interdisciplinary approach to long-term modelling for power system expansion. International Journal of Critical Infrastructures, Vol 3,
pp. 235-264.
Dimitrovski, A., Gebremichaela, M., Tomsovica, K., Ford, A., Vogstad, K., 2004. Comprehensive modeling of the long term dynamics of investment and growth in electric power systems.
Dimitrovski, A., Tomsovic, K. & Ford, A., 2007a. Comprehensive Long Term Modeling of the Dynamics of Investment and Network Planning in Electric Power Systems, pp. 235-264.
Dyner, I., Bunn, D.W., 1997. A System Simulation Platform to Support Energy Policy in Columbia. In: Systems Modelling for Energy Policy, Chichester: John Wiley & Sons.
Dyner, I., 2001. From planning to strategy in the electricity industry. Energy Policy, pp. 1145-1154.
Dyner, I., Arango, S., Franco, C.J., 2007. Can a Reliability Charge Secure Electricity Supply? An SD- based assessment of the Colombian power market.
Dyner, I., Larsen, E.R., Franco, C.J., 2009. Games for electricity traders: Understanding risk in a deregulated industry. Energy Policy, pp. 465-471.
Dyner, I., Larsen, E.R., Lomi, A., 2003. Simulation for Organisational Learning in Competitive Electricity Markets. Risk and Flexibility in Energy Markets, pp. 205-234.
29 Dyner, I., Calle, R., Rendón, L.D., Arango, S., 2001. Simulation for Alternative Regulations in the Power-Supply Industry: Lessons for California. Atlanta.
Dyner, I., Smith, R.A., Pena, G.E., 1993. System Dynamics Modeling for Energy Efficiency Analysis. Conference Proceedings of the 11th International Conference of the System Dynamics Society, Cancun, Mexico.
Enzensberger, N., 2003. Sektorenspezifische Analysen zu den Konsequenzen eines europäischen Emissionsrechtehandels - Entwicklung und Anwendung eines Strom- und Zertifikatemarktmodells für den europäischen Energiesektor. Fakultät für Wirtschaftswissenschaften, Universität Karlsruhe (TH), VDI, Düsseldorf.
Fiddaman, T., 1997. Feedback Complexity in Integrated Climate-Economy Models. Ph.D. Thesis. MIT Sloan School of Management.
Fiddaman, T., 1998. A Feedback-Rich Climate-Economy Model. Proceedings of the 16th International Conference of the System Dynamics Society. Quebec
Ford, A., 1983. Using simulation for policy evaluation in the electric utility industry. Simulation, Vol. 40 No.3, pp. 85-92.
Ford, A., 1997. The Changing Role of Simulation Models: the Case of the Pacific Northwest Electricity System. In: Bunn, D.W., Larsen, E.R. Systems Modeling for Energy Policy. Chichester Ford, A., 1999. Cycles in competitive electricity markets: a simulation study of the western United States. Energy Policy, Volume 27, Issue 11, pp. 637-658.
Ford, A., 2001. Waiting for the boom: a simulation study of power plant construction in California. Energy Policy, Elsevier, Volume 29, No. 11, pp. 847-869.
Ford, A., 2006. Simulating the Impact of a Carbon Market on the Electricity System in the Western USA.
Ford, A., Bull, M., Naill, R.F., 1987. Bonneville's conservation policy analysis models. Energy Policy, Volume 15, Issue 2, pp. 109-124.
Ford, A., Vogstad, K., Hilary, F., 2007. Simulating price patterns for tradable green certificates to promote electricity generation from wind. Energy Policy 35, pp. 91-111.