2012 National Report to the
European Commission
(Covering the period 01.01.2011 – 31.12.2011)
Regulatory Authority for Energy (RAE)
Athens, October 2012
REGULATORY AUTHORITY FOR ENERGY 132, Piraeus str., 118 54 Athens, Greece Tel.: +302103727400, Fax: +302103255460 E-mail : info@rae.gr, Website: www.rae.gr
Table of contents
1. Foreword 4
2. Main developments in the gas and electricity markets 6
2.1. Electricity 6
2.2. Natural Gas 7
3. Regulation and Performance of the Electricity Market 9
3.1. Network Regulation 9
3.1.1. Unbundling 9
3.1.2. Technical functioning 9
3.1.2.1.Security and reliability standards, quality of service and
supply 9
3.1.2.2.Monitoring time taken to connect and repair 10
3.1.3. Network tariffs for connection and access 10
3.1.3.1.Transmission Network Tariffs for Access 11 3.1.3.2.Distribution Network Tariffs for Access 12 3.1.3.3.Transmission Network Connection Tariffs 14 3.1.3.4.Distribution Network Connection Tariffs 14
3.1.4. Cross-border issues 14
3.1.4.1.Access to cross-border infrastructure 14
3.2. Promoting Competition 19
3.2.1. Wholesale market 19
3.2.1.1.Description of the wholesale market 19
3.2.1.2.Price Monitoring 24
3.2.1.3.Monitoring the level of market opening and competition 28
3.2.2. Retail market 32
3.2.2.1.Description of the retail market 32
3.2.2.2.Price monitoring 34
3.2.2.3.Monitoring the level of transparency 38
3.3. Consumer protection 41
3.3.1. Compliance with Annex 1 41
3.3.2. Definition of Vulnerable customers 42
3.3.3. Public Service Obligations 43
3.3.4. Statistics on disconnections and new connections 45
3.3.5. Handling of consumer complaints 46
3.4. Security of supply 48
3.4.1. Monitoring balance of supply and demand 48
3.4.2. Monitoring investment in generation capacities in relation to SoS 52 3.4.2.1.Monitoring investment in generation capacities in relation to
SoS 52
4. The Gas Market 53
4.1. Network Regulation 53
4.1.1. Unbundling 53
4.1.2. Technical functioning 53
4.1.3. Network and LNG Tariffs for Connection and Access 54
4.1.4. Cross-border issues 56
4.2. Promoting Competition 57
4.2.1. Wholesale Markets 57
4.2.1.2.Monitoring the level of transparency 58
4.2.2. Retail Markets 60
4.3. Consumer Protection 61
4.3.1. Compliance with Annex 1 61
4.3.2. Definition of Vulnerable Customers 61
4.4. Security of Supply 62
4.4.1. Monitoring Balance of Supply and Demand 62
4.4.1.1.Current demand 62
4.4.1.2.Projected demand 65
4.4.2. Expected Future Demand and Available Supplies 65 4.4.3. Measures to Cover Peak Demand or Shortfall of Suppliers 68 Appendix I - List of licensed electricity Suppliers and Traders at the end of 2011 69
i. List of Acronyms 71
ii. List of Figures 73
1. Foreword
Year 2011 was marked by the adoption of the new Energy Law 4001/2011, on 22.08.2011, that transposed the Third Energy Package into national legislation. The new law introduced major changes to the Greek electricity and natural gas markets, and strengthened the competencies of RAE regarding security of supply, licensing, monitoring of the energy market and consumer protection. Overall, the new law considerably improved the legislative framework for the regulation, monitoring and control of the domestic electricity and gas sectors.
In the electricity sector, the potentially positive effects of a) the stability in terms of market structure, b) the significant capacity surplus in the wholesale market, and c) the substantial increase in competition and supplier switching in the retail market, were largely cancelled out by the unfavourable economic conditions in the country, and, in particular, by the continuing decline in electricity consumption and the sharp increase in unpaid consumer bills and in business and credit risks, too.
Setting the basis at the end of 2011, and continuing its efforts throughout 2012, RAE has launched an intense public debate regarding the reorganisation and necessary structural reforms in all aspects of the Greek electricity market. The main objectives of the structural changes proposed by RAE include:
− To create the proper background in order to achieve harmonisation of the domestic electricity market with those of the neighbouring countries, in the framework of the single Internal European Market (Target Model).
− To ensure access of all participants, in a transparent, efficient and equal way, to the country’s indigenous energy resources, mainly lignite and water, so as to create competitive portfolios of comparable energy costs.
− To further remove the distortions and cross-subsidies in the retail prices, with rational allocation of costs among the various consumer categories, so as to guarantee the long-term development of the energy sector, on the basis of the economic viability of the corresponding investments and infrastructure development.
In addition, RAE’s priorities in the electricity sector for 2012 also include the certification of ADMIE SA, as the TSO following the ITO model, as well as the licensing of DEDDIE SA as the DSO, setting strict criteria for their independence from the mother company, PPC SA. In the natural gas sector, 2011 was a year of solidification of the competitive conditions that were successfully introduced into the market in 2010. This was demonstrated by the increased number of new players entering the market, the price and overall contract renegotiations carried out by the incumbent with both its foreign suppliers and its large domestic customers, the first wholesale trading deals emerging between new suppliers and the expressed interest for new infrastructure development by third parties, including transit pipeline projects of the Southern Gas Corridor.
Strictly in the regulatory front, and besides its contribution to the transposition of the Third Energy Package into Greek legislation, RAE expedited and intensified its work towards: a) the transformation of the TPA regime to an entry-exit system, in compliance with the Gas Regulation, b) the monitoring and improvement of transparency and of the overall competitive conditions in the market, and c) the reform of the existing security of supply scheme, in compliance with the Security of Supply (SoS) Regulation. On the other hand, changing conditions on the privatisation and unbundling scheme of the incumbent, as
decided by the Greek government in late 2011, have delayed progress in the TSO certification process.
Overall, RAE considers 2011 to be a successful year for the liberalisation and more efficient operation of the domestic gas market, since the competitive conditions proved to be sustainable, despite the harsh economic conditions in the country, and progress was indeed achieved in critical interim steps, towards full implementation of the Third Energy Package by 2014. The priorities of RAE in the gas sector for the next reporting period include: a) the establishment of entry-exit TPA tariffs, allowing for the full reform of the TPA regime, in order to be compatible with a gas hub, b) the timely completion of the security of supply scheme, in compliance with the SoS Regulation, and c) the establishment of a greater degree of integration with the neighbouring Member States, allowing for better competitive and SoS conditions in the entire SEE Region.
Last but not least, it is important to point out the serious steps backwards introduced by certain provisions in the new Energy Law 4001/2011, regarding the Regulator’s resources and its independence in managing them. As an example, RAE’s personnel was included in all fiscal measures applicable to the general public sector, which implied: a) an average reduction of 50% in their salaries, with the immediate effect of having several of its senior scientists leaving RAE, and b) RAE’s inability/prohibition to hire any new personnel for an indefinite period of time. Under these circumstances, RAE will soon not be able to carry out, in any satisfactory way, the increased responsibilities and competences bestowed upon the Regulator by the Third Energy Package and Law 4001/2011, in a period when RAE’s strong involvement is most needed by the market.
2. Main developments in the gas and electricity markets
2.1. Electricity
Following the passing of the new Energy Law 4001, in August 2011, PPC established a 100% subsidiary, ADMIE SA, which now owns and operates the transmission system, according to the ITO model. DESMIE SA, the former TSO, was for the most part absorbed by ADMIE and the rest was restructured to become the new wholesale Market Operator, LAGIE SA. The distribution network ownership remained with PPC, although its operation was assigned to another 100% subsidiary of PPC, DEDDIE SA. The official operation of these companies commenced in 2012.
In the wholesale market, the revised market design fully implemented in September 2010, after gradual evolution over the previous five (5) years, has completed in 2011 its first full year of application, remaining, for the first time, stable in terms of its structure and objectives. In addition, substantial new IPP capacity entered the system over two consecutive years, 2010 and 2011, reducing PPC’s market share to 75% in 2011, relatively to 85% in 2009, and intensifying competition in generation, for medium and peak load demand.
The retail market was characterised, for the first time, by a substantial increase in supplier switching. Especially in the medium-voltage segment, nearly 10% (by eligible volume, i.e. MWh) of industrial and commercial customers had switched supplier by the end of 2011. Still, PPC’s retail market share remained very high in 2011, at 92%, calculated with respect to eligible volume. Several problems were encountered in relation to procedures supporting the opening of the supply market, such as delays in supplier switching, data provision, disconnections and reconnections, market settlement, etc. These problems, while in part justified by the usual “arrhythmias” encountered during the first realisation of the retail market opening, were also a result of the DSO remaining, throughout 2011, an operational unit of the incumbent (PPC S.A.).
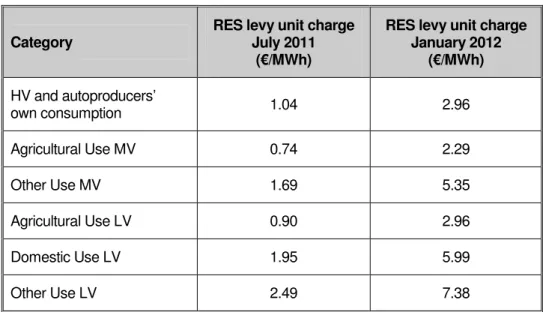
In June 2011, RAE issued a Decision on Tariff Guidelines for the non-regulated tariffs, applicable to all suppliers active in the electricity market. Regarding high-voltage (HV) tariffs, which have been deregulated since the end of 2007, negotiations between PPC and HV customers have not progressed significantly, the HV customers accusing PPC for not taking into account, in their tariff setting, their consumption volume, load profile and other specific characteristics. Several official complaints against PPC have been submitted to RAE since the last quarter of 2011, which are under investigation. At the end of 2011, all price regulation for the medium-voltage customers was removed too, while price regulation for the domestic and small-enterprise, low-voltage, customers remained in effect throughout 2011 and 2012, and is expected to be fully removed by mid 2013.
Debt problems, which have escalated in 2012, raised unprecedented challenges for the market participants, the TSO and the Regulator. Severe liquidity problems and credit risks started to emerge in the energy sector, partially reflecting the deepening economic recession, but also the effect of State policies regarding retail (domestic) tariffs and renewables feed-in prices. Costs were not correctly reflected or adequately transferred across the value chain, creating sustained debts, especially in the renewables account managed by the TSO, and gradually diminishing the Operator’s liquidity.
Two other policy choices put into effect in 2011, namely the introduction of a tax levy on natural gas (including gas for electricity production) and the incorporation of a new property tax into the electricity bill, created severe adverse effects on competition and on consumers’ ability to pay their bills.
This dire situation underscored the need for urgently defining and applying alternative ways to move forward, and has stimulated, with the initiative of the Regulator, discussions for serious structural reforms, consistent with the need for market adjustment and alignment to the EU Target Model, envisaged for 2015. To this effect, in December 2011 (and then in July 2012), RAE published its proposals for the reorganisation of the domestic wholesale electricity market, outlining a specific roadmap and action plan, in the framework of integration of the European electricity market.
2.2. Natural Gas
Law 4001/2011 assigned to RAE all the competencies provided for in the Gas Directive of the Third Energy Package, as well as the role of Competent Authority for the Security of Gas Supply. The law prescribed for ownership unbundling of the incumbent (DEPA S.A.). However, this decision was amended later in the same year, to allow both options to be available to the Greek State, either for ownership unbundling, or for the ITO model.
In August 2011, after a public consultation launched at the end of 2010, RAE approved the first revision of the Network Code, aimed at increasing the transparency and liquidity in both the LNG and the transmission-capacity markets, and setting the basis for virtual reverse flow and for gas resale transactions through the national grid. Furthermore, the Network Code introduced a complete set of new provisions regarding infrastructure development in Greece, in line with the provisions of the Third Energy Package.
In November 2011, RAE launched a public consultation on a TSO’s proposal for a new Tariff Regulation, introducing a decoupled entry-exit tariff model in the domestic gas market. The consultation procedure (including a second round) and the approval by RAE of the new Tariff Regulation, as well as of the actual entry-exit tariffs were concluded in the summer of 2012. This development constitutes a major step on the way to a full reform of the Greek TPA system, towards a decoupled entry-exit regime, in full compliance with the Gas Regulation.
Furthermore, during 2011, RAE undertook a series of monitoring exercises that contributed to the TSO’s efforts towards a substantial improvement in the level of transparency in the capacity market.
On the market side, an increasing number of third parties continued to independently import LNG and to perform wholesale transactions, maintaining an 11% market share in 2011, practically equal to their market share in 2010. Given that demand increased in 2011 by 25% compared to 2009, reaching a level of 4.8 bcm/year, it is evident that increased quantities of gas are being imported by new suppliers.
During 2011, RAE received three (3) applications for the development of new infrastructure in Greece by third parties (“Independent Gas Systems”), namely: a) the development of a new LNG terminal, b) the development of an underground storage (UGS) facility in an offshore depleted gas field, and c) the construction of the Trans-Adriatic Pipeline (TAP). The latter was accompanied by a request for exemption from certain third-party access and
unbundling provisions, according to article 36 of the Gas Directive. The three regulatory authorities involved in the TAP application (RAE, AEEG of Italy and ERE of Albania) have approved, after close cooperation, the rules for the performance of the market test anticipated by article 36 of the Directive, which is currently (2012) underway. The LNG terminal application was granted a license in July 2011, while granting of a license for the development of the UGS is subject to pending government decisions regarding privatisations in the energy sector.
Last but not least, 2011 was a busy year regarding Security of Supply. The most prominent activity related to the implementation of EU Regulation 994/2010 was the Risk Assessment Study, which was completed on time and sent to the Commission on December 14th, after extensive consultation and collaboration with a) the Hellenic Gas Transmission System Operator S.A. (DESFA), b) the Hellenic Electricity Transmission System Operator S.A. (DESMIE), c) the Public Gas Corporation (DEPA), in its quality as supplier of gas to protected consumers under long-term gas import agreements, and d) representatives of the Ministry of Environment, Energy and Climate Change.
3. Regulation and Performance of the Electricity Market
3.1. Network Regulation
3.1.1.
Unbundling
Within the context of the European Union’s Directives and under the legislatory framework of Law 4001/2011, the spin-off (legal and operational unbundling) of the transmission activity from the vertically-integrated PPC S.A. took place in 2011. The Independent Power Transmission Operator, ADMIE S.A., a 100% subsidiary of PPC, was registered as Société Anonyme in November 2011, by having transferred to it all relevant transmission assets, activities and personnel, and reported its first financial statements on 31.12.2011. Its official operation started on February 1st, 2012.
In November 2011, RAE issued Decision 1412 on the “Guidelines for the Certification of Transmission System Operators”, which describes the evaluation criteria and the documentation required for certification. The Transmission System Operator (TSO) candidate must document its legal and operational unbundling from the vertically-integrated enterprise, established on the grounds of (a) the independence of management, (b) the independence of financial resources, and (c) the independence of operational activities. The first phase (i.e. through the National Regulator) of the certification process for ADMIE SA was completed in July 2012, by the issuing of RAE’s decision 672/2012, which was then forwarded to the European Commission for its further consideration and approval.
For the purpose of this Report, regarding the period 1.1.2011-31.12.2011, DESMIE SA had the role of both the TSO and the Market Operator (MO).
Referring to the Distribution Activity, the legal and operational unbundling took place in May 2012, with the establishment of DEDDIE S.A., as the Hellenic Electricity Distribution Network Operator, a 100% subsidiary of PPC, and the transfer of the entire distribution business unit to this new company. The network assets, however, still belong to PPC.
3.1.2.
Technical functioning
3.1.2.1. Security and reliability standards, quality of service and supply
Network Performance and Quality of Service
In December of 2010, RAE published an integrated set of Regulatory Instructions for the reporting of the Transmission System performance1. Following these instructions, the TSO published reports on the performance of the Transmission System for the years 20102 and
1 http://www.rae.gr/site/system/docs/misc/11012011.csp
2 May 2011 - http://newsite.desmie.gr/fileadmin/user_upload/Files/study/FINAL-PERFORMANCE_REPORT2010-HTSO.pdf
20113 . The reports provide availability indices for overhead lines, underground cables and autotransformers, as well as indices for the impact of the system unavailability to customers (system minutes).
Performance and quality-of-service standards and obligations, as well as the respective monitoring processes, have not been set for the Distribution System Operator yet; therefore, currently, the DSO does not report any Quality of Service (QoS) indicators. Relevant requirements are to be developed under the umbrella of the Distribution Network Code. The proposal of RAE for the Distribution Network Code envisages a penalty/reward scheme for QoS regulation. In this context, the role of the Regulator includes the following:
i. Setting, per regulatory review period, of the regulated service quality dimensions, the corresponding overall and individual minimum quality standards, as well as the respective penalties/rewards, in conjunction with the allowed revenue of the distribution.
ii. Approval of rules, procedures and methodologies for monitoring, assessing and reporting service quality levels.
iii. Validation of data completeness and accuracy.
Until the Code is finally enforced, substantial preparatory work has already been carried out. Review of the PPC rules, procedures and data regarding QoS dimensions monitored to date has been established by the Regulator since 2008. So far, this has allowed the Regulator to report on the overall service quality level, based on available, non-verified, historical data up to 20104, and to formulate and publish its opinion on these data, as well as on current PPC practices regarding service quality monitoring and reporting and on necessary improvements thereof.
3.1.2.2. Monitoring time taken to connect and repair
Monitoring DSO performance in connecting new users falls within the aforementioned initiative undertaken by the Regulator over the previous four (4) years.
Concerning connection of new generation facilities, monitoring issues do arise for the DSO as, in several circumstances, it takes significant time to respond to requests for connection offers to RES generators. Connection offers by the TSO do not exhibit significant delays, as the number of requests is by far smaller than the requests faced by the DSO.
3.1.3.
Network tariffs for connection and access
In general, network access tariffs in Greece are of the ‘Postage Stamp’ type, with the ‘G’ component equal to 0% and the ‘L’ component equal to 100%.
3 March 2012 - http://www.admie.gr/to-systima-metaforas/anaptyxi-systimatos/meletes/archeio/document/43280/doccat/detail/Document/ 4
3.1.3.1. Transmission Network Tariffs for Access
Transmission Network tariffs are calculated on the basis of the annual transmission system cost, which is defined in the Grid and Market Operation Code5 as the sum of the annual rent owed to the network owner, now ADMIE S.A., plus the annual cost of any work for the expansion of the System. The annual system cost is also adjusted to take into account the difference between the forecasted and the actual revenue from system users during the previous year. For 2011, the estimated rent owed to the asset owner (PPC) was €264.9m, whereas the total transmission costs to be recovered through the tariffs were €261.7m, accounting for the interconnection auction revenues (€34.9m)6 and under-recovery of costs through the charges applied in previous years (€31.7m)7. The elements of the transmission cost in 2011 were as follows:
• Allowed operating expenses: €82.4m.
• Asset depreciation: €746 million.
• Capital employed: €1,347 million, including €71.1m of new investments
• Allowed Rate of Return (nominal, pre-tax): 8%.
The Capital employed (RAB) and the Asset depreciation were determined, for the period 2010-2011, by excluding the effect of assets’ revaluation in 2009 (the revaluation surplus for the Transmission Division was €340.4m).8
The methodology for the calculation of the Transmission Use of System (TUoS) tariffs for HV connected customers is set out in the Grid and Market Operation Code, while the one for customers connected to the Distribution Network (MV and LV) is set out in a related Manual approved by RAE9.
Tariffs for HV-connected customers follow a €/MW structure, charged on the customer’s average hourly demand during the following three hours: system summer peak, system winter peak and the maximum of the two. Demand is adjusted for losses depending on the connection voltage. Given the limited metering capabilities of consumers connected to the MV and LV networks (lack of measurements of coincident peaks), for the purpose of calculating TUoS charges, the transmission cost is further allocated to the two voltage levels based on their total energy consumption. The methodology, set out in the relevant manual, further specifies the following:
• For the purposes of TUoS charging, the following four (4) customer categories apply: Domestic, Domestic with Social Tariff (KOT)10, MV and LV, excluding Agricultural MV and Agricultural LV that have zero TUoS charges.
• Only capacity charge (no energy charge for TUoS) is applied to MV customers, which is charged based on the maximum metered demand (MW) during peak hours (11am-2pm).
5
Ministerial Decision ∆5-ΗΛ/Β/8311/9-05-2005 and subsequent amendments. 6 RAE Opinion 371/2010
7
RAE Opinion 377/2010 to the Ministry of Environment, Energy and Climate Change.
8 The revaluation carried out by an independent firm of appraisers for accounting purposes (according to IAS 16).
9
RAE Decision 2215/2010. 10
In July 2010, a third public service was introduced, a Social Tariff for Domestic Customers, referred to as “KOT”. This reduced tariff applies to vulnerable customers. The starting date for the implementation of the new tariff was set for the 1st of January 2011 (Ministerial Decision of September 2010 (Official Gazette, B 1614). See Section 3.3.2.
• Only energy charge (no capacity charge for TUoS) is applied to Domestic customers with Social Tariff (KOT).
• For Domestic customers (except for Domestic customers with Social Tariff), only 10%11 of the allocated cost is recovered through capacity charges, which are charged on the basis of the connection capacity (kVA), given the lack of metered demand (MW).
• For other LV customers, only 20% of the allocated cost is recovered through capacity charges, which are charged on the basis of the connection capacity (kVA) given the lack of metered demand (MW).
According to the above mentioned methodology, RAE proposed the following tariffs to the Ministry of Environment, Energy and Climate Change for 2011 (the tariffs for MV and Other LV customers remained similar to those for 2010 and 2009):
Customer Category Capacity Charge
(€/MW or €/kVA)
Energy Charge (c€/kWh)
HV 26,365 €/MW chargeable
demand (3 coincident peaks) -
Domestic 0.16 €/kVA of Subscribed
Demand per year 0.605*
Domestic with Social
Tariff (KOT) - 0.671
MV (non agricultural)
2,025 €/MWof Monthly Maximum Demand at
peak-period, per month
-
LV (non agricultural) 0.70 €/kVA of Subscribed
Demand per year 0.576*
*Applies to daytime consumption only, for customers with zonal metering Table 1. Transmission Use of System (TUoS) charges for 2011
3.1.3.2. Distribution Network Tariffs for Access
There is currently no formal methodology set for the calculation of the allowed distribution revenue, given that the Distribution Network Code (which will include the methodology for estimating the annual distribution costs) has not been adopted yet. As a transitional measure, the methodology applied is the one currently used for the transmission system12. The elements of the distribution cost in 2011 were as follows13:
• Allowed operating expenses: €459.2 million
• Asset depreciation: €140.8 million.
• Capital employed: €2,854.6 million.
11 Based on 2215/2010 RAE Decision, this cost percentage was reduced from to 20% to 10%. 12 Ministerial Decree of 31 Dec. 2007, following RAE opinion 294/2007
13
• Allowed Rate of Return (nominal, pre-tax): 8%.
The Capital employed (RAB) and the Asset depreciation were determined, for the period 2010-2011, by excluding the effect of assets’ revaluation in 2009 (the revaluation surplus for the Distribution Division was €421.9m).
As a result, the total allowed revenue for the distribution activity in 2011 was €828.3m, whereas the total distribution costs to be recovered through the tariffs were €818.3m (thus accounting for an estimated €10m for “Other Revenues” of the activity).
Of this, about €79m were set to be recovered by MV connected consumers and the remaining by LV connected consumers.
For the purpose of calculating Distribution Use of System (DUoS) charges, customers are categorised based on their connection voltage and metering capabilities. More specifically, consumers were categorised into five categories: MV customers, LV customers with subscribed demand >25 kVA (with and without reactive power metering), LV residential customers, and other non-residential LV customers.
For MV customers, 50% of the cost is recovered through a capacity charge and 50% through an energy charge. For domestic customers, 10% of the cost is recovered through a capacity charge and 90% through an energy charge. These percentages for the Other LV customers are 20% and 80%, respectively.
The final resulting Use of System unit charges for Distribution in 2011, per customer category, are presented in the following table. The unit capacity charge is applied on the customer’s subscribed demand for LV customers and on the Monthly Maximum Demand
registered at daily peak-hours for the MV customers. The unit energy charge is applied to the metered energy, adjusted for the average power factor (assumed to be equal to 1 for costumers without reactive power metering).
Customer Category Capacity Charge (€/MW of
Monthly Maximum Demand at peak-period, per month)
Energy Charge (c€/kWh)
MV 1,210 0.33
Capacity Charge (€/kVA of Subscribed Demand per
year)
Energy Charge (c€/kWh) LV (subscribed demand >25
kVA) with reactive power metering
4.14 1.70
LV (subscribed demand >25 kVA) without reactive power metering
3.65 1.93
Domestic 0.59 2.17
Domestic with Social Tariff
(KOT) - 2.41
Other LV (subscribed
demand ≤ 25 kVA) 1.80 1.93
3.1.3.3. Transmission Network Connection Tariffs
Only “shallow” connection costs, i.e. from the plant site to the appropriate connection point of the transmission system, are charged to producers. The charges are applied by the TSO, for specific activities carried out by the TSO that are related to the connection works performed by the generators themselves (e.g., review of connection works studies, acceptance tests for built connection networks, etc.). Such charges have not been approved by the Regulator yet. According to the provisions of Law 4001/2011, a detailed pricelist is to be submitted by the TSO to RAE for approval.
3.1.3.4. Distribution Network Connection Tariffs
A methodology for setting connection tariffs has not yet been approved by the Regulator. The methodology is envisaged to be part of the Distribution Network Code, which is still in preparation.
3.1.4.
Cross-border issues
3.1.4.1. Access to cross-border infrastructure
The relevant electricity market for Greece is, to a significant extent, the national market, as a regional market has not emerged yet. The total interconnection capacity in 2011 was 2000 MW. This level was reached in 2010, after the addition of a new interconnector eastwards, with Turkey14 (500 MW). Following its full synchronisation in September 2010 and a trial operation period since then, commercial trading with Turkey started in June 2011. While trading volumes progressively increased, reaching 2.6 TWh by the end of the year, the impact of the interconnection on wholesale prices was not evident, as, simultaneously, imports from the northern borders were reduced due to economic substitution and portfolio diversification effects.
More specifically, interconnection with adjacent member states (namely Italy and Bulgaria) amounts to 1300 MW (500 MW and 800 MW, respectively), a sum which corresponds approximately to 13% of the annual peak demand (approximately 10,000 MW), while interconnections to Albania and FYROM are restricted to 200 MW total. Romania, another member state with an emerging, relatively liquid, power exchange, is also relevant for price comparisons, as it is indirectly connected, although not adjacent, to Greece. Nevertheless, various aspects of the transit flows through Bulgaria remain ambiguous, due to lack of transparency.
14
A 400 kV interconnection between Greece and Turkey (nominal capacity 2000 MVA) was completed in 2008. Since then, the focus was on the synchronous operation of the two systems and, particularly, the fulfilment of UCTE network operation standards by the Turkish system.
Overall, the net interconnection balance declined from 5.7 TWh in 2010 to 3.2 TWh in 2011. This decline is better understood if split into import and export patterns. Overall, imports declined from 8.5 to 7.2 TWh (-15%), while exports increased from 2.8 to 3.9 TWh (40%). This net decline reflects the erratic dynamics of regional price spreads, an escalation of exports to Albania, due to severe hydro scarcity, and to some extent, to the removal of constraints in auction rules which had limited export activity in the past. The opposite condition occurred in 2010, when Albania experienced a surplus of hydro power, resulting in substantial flows to Greece (404 GWh).
A re-allocation of import quantities across adjacent countries also occurred, as commercial trading with Turkey developed, with corresponding imports increasing from 0.7 to 2.6 TWh. Exports to Italy declined from 2.3 to 1.7 GWh, in response to more erratic and less favourable price spreads, partially due to the impact of the economic recession on Italian prices and the simultaneous rise in Greek prices, two effects which were occasionally counter-acted. Still, the price differential between Italy and Greece strongly signalled exports to Italy over prolonged periods, with some reverse signs over off-peak periods (00:00-08:00), where pure imports were occasionally conducted. Imports from Italy remained low, but increased from 67 GWh in the previous year to 274 GWh, partially during temporal irregularities, such as a PPC strike in June, and the rising wholesale prices in Greece after a new tax levy was imposed on gas (including gas for electricity) since September 2011. Imports from Bulgaria declined from 3.5 to 2.8 GWh, while imports from FYROM decreased as well, from 3.9 to 1.5 GWh, reflecting water scarcity in the Balkan region and, hence, reduced price spreads. Exports to Albania escalated from 0.4 to 2.1 TWh, reflecting the impact of a prolonged drought, given the 98% hydro share in the country’s generation. For the same reason, quantities exported to FYROM remained marginal, but still increased from 8 GWh to 109 GWh.
Figures 1 and 2 display the allocation of interconnection trading in 2011 and its evolution relatively to 2010.
Focusing on price differentials, the premium of the Italian baseload retained substantial levels over 2011, mostly fluctuating between 15-30 €/MWh, and exceeding 50 €/MWh in some outstanding cases (August peak). These values imply substantial profits for exports to Italy over 2011, as well as potential profits for imports to Greece, whenever the sign reversal of the spread occurred and to the extent that this could be anticipated. As a representative price index in adjacent northern countries has not emerged yet, Romanian prices can be used as a plausible proxy. These prices exhibited a large discount relatively to Greek prices in 2011, which, given regional similarities, explains the large inflows to Greece from northern borders. More specifically, the premium of the Greek baseload relatively to the Romanian was quite erratic but substantial overall, often exceeding 25 €/MWh. Still, spread reversals were realised more often and with a higher persistence than in the previous year.
Usually, up to 15 companies were actively trading on the interconnection with Italy and significantly less, regularly around 5-10, at the northern borders and Turkey. As the constraint relating to security of supply in Greece was removed from the auction rules in 2010, and transit flows were exempted from uplift costs (reflecting the operation of the Greek wholesale market), cross-border trading was expected to become more efficient. Still, export activity was constrained in 2011, and the hydro shortage in Albania was only a temporal favourable condition.
The introduction of intra-day balancing in the Italian market since January 2011 allowed traders to adjust their positions after the closure of the Greek day-ahead market, eliminating this part of their uncertainty, while retaining their exposure to market conditions in Italy (prices, quantity, penalties). This change had an impact on the pricing of imports from Italy.
Import prices, which used to be zero in the past, so as to secure their flows, reflected now traders’ predictions and, quite often, they were interpolations between the marginal costs of different plant technologies. In this context, certain strategies, typically of a reserve order to all others and of minor quantities, may occasionally influence the SMP in Greece and even reverse the price spread. The synchronisation of the two markets and the convergence of their imbalance penalties could avert such incidences.
Net Imports across Interconnections
-3.000.000 -2.000.000 -1.000.000 0 1.000.000 2.000.000 3.000.000 4.000.000 5.000.000
Turkey Albania Fyrom Bulgaria Italy
Country
M
W
h 2010
2011
Figure 1. Net trading volumes across countries. Positive values represent net imports and negative values net exports.
Imports and Exports Allocation
0 500.000 1.000.000 1.500.000 2.000.000 2.500.000 3.000.000 3.500.000 4.000.000 4.500.000
Turkey Albania Fyrom Bulgaria Italy
M
W
h
Imports 2010 Exports 2010 Imports 2011 Exports 2011
Significant changes also occurred in auction rules and auction implementation in 2011, both in the interconnection with Italy and with the Balkan countries. In order to facilitate market integration and harmonization of cross-border congestion management, capacity allocation for the Italian borders within the Central – South (CSE) region was performed, effective April 1st 2011, by the Capacity Allocation Service Company (CASC S.A.), the company which also performs the capacity allocation functions for the CWE region borders. The 2010 auction rules continued to apply for the period 1st January - 31st March 2011. This development enhanced compliance with the EC Regulations 1228/2003 and 714/2009. Points that now remain to be addressed are the ex-ante determination of the percentage fractions of capacity allocated across yearly, monthly and daily basis, and the intra-day allocation and management of capacity rights (which seems challenging in the absence of intra-day trading in the energy market).
In the past few years, integration with adjacent Balkan countries was subject to trading obstacles, due to the lack of appropriate implementation of Regulations 1228/2003 and 714/2009, especially regarding capacity allocation mechanisms and transparency issues. Following the second infringement letter issued by the European Commission in July 2009, significant improvements towards full compliance with Reg. 1228/2003 started to take place, from 2010 onwards. Significant changes that occurred in 2011 include: (a) the introduction of joint auctions for the allocation of the total capacity (with the Bulgarian TSO performing the monthly auctions and the Greek TSO the yearly and daily ones, along with the secondary market management), (b) common rules for the secondary market, and (c) a common clearing procedure for congestion revenues with equal allocation between the two system operators. A common approach regarding the determination of NTC between the two system operators (in accordance with 714/2009) has not emerged yet.
Regarding the interconnection with Albania and FYROM, the TSO’s discretion to implement capacity rights curtailments, by claiming security of supply issues in the Greek market, was abolished. The auctions would be performed every day (including public holidays) and their time-framework was synchronized with CASC auctions. The concept “use it or sell it” (UIOSI) was re-introduced for the non-declared yearly or monthly rights in the daily auctions. Regarding Turkey, the interconnection entered its commercial operation in June 2011. Due to sudden, non-scheduled changes in load flows at its initial stage, the full implementation of the 714/2009 Regulation has not been feasible yet.
The main principles of interconnection congestion management rules in 2011 remained unchanged, as compared to 2010:
Annual, Monthly and Day-ahead (D-1): Explicit Auctions of Physical Transmission Rights (PTRs)
UIOSI rule applied to long-term PTRs (reallocation by HTSO at Monthly and Day-Ahead Auctions) and UIOLI at the time of firm nomination
Long-term PTRs are freely transferable between participants, subject to TSO approval of transferee eligibility.
Allocated long-term PTRs are subject to cancellation by the TSO until the deadline for declaration of intention to use (D-1, prior to day-ahead auction) and up to a total of 35 days per year, in which case PTR holder is compensated at 100% of the long term auction price.
Under this scheme, during 2011, HTSO managed capacity allocation on the interconnections and directions as presented below.
Counterpart Country
Imports to Greece % of NTC
Exports from Greece % of NTC Bulgaria* 100% yearly, 100% daily 100% yearly, 100% daily FYROM 50% 50% Albania 50% 50% Turkey 50% 50%
* Monthly auctions performed by the Bulgarian TSO (ESO-EAD)
Table 3. HTSO responsibility for capacity allocation on interconnections
Income from congestion management has been used for purposes complying with the provisions of Reg.1228 and CM Guidelines, namely to reduce transmission network tariffs (see also Section 3.1.3.1 above).
3.2. Promoting Competition
In 2011, the Greek wholesale market grew more mature, in the sense that substantial new capacity entered the system, intensifying competition for medium- and peak-load demand. However, severe liquidity problems and credit risks started to emerge in the domestic energy sector, partially reflecting the country’s continuing economic recession, but also the adverse effects of “generous” policies regarding retail prices and renewables tariffs. The relevant implemented policies, although appealing to governments in the context of social policy and strong renewables growth, respectively, were internally inconsistent as revenue streams. Costs were not correctly reflected, or adequately transferred across the value chain, creating sustained debts in the renewables account, managed by the TSO, and gradually diminishing its liquidity. Two other policy choices applied in 2011, i.e. the introduction of a tax levy on natural gas and the inclusion of a new property tax in the electricity bill, also created adverse effects on competition and on consumers’ ability to make payments, respectively. Debt issues, which continue to escalate in 2012, raised unprecedented challenges for the market participants, the TSO and the Regulator. This potentially explosive situation stimulated an intense discussion on alternative ways to move forward, which is likely to result in the introduction of substantial structural reforms in the coming months, consistent with the need for market adjustment to the EU Target Model envisaged for 2015.
3.2.1.
Wholesale market
3.2.1.1. Description of the wholesale market
The Greek wholesale electricity market has been organised as a pure mandatory pool since its inception in 200515, so as to allow competition to emerge, in a context which, however, had a severe constraint: no structural reforms were implemented on PPC, the previous public electricity monopoly, such as plant divestures or release of consumers, as was the case in other European countries. In particular, the incumbent remained dominant in both the generation and the retail sectors, retaining exclusive access to cheap lignite and hydro resources, while retail prices, despite the gradual removal of cross-subsidies, remained unlinked to wholesale prices. This combination of unfavourable market conditions posed severe obstacles to new entrants in the early years of market liberalisation, resulting in capacity shortage over the subsequent years. The capacity certificate mechanism introduced in 2006 created incentives for new investment, which turned out to be adequate, as almost 2000 MW of new, IPP gas-fired capacity has been added to the system by the end of 2011. Still, projections for strong and prolonged demand growth (around 2.5% annually) were disrupted in 2009, when demand sank by 7%, due to the then erupting economic crisis, and has not recovered since. Hence, a substantial capacity surplus has emerged, with limited export possibilities and limited cost-reduction capability. In addition to diminished demand levels, the increasing penetration of renewables steadily curtails gas generation, to an extent that may even expose them to the take-or-pay penalties implicit in their gas-supply contracts.
15
After gradual refinements, the transitional market design, implemented over a five-year period, was succeeded on 30th September 2010, marked as the “5th Reference Day”, by its final provisional form. The revised market design thus reflects the full implementation of the 2005 Grid and Market Operation Code. See previous Reports for a detailed description of the transitional design.
Furthermore, wholesale prices remained low, not reflective of the full energy production cost. Their levels are suppressed due to significant amounts of compulsory quantities, including a) mandatory hydro, b) plants’ minimum operational levels, and c) renewables, which currently constitute a fast escalating cost component. The widening difference between (depressed) wholesale price levels and high feed-in-tariffs applied to the reimbursement of renewables production has created a sustained (not temporal, but structural) debt in the renewables account, managed by the TSO, something that reduces its liquidity and hence, its ability to pay conventional generators and importers, too. At the same time, consumers’ debt (unpaid electricity bills) escalated to €1.4 billion (estimated value) at the end of 2011, due to the severe economic recession and the incorporation of a property tax into the electricity bill, which catapulted the amount due. This convolution of adverse conditions and inconsistent policies has created severe financial problems to all market participants and to the TSO, which started to become more pronounced in 2011, and escalated drastically in 2012, signalling the urgent need for tariffs to be adjusted, or for new sources of financing to be found for stabilising the renewables account.
In this challenging environment, the revised market design, fully implemented in September 2010, after gradual evolution over the previous five (5) years, has completed in 2011 its first full year of application, remaining stable in terms of its structure and objectives. Various design details got progressively more refined, so as to address technical or credit risk issues that emerged since then. In essence, this market design reflects the full implementation of the 2005 Grid and Market Operation Code. One of the key features that differentiates it from its previous transitional form is that it has introduced a clear distinction between the day-ahead market and the balancing mechanism that follows, as in other countries with mandatory pools. This structure reflects more clearly the factors influencing prices, the uncertainties involved and the implied risks at these distinct time scales. More specifically, during the transitory market regime, the Day-Ahead market provided an indicative plant-commitment schedule and a reference spot price (SMP forecast), which served purely as a signal. Cash-flows were based on ex-post SMP prices. These were derived by re-solving the same cost-minimisation algorithm as in the day-ahead schedule, by inserting actual metered values of the various inputs (mainly demand, plant availabilities and renewables’ output), instead of day-ahead forecasts. These ex-post prices were applied to the actual quantities consumed or produced (the latter reflecting, to a large extent, the real-time dispatch orders of the TSO).
As opposed to an overall market settlement (through ex-post SMP prices), the current market design involves two distinct settlement processes:
• The settlement of the day-ahead market, in which generators’ payments (suppliers’ charges) are calculated, based on the SMP prices and the plant schedules derived from the day-ahead dispatch (load declarations submitted).
• The settlement of imbalances, in which deviations from day-ahead schedules are charged or compensated, depending on whether they are exogenous or reflect the TSO dispatch orders.
• There is also a provision for imbalance penalties, if certain limits are violated, regarding the magnitude and the frequency of the deviations.
In the day-ahead market, uniform pricing still applies, reflecting the offer of the most expensive unit dispatched, so that predicted demand is satisfied along with plant technical constraints and reserve requirements. Zonal pricing, intended to reveal congestion problems and signal the location for new capacity, has not been activated yet, although two zonal prices (for northern and southern Greece), applicable to generators, are explicitly derived, currently only as an indication. Participants may enter into bilateral financial contracts (CfDs), but physical delivery transactions are constrained within the pool and related contracts do not exist. A cap of 150 €/MWh has been imposed on generators’ offers.
The following rules or supplementary mechanisms still apply:
• A lower limit is imposed on generators’ offers, equal to the minimum variable cost of each unit in each trading period. This has been introduced because, in the current structure, the incumbent has a strong incentive to suppress wholesale prices.
• A cost-recovery mechanism ensures that generators dispatched by the TSO, beyond the day-ahead schedule, are remunerated based on their declared minimum variable costs plus a 10% margin. This mechanism creates a safety net, which often makes participants rather indifferent to the price levels.
• A Capacity Adequacy Mechanism is applied for the partial recovery of capital costs, with suppliers being obliged to buy capacity certificates from generators. The value of these certificates was revised in November 2010, from 35,000 to 45,000 €/MW/year, in order to alleviate the impact of low demand on generators’ revenues. This value was retained throughout 2011.
Provision of Balancing Services
Balancing is not performed through a separate balancing market, but as an extension of the day-ahead market, through the Imbalance Settlement Mechanism, according to the following rules:
- All imbalances – referring to the differences between the day-ahead schedule and the real production or withdrawal of electricity – are settled through the Imbalance Settlement Mechanism.
- The timeframe for the imbalance settlement is one (1) hour.
- During real-time operation, balancing energy is provided by the responsible body, based on the economic merit order of the offers, that are submitted by the committed units on the day-ahead market.
- As soon as the relevant meter measurements are available, the imbalances are settled according to the following rule: each imbalanced party pays or receives an amount, depending on whether it injected or withdrew energy from the system, equal to the product of the ex-post clearing price and its imbalance quantity.
- The ex-post clearing price results from the re-run of the day-ahead scheduling algorithm under the realised values of the stochastic variables and corresponds to the “Market Clearing Price” (i.e. uniform price).
- Moreover, a cost recovery mechanism has been included, aiming to ensure that generators will receive at least their marginal cost whenever they operate. The aim of the imbalance mechanism methodology is to minimise the total cost of system operation, by giving adequate incentives for “proper” behaviour to the market participants.
The Balancing Settlement is performed by the TSO. Under certain circumstances (emergency cases), it is possible to use balancing energy from abroad, by using the residual capacity of interconnectors.
Financial Outcomes
Over the first full year of its implementation (2011), the revised market design had an impact on market participants’ cash-flows and on market conduct.
- The balancing cost was a minor fraction of the energy cost in the day-ahead market. Indicatively, the generators’ annual revenues from the day-ahead market added to €2.83billion, while in total, their imbalance charges slightly exceeded imbalance payments, yielding a (negative) net amount of €16.2 million. Suppliers’ imbalance charges were €62 million in total, mainly reflecting under-predictions of demand by PPC, while most other suppliers received imbalance payments.
- The imbalance charges that PPC paid for its lignite plants, which tend to exhibit production shortage in real time, relatively to their day-ahead dispatch, were counter-balanced to a large extent by the imbalance payments received by its hydro plants.
- The provision of ancillary services yielded 1% of total generators’ revenues over 2011. Given the capacity surplus and the co-optimisation of energy and ancillary markets, generators diminished their offers for reserve provision, so as to secure their dispatch even at their minimum operation level and receive subsequently a cost-recovery payment.
- The two supplementary mechanisms (cost-recovery and capacity certificates) yielded 20% of total generators’ revenues over 2011
- The cost-recovery mechanism translated into a charge of €130 million for PPC in 2011, as opposed to 28.5 million in 2010, reflecting the increase in IPP production.
Market Volume
The day-ahead market yields the reference price for the industry, as it constitutes the major component on which generators’ cash-flows are based. Due to the mandatory physical trading in this market, the traded volume of electricity is equal to the annual demand (including the interconnection balance), i.e. 51,872,288 MWh in 2011. This represents a decline of 0.94% relatively to 2010. A futures market has not been developed yet, while OTC trading has not been activated either.
Regulatory Progress in 2011
The regulatory focus in 2011 was on market adjustment to short- and medium-term challenges, varying from the specification of parameters related to the balancing mechanism, to the management of the credit risk issues that emerged, and the anticipated structural changes both in the TSO and in the market itself, as a way to alleviate asymmetries and become more compatible with the Target Model framework.
Indicatively, RAE worked on the following issues:
• The modification of the controversial excise tax imposed on natural gas from 1st September 2011 onwards, which yielded asymmetries among fuels. Initially added to the plants’ fuel cost and hence, reflected on wholesale prices, this tax was transferred adversely to suppliers and eventually, consumers. RAE proposed this tax to be removed from the plants’ offers and the corresponding amount to be recovered indirectly, through a specific market account (LP-3).
• The incorporation of CO2 emission costs into the minimum variable cost of plants (i.e. the lower limit of their price offers), with effect from 8 June 2011 onwards. This cost reflects, at a transitional stage, the cost of covering a plant’s emissions deficit (comparatively to free allocated credits) and the full emission cost from 2013 onwards (when free credits cease to apply).
• The systematic under-prediction of wind production, likely to influence the SMP. The TSO was required by RAE to refine its wind prediction model and to monitor its error structure.
• The incorporation of other renewables’ production (those connected to the distribution network, not the high-voltage grid) into the market resolution. The TSO was required by RAE to develop a forecasting model, so that this generation is explicitly inserted into the market resolution, as an additive term to predicted wind production (instead of its implicit subtraction from load declarations made by PPC).
• The correction of an error by the TSO in the application of the formula computing secondary reserve payments and charges.
• The understanding of cogeneration dispatch issues, potential competition effects and reimbursement mechanisms.
• The calculation of losses in interconnections and TSO’s potential reimbursement for loop flows.
• The clarification of the TSO’s credit cover approach and the follow-up on its handling of suppliers’ liquidity problems, in particular, as regards the guarantees required for their participation in the market (moving away from a “lenient” approach, towards a strict enforcement of the relevant Code).
• The provision of a two-month credit margin for charges relating to the RES levy, the PSO, the capacity certificates and the network and distribution use, so as to reduce the time gap between suppliers’ energy payments to the TSO and their cash inflows from consumer payments.
• The adaptation of the ITO model (as opposed to ISO), since February 2012, and hence, the re-structuring of the former TSO into two discrete entities:
- The Market Operator, which solves the day-ahead market, conducts its clearing, and engages into contracts with renewables producers.
- The System Operator, which owns the network, as a 100% subsidiary of PPC, conducts the real time dispatch, the clearing of the imbalance market and the settlement of all other charges or payments.
• The determination of basic principles for the certification of the new ITO.
• The splitting of the Market Code into a) the Grid Code and b) the Transactions Code.
• The establishment of the Distribution Network Operator and the development of its compliance procedure.
• The assessment of the relevance and effectiveness of virtual plant power auctions, or measures similar to NOME as applied in France, to the domestic market, so as to allow portfolio diversification and cost reduction for IPP generators, facilitating their entry into the retail market and hence, enhancing gains for consumers.
• Understanding the type, cost and efficiency of the market re-organisation options, in order to become compatible with the Target Model framework (in particular, harmonisation of auction rules for cross-border trading).
Regulatory measures regarding all the above issues were either adopted during 2011, or carried over to 2012 via public consultations. Choices for structural reforms were also explored in more detail in 2012, and relevant RAE proposals were presented for public consultation first in July 2012, and then in November 2012, in their final form.
With the objective to increase transparency by clarifying market parameters and market conduct, a daily market report was developed by RAE and has been uploaded on its website since July 2011. The report displays and summarises the dynamics of market fundamentals and market outcomes, such as schedules, market shares, emissions, as well as deviations between day-ahead and real-time quantities. In this context, distortions, such as systematic over- or under-declarations in generation or supply, are illustrated in easy-to-follow graphs.
3.2.1.2. Price Monitoring
In contrast to collapsing wholesale prices in the previous two years (2009 & 2012), those prices reverted to higher levels in 2011, displaying an average value of 59.36 €/MWh, and, hence, a substantial increase of 13.5% relatively to the price average in 2010 (52.30 €/MWh). This price reversal was not a sign of economic recovery, but reflected, to some extent, the impact of market fundamentals, and mainly the scarcity of hydro, after two successive years of intensely wet conditions. While water scarcity exerts an upward pressure on wholesale prices, due to the need for substitution by more expensive energy, this effect was less pronounced than in previous years, due to the substantial capacity surplus in the market.
Furthermore, the price rise was also due to the new tax levy imposed on natural gas, from 1st September 2011 onwards. This controversial tax, which raised concerns about its asymmetric impact on gas-fired electricity production vs. lignite production and imports, implied an increase of 5.4€/MWh in the variable cost of the gas plants (assuming maximum plant efficiency). The effect of this tax counteracted the downward trend in prices that the seasonal decline of demand would be expected to induce in certain months (e.g. October). The imposition of this tax, combined with the shrinkage in hydro production, yielded a sustainable price increase, from September 2011 onwards. Indicatively, the daily average price increased from 55.66 €/MWh on 31th August to 73.09 €/MWh on 1September (+31%), although the market fundamentals remained quite similar. At an aggregate level, the average price level escalated from 54.60 €/MWh prior to the tax levy to 68.83 €/MWh in the period after, while the average price in 2010 was 52.30 €/MWh.16
Price volatility in 2011 increased quite substantially. Prices exhibited a standard deviation of 23.18 €/MWh (19.55 €/MWh in 2010), reaching a maximum value of 150 €/MWh (price cap) in 14 hourly trading periods and a minimum of 0 in 35 periods, while in 5% of the trading hours, prices exceeded 100 €/MWh. Zero price levels occur during significant demand drops (typically the Easter break in April), when compulsory quantities (technical minima of plant generation, renewables and imports) may exceed consumption. Due to this surplus, imports, offered at a zero value, may get curtailed, setting the price to its minimum level. It is notable that this extreme case occurred only once in 2009, a fact that reflects the increasing penetration of wind generation.
Figures 3, 4 and 5 display the dynamics of the day-ahead price, SMP, across the year, as well as its intra-day profile. Given the revised market design introduced in September 2010, this price is the relevant market index, as it determines the largest part of participants’ cash-flows.
16
The methodology of inclusion of this tax into the variable cost of gas plants was modified by RAE in January 2012, so as not to be incorporated into the generators’ offers in the electricity daily market (SMP); still, it had an adverse effect on industrial and export activity, diminishing the competitiveness of Greek products.
SMP
30-day Moving Averages
30 40 50 60 70 80 90 100 110 120 1 /1 /2 0 1 1 1 /2 /2 0 1 1 1 /3 /2 0 1 1 1 /4 /2 0 1 1 1 /5 /2 0 1 1 1 /6 /2 0 1 1 1 /7 /2 0 1 1 1 /8 /2 0 1 1 1 /9 /2 0 1 1 1 /1 0 /2 0 1 1 1 /1 1 /2 0 1 1 1 /1 2 /2 0 1 1 € /M W h
Daily Level Daily MA Off-Peak MA (08:00-24:00) Peak MA (00:00-08:00)
Figure 3. SMP dynamics (actual and smoothed levels) over 2011
The intra-yearly evolution of prices reflects the seasonal variation of the constrained hydro releases (diminished levels overall, but increased from June to August, for peak-shaving purposes), the dynamics of gas prices, maintenance schedules and outages. In particular, severe outages occurred in two gas plants towards the end of the year (Protergia, an IPP gas-fired unit, and PPC’s Lavrio 5), rendering them unavailable over long periods of time (two and six months, respectively). At the end of June, a labour union strike at PPC, causing major capacity withholding (up to 20 plants), resulted in escalating prices (up to 108 €/MWh) over nine (9) days. It was also notable that in November 2011, demand showed an increase of 8% relatively to November 2010. It appears that air-conditioning units were used extensively for heating purposes at that time, as a substitute to heating oil, since the latter was perceived as a more expensive option for households. A secondary factor, which induced some price volatility in 2011, was the considerable trial-operation periods of new IPP plants. These plants induced occasional output variations from 300 to 4400
ΜWh on a daily basis. According to the market rules, their output entered the market as must-run generation, hence counteracting some of the upward pressure on prices, depending on the combination of other parameters, too.
Daily SMP Volatility
0 5 10 15 20 25 30 35 40 45 50 1 /1 /2 0 1 1 1 /2 /2 0 1 1 1 /3 /2 0 1 1 1 /4 /2 0 1 1 1 /5 /2 0 1 1 1 /6 /2 0 1 1 1 /7 /2 0 1 1 1 /8 /2 0 1 1 1 /9 /2 0 1 1 1 /1 0 /2 0 1 1 1 /1 1 /2 0 1 1 1 /1 2 /2 0 1 1 € /M W hFigure 4. SMP volatility (standard deviation) over 2011
SMP: Monthly Averages
54,2 56,5 52,1 50,4 52,6 59,6 59,7 52,0 61,8 62,5 73,4 77,6 40 45 50 55 60 65 70 75 80Jan Feb Mar Apr May Jun Jul Aug Sep Oct Nov Dec
€
/M
W
h
Figure 5. SMP intra-yearly pattern in 2011
Despite the declining market concentration at both sides of the market, wholesale prices remained sensitive to PPC’s bidding behaviour in 2011. Given its vertically-integrated structure, and in the presence of substantial retail margins for certain customer categories in the past, the dominant