© 2013 Maxwell Scientific Publication Corp.
Submitted: July 17, 2012 Accepted: July 31, 2012 Published: February 01, 2013
This work is licensed under a Creative Commons Attribution 4.0 International License (URL: http://creativecommons.org/licenses/by/4.0/).
Research Article
The Moderating Effects of Growth Opportunities on the Relationship between Capital
Structure and Dividend Policy and Ownership Structure with Firm Value in Iran: Case
Study of Tehran Securities Exchange
Kamal Ghalandari
Department of Business Management, Qazvin Branch, Islamic Azad University, Qazvin, Iran
Abstract: The purpose of this study is to investigate the moderating effect of growth opportunities on the relationship between Financial Decisions (capital structure and dividend policy) and Ownership Structure with Firm Value for firms listed in Tehran Securities Exchange. Totally, 120 firms were selected for sample and their data for five year (2007-2011) were extracted from their financial statements using software Tadbir Pardaz. In order to estimate models, software Eviews was used. Before data analysis, variable reliability test and Chow and Haussman tests were used in order to determine the model suitable for estimation of parameters and effect of independent variables on dependent ones. Then research hypotheses were tested using combined data and fixed effect model. Finally the results of data analysis showed that there was a significant relationship between capital structure (leverage) and dividend and firm value which in the case of presence of growth opportunities, this relationship was negative and significant but in the case of absence of it, that was positive and significant. Also results showed that there was a non-linear and significant relationship between ownership structure and firm value and that growth opportunities exerted a significant effect on this relationship.
Keywords: Capital structure, dividendpolicy, firm value, growth opportunities, ownership structure
INTRODUCTION
Determining firm value is among the major factors in investment process. Value of every firm can be determined with regard to its share value. Thus the investor decides about his/her investment priorities given the firm value. Among the factors influencing share value of firms, financial decisions (capital structure and dividend policy) may be mentioned. During recent decades, importance of financial decisions for firm value has become a major subject for academic research. Modigliani and Miller (1958) founded the capital structure theory based on assumption of perfect market competition and market equilibrium. Based on assumptions of perfect market competition, lack of taxes and transaction costs, absence of information asymmetry etc., they found that financing policy of firm had no effects on its current value. That theory later became known as capital structure irrelevance (Modigliani and Miller, 1958). In Miller and Modigliani (1961) also extended capital structure theory to dividend policy. They reasoned that until firm cash flow distribution is constant, given lack of taxes, dividend policy choice is of no effects on firm current value. Recently, studies by various scholars e.g., Lopez-Iturriaga and Crisostomo (2010), Torre et al. (2007) and Rodrigues (2000) examined the effects of capital structure and dividend decisions given imperfect capital markets (taxes, transaction costs, information
asymmetry and agency costs). The results obtained from these studies demonstrated the effects of these decisions on firm value (Lopez-Iturriaga and Crisostomo, 2010; Miller and Modigliani, 1961; Rodrigues, 2000). Creditors and shareholders can influence dividend policy and firm financing through the way of securing required capital. Furthermore, decisions on capital structure and dividend probably influence firm managers’ motivation and enhance their performance and in general, capital structure and dividend policy have effects on firm value (Barclay and Smith, 1999; Fama and French, 1998; Rizov, 2004).
According to conducted research, it is shown that relationship between firm value and financial decisions is a major issue for today financial markets and investors, but in most of those studies ownership structure is not considered. That factor is especially of significant in Iran, because it can lead to increased conflict of interest between major shareholders (who control firm) and minor ones which this conflict of interest is one of the most significant factors in determining dividend policy and financial leverage adjustment. Also another major factor i.e., growth opportunities being significant in the developing firms of Iran was included in present research and in total, this study investigated the effect of growth opportunities on the relationship between capital structure, dividend and ownership structure and firm value.
LITERATURE REVIEW
Growth opportunities and capital structure (leverage): Debt financing is one of the major factors in investment decision making at micro and macro levels (Erol, 2004; Sinai and Rezaeian, 2005; Reinhart, 2002). Given presence of growth opportunities, firm debt can play a mutual role in firm value which this role can be explained by 2 theoretical perspectives of underinvestment theory and overinvestment theory. Underinvestment theory perspective was first proposed by Meyers (1997) and stresses that high level of debts has a negative effect on firm value and lead managers towards profitable investment projects. Because of the priority of debtors (creditors) over shareholders in receiving cash flows, managers can determine projects with positive net present value in advance if project profits are towards creditors (McConnell and Servaes, 1995).
Thus given the presence of growth opportunities, it can be expected that there is a negative relationship between debts and firm value. In the case that firm has no growth opportunities, overinvestment theory being in a close relation with free cash flows is used. This theory stresses on the negative results of high level of cash flows under control of managers (Jensen, 1986, 1993). Thus debt financing leads to supporting firm value and inefficiency of managers decreases because of their limited access to free cash flows. In other words, according to this perspective, in the case of growth opportunities absence, it is expected that there is a positive relationship between debts and firm value (Lang et al., 1996; Singh and Faircloth, 2005; Torre et al., 2007).
In one research, Sinai and Rezaeian (2005) examined effects of four characteristics i.e., size, profitability, growth opportunities and tangible assets of the firm, as the most important intra-corporate parameters on firm capital structure. Data results showed that there was an inverse significant relationship between profitability, growth opportunities and firm tangible assets and financial leverage. In an examination of the relationship between firm characteristics and capital structure, Yahia-ZadehFar et al. (2010) found that there was a negative significant relationship between growth opportunities (market to book value) and capital structure. Results of Nourvash and Yazdani (2010) showed that there was a negative significant relationship between financial leverage and investment and that relationship is stronger in firms with more growth opportunities.
Growth opportunities and dividend: Those firms which pay dividends are usually those that are not able to invest their profit. Dividend is dependent upon firm investment policy. Firms with profitable investment
(growth) opportunities consider the profit as a source of financial supply.
Lang and Litzenberger (1989) and DeAngelo et al. (2000) believe that signaling theory and free cash flows theory are able to explain the effect of dividend policy on firm value in presence of growth opportunities. Explanation provided by signaling theory in this regard is based on information asymmetry between managers and investors. Results from Lopez-Iturriaga and Crisostomo (2010) showed that in presence of growth opportunities there is a negative relationship between dividend and firm value. They believe that given the informational asymmetry and growth (investment) opportunities, payout of dividend by firm may lead to decrease in firm value. Thus it is expected that in presence of growth opportunities, there is a negative relationship between dividend and firm value. Results from Lopez-Iturriaga and Crisostomo (2010) showed that in the case of lack of growth opportunities, there was a positive relationship between dividend and firm value. Gursoy and Aydogan (2002) believe that according to free cash flow theory, more intensive dividend policy leads to decrease in funds under control of managers. Thus firms with no growth opportunities would be able to prevent wastage of scarce resources of firm through profit distribution. Thus in a firm without growth opportunities it is expected that there is a positive relationship between dividend and firm value (Lopez-Iturriaga and Crisostomo, 2010).
Growth opportunities and ownership structure: The effect of ownership structure on firm value is derived from conflict of interests between shareholders. Cuervo (2002) believes that when major shareholders have an appropriate percentage of shares, they can impose their interests on firm and fulfill their personal desires. When rights of shareholders are not observed equally, ownership concentration is shifted towards a group of major shareholders. Previous research showed that major (controller) shareholders, in contrast to minor ones, exert more control on managers in order to improve firm performance. Jayesh (2004) in his study on the effect of ownership structure on firm value in India concluded that managers are of the most effect on firm performance and external shareholders and holding companies do not significantly influence firm value. Seifert et al. (2005) in one study on Germany, Britain, USA and Japan found that there is a significant relationship between presence of major shareholders in firm ownership composition and firm value. Firth et al. (2002) in their research on firms concluded that there was a significant relationship between corporate governance and firm value (Jayesh, 2004). Anlin and Kao (2005) examined the relationship between ownership structure, investment and firm value for a sample of 500 South Korean manufacturing firms. Based on results of Ordinary Least Squares (OLS)
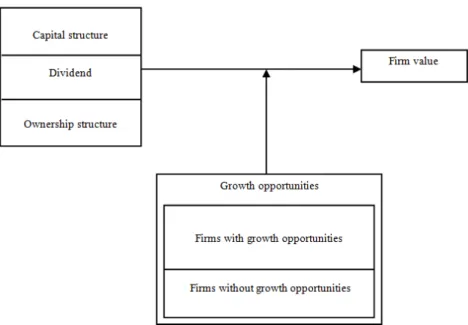
Fig. 1: The conceptual model for research
regression, ownership structure had an effect on investment and firm value (Anlin and Kao, 2005). Lopez-Iturriaga and Crisostomo (2010) believes that growth opportunities have effect on ability of major shareholders in expropriation of funds from minor shareholders. In a research conducted on the same issue, they concluded that there was a non-linear relationship between ownership structure and firm value and growth opportunities would increase this non-linear relationship. According to results of similar studies (Dyck and Zingales, 2004; Lopez-Iturriaga and Crisostomo, 2010; Morck et al., 2005), it is expected that there is a non-linear relationship between ownership structure and firm value (positive effect is due to control upon managers and negative one is due to expropriation of funds from minor shareholders) and also growth opportunities (private interests) have significant effects on this relationship.
Research hypothesis: In order to answer the research question i.e. whether growth opportunities have any effects on the relationship between capital structure, dividend and ownership structure, the following hypotheses were formulated:
H1 : Growth opportunities will moderate the relationship between capital structure and firm value.
H1-A : In firms with growth opportunities, there is a negative significant relationship between capital structure and firm value.
H1-B : In firms without growth opportunities, there is a positive significant relationship between capital structure and firm value.
H2 : Growth opportunities will moderate the relationship between dividend and firm value.
H2-A : In firms with growth opportunities, there is a negative significant relationship between dividend and firm value.
H2-B : In firms without growth opportunities, there is a positive significant relationship between dividend and firm value.
H3 : Growth opportunities will moderate the non-linear relationship between ownership structure and firm value.
Therefore, based on the hypothesis, Fig. 1 is a conceptual model to this study.
METHODOLOGY Questionnaire design:
Firm value and growth opportunities: Given the close relation between firm value and growth opportunities (Gordon and Myers, 1998; Adam and Goyal, 2008), identification and evaluation of growth opportunities is one of the major aspects of present study. Though various measures e.g., P/E and M/B may be used for clarifying growth opportunities, Adam and Goyal (2008) and Lopez-Iturriaga and Crisostomo (2010) believe that M/B is of the most informational content in relation to investment opportunities. Thus, in present study the main measure for growth opportunities is M/B, because this measure is both an efficient indicator and allows comparison of present study to other ones. M/B is the firm market to book value. Firm market value equals to firm share price in the end of the year times the number of issued shares and book value of firm refers to book value of equities. The higher the M/B, the higher the firm value would be
because of presence of growth opportunities and vice versa (Chen et al., 2005).
Capital structure, dividend and ownership structure: In present study, capital structure, dividend policy and ownership structure are independent variable being calculated as follows:
Capital structure (LEV): Equals to long-term debt book value divided in book value of all assets.
Dividend policy: Ratio of dividend to equity.
Ownership structure (C1): A proportion of firm shares which is owned by major shareholders. Major shareholders are legal or natural people who own at least 50% of firm shares. Also variable C2 which is squared C1, is used for studying the probable non-linear effect of ownership structure.
Research sample: Statistical Population consists of firms listed in Tehran Securities Exchange. In this research, systematic elimination sampling method was used. In other words, following requirements were considered for choosing statistical sample and all firms among statistical population which fulfilled those requirements were studied. Those requirements consist of:
• Financial information of firm is available for research period
• Its fiscal year end is 19 March
• Firm is listed at Tehran Securities Exchange up to end of 2007 and is not delisted during the studied period
• Firm is not among investing companies (financial intermediaries) and banks (because of different cash flow). By applying above criteria, 120 firms were selected for sample and their data for five year (2007-2011) were extracted from their financial statements using software Tadbir Pardaz. In order to estimate models, software Eviews was used
Procedure: Present research is an applied one with respect to its purpose. Purpose of this type of research is to develop applied science in a certain field. Also this research is a descriptive one from data gathering viewpoint and since it leads to more knowledge of existing conditions and aids in decision making process, is of co-relational one.
The common characteristics of growth opportunities analyses is dividing sample into 2 or more groups (based on growth opportunities value) (McConnell and Servaes, 1995). With respect to the close relation of firm value and growth opportunities and in order to adjust advantages of completely different characteristics of groups and losing least number of observations the sample were divided into 3 groups: first group consisted of 40% of firms having the
highest M/B rates (firms having the most growth opportunities); second group: 40% of firms having the least M/B rates (firms having the least growth opportunities); and third group consists of 20% in between the 2 previous ones and are eliminated from analysis. Indeed in present study analyses were performed on 3 groups of firms and in each stage one model was estimated. In first stage, model was estimated using data of the whole sample; in second stage, model was estimated using data of 44 firms having the most growth opportunities and in third stage, model was estimated using 44 firms having the least growth opportunities. In order to combine time-series and cross-sectional data, in present research combined data method was used. In this method, variables are measured both across statistical population (firm) and along the time (year). In this way we are faced with 2 dimensions: longitudinal dimension and cross-sectional dimension, also known as group-longitudinal data. In simplest case, it is assumed that the following regression holds: it U it X it Y =
α
+β
+ In which, α : Constant term Yit : Dependent variableXit : Matrix of independent variable
Uit : Error term which can be written in following form: it V i it U =µ + In which,
µi : Invisible individual effects Vit : Residual
Here 2 cases are faced with:
The first one is the case in which invisible individual effects (µi) are not present in the model and error term is only consisted of residual error term (Vit):
0 ... 2 1 : 0 = = = i= H µ µ µ
The second case is one that in which invisible individual effects are present; in other word:
H1 : At least one of µs is not zero
In order to test hypothesis H0 against H1 chow test is used. Assumptions of this test are as follows:
H0 : Pooled model H1 : Panel model
H0 Assumption is based on lack of invisible individual effects and H1 assumption is based on presence of invisible individual effects. If H0 assumption is accepted, it means that model has no invisible individual effects, thus, it can be estimated via
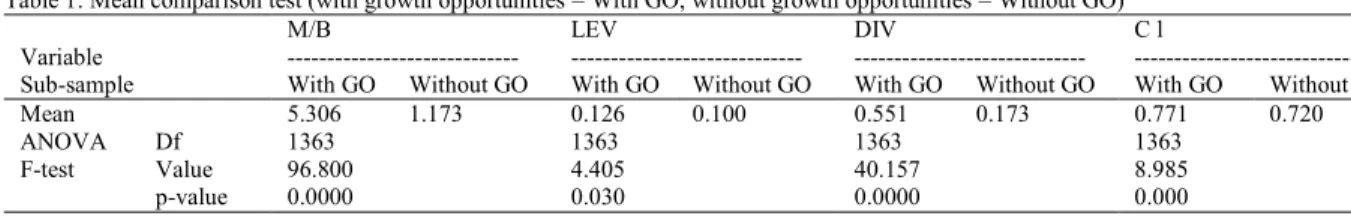
Table 1: Mean comparison test (with growth opportunities = With GO; without growth opportunities = Without GO) Variable M/B --- LEV ---DIV ---C l ---Sub-sample With GO Without GO With GO Without GO With GO Without GO With GO Without GO
Mean 5.306 1.173 0.126 0.100 0.551 0.173 0.771 0.720 ANOVA F-test Df 1363 1363 1363 1363 Value 96.800 4.405 40.157 8.985 p-value 0.0000 0.030 0.0000 0.000
integrated regression model. But if H1 assumption is accepted, it means that there are invisible individual effects in model.
Now it should be tested that whether these individual effects are correlated with model explanatory factors or not. In this respect, Haussmann test is used. This test is based on presence or absence of relationship between estimated regression error and model independent variables. If such a relationship is present, model has a fixed effect and if it is not, model has a random effect. Hypothesis H0 indicates lack of relationship between independent variables and estimation error and hypothesis H1 indicates presence of it.
H0 : Random effect H1 : Fixed effect
In the following, according to above-said, a multiple-regression model was defined as follows in order to clarify the relationship between variables:
Model 1: t i t i C t i C t i DIV t i LEV t i B M/ ), 0 1 , 2 , 3 1, 4 12, , ( =β +β +β +β +β +ε
LEVi,t : Financial leverage
DIVi,t : Dividend of firm I in period t
C1i,t : A proportion of firm shares owned by major shareholders
C12i,t : Squared C1 being used for examining the probable non-linear effect of ownership structure
Data analysis: Before providing the results of regression analysis, research variable means were compared between 2 sub-samples using equality test by classification which its results are shown in Table 1.
Table 1 show, there are significant differences in firm leverages, dividend policies and ownership concentration across firms based on availability of growth opportunities. In other words, the results suggest that the relationship between financial structure and ownership structure and firm value is influenced by growth opportunities. In the following, chow and Haussmann tests were used in order to estimate regression model for determining appropriate model.
Chow test: Chow test was used for determining fixed effects model against integration of all data and the results are shown in Table 2.
Table 2: Chow test Effect test Statistic
Degree of
freedom p-value Test result F 14.750 -4.540 0.000 Panel data
method X square 56.960 4 0.000
Table 3: Haussmann test Test
summary
X square statistic
Degree of
freedom p-value Test result Random
period
59.03 4 0.000 Fixed effect model The results of this test show that F-statistic value is 14.750 and p-value is 0.000. Thus H0 assumption is supported. In other words, there are individual and group effects and panel data method should be used for model estimation. In next stage, in order to determine exploitation of fixed effects model against random effects one, Haussmann test was used.
Haussmann test: Table 3 shows the results of Haussmann test. As is evident from table results, p-value is less than 1%. Thus H1 is supported. This means presence of relationship between estimated regression error and independent variables. Given the results of Chow test and Haussmann test, the most appropriate method for estimating parameters and testing of hypotheses is fixed effects model.
HYPOTHESIS TESTING AND RESULTS According to results of Chow test and Haussmann test, the most appropriate method for estimation of parameters and test of hypotheses is fixed effects model. In fixed effects model, regression slope is constant across all cross-sections. Though time effect is not significant, but there are significant differences between cross-sections and cross-section coefficients do not change with time. One of the methods for representing cross-sectional effects is to use dummy variables. Table 4 shows results of testing research hypotheses using fixed effects model.
As is evident from results, f-statistics values are significant for four models. Thus, with a confident coefficient of 99%, it can be said that presumption of all variable coefficients being simultaneously equal to zero is rejected and therefore all models are significant. Durbin-Watson statistic values at the whole sample level and for firms with and without growth opportunities are, respectively 1.95, 1.80 and 2.00. Thus it can be said that error level of 5%, presumption of correlation between interactive terms is rejected.
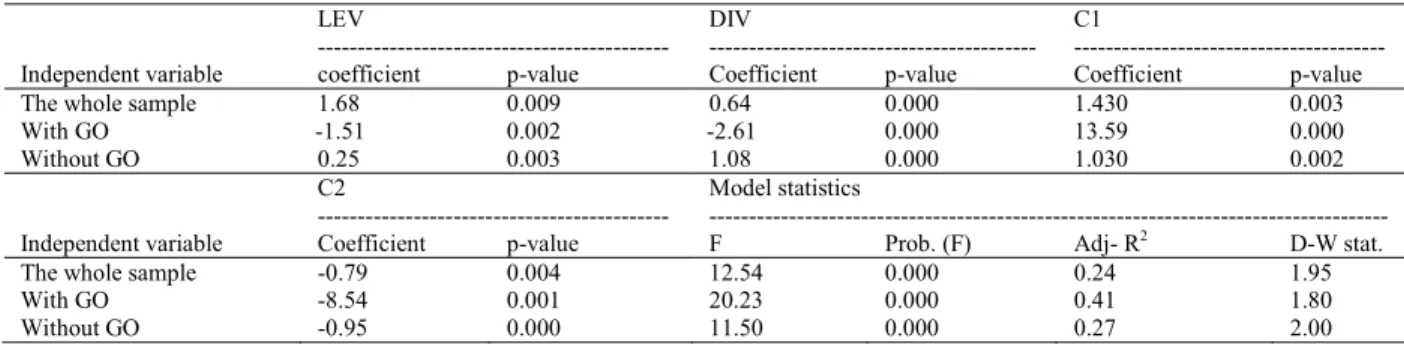
Table 4: Fixed effects model LEV --- DIV ---C1 ---Independent variable coefficient p-value Coefficient p-value Coefficient p-value
The whole sample 1.68 0.009 0.64 0.000 1.430 0.003
With GO -1.51 0.002 -2.61 0.000 13.59 0.000 Without GO 0.25 0.003 1.08 0.000 1.030 0.002 C2 ---Model statistics --- Independent variable Coefficient p-value F Prob. (F) Adj- R2 D-W stat.
The whole sample -0.79 0.004 12.54 0.000 0.24 1.95
With GO -8.54 0.001 20.23 0.000 0.41 1.80
Without GO -0.95 0.000 11.50 0.000 0.27 2.00
Adjusted R squares are respectively 0.24, 0.41 and 0.27 at the whole sample level and for firms with and without growth opportunities. Adjusted R square values show the extent of variation of dependent variable explained by the estimated model.
Hypothesis 1: Effect of growth opportunities on the relationship between capital structure and firm value: Results of Table 4 shows that capital structure exerts a major effect on firm value across the whole sample, because the coefficient of explanatory variable for financial leverage is 1.68 and its p-value is 0.009 which are statistically significant for the whole sample. In the next stage, the sample was divided in to 2 groups of with and without growth opportunities and related estimations were done. Coefficient of -1.51 and p-value of 0.002 for firms with growth opportunities, express the fact that in presence of growth opportunities there is a negative significant relationship between capital structure (leverage) and firm value. In addition, the results of estimation for firms without growth opportunities show that financial leverage is 0.25 and p-value is 0.003 which represents a significant and positive relationship between capital structure and firm value in absence of growth opportunities. Thus it can be said that there is a significant relationship between structure (leverage) and firm value subject to growth opportunities and H1 is not rejected.
Hypothesis 2: Effect of growth opportunities on the relationship between dividend policy and firm value: As is evident from Table 4, there is a significant positive relationship between dividend policy and firm value at the whole sample level (explanatory coefficient for dividend variable is 0.64 and p-value of it is 0.000), but after dividing the sample based on growth opportunities, the relationship between dividend policy and firm value for firms with growth opportunities is negative and significant (coefficient -2.61 and p-value 0.000) and this relationship is positive and significant for firms with growth opportunities (coefficient 1.08 and p-value 0.000). Thus it can be said that there is a significant relationship between dividend policy and firm value subject to presence or absence of growth opportunities. Thus H2 is supported.
Hypothesis 3: Effect of growth opportunities on the relationship between capital structure and firm value: Results from Table 4 show that there is a non-linear relationship (positive and negative) between ownership concentration and firm value (c1 = 1.03, c2 = -0.95) at the whole sample level which is significant at 1% level. Furthermore, after dividing firms based on growth opportunities, this non-linear and significant relationship remains unchanged for both firms with and without growth opportunities (c1 = 13.54, c2 = -8.54 and c1 = -0.95, c2 = -1.03, respectively). In other word, coefficient is positive for low level of ownership concentration and is negative for high level of ownership concentration. These findings do not reject H3 which says that growth opportunities influence the non-linear relationship between capital structure and firm value.
DISCUSSION AND CONCLUSION
In present research, effect of growth opportunities on secondary effect of leverage, dividend policy and ownership concentration was studied through analysis of financial data of firms listed in Tehran Securities Exchange using combined data method. The results from test of H1 showed that there was a significant relationship between capital structure (leverage) and firm value. In addition, this relationship is negative and significant in presence of growth opportunities and is positive and significant in absence of growth opportunities. Thus it can be said that there is a significant relationship between capital structure and firm value subject to presence or absence of growth opportunities. Also results of testing H2 show that there is a significant relationship between dividend policy and firm value, but tor firms with growth opportunities this relationship is negative and significant and for firms without growth opportunities this relationship is positive and significant. Thus it can be said that there is a significant relationship between dividend policy and firm value subject to presence or absence of growth opportunities. Finally results of H3 tests showed that there was a non-linear significant relationship between ownership concentration and firm value for both firms with and without growth opportunities. In general,
findings of present research are consistent with the financial strategies should be performed by firms in passing through their entry and growth stages of their business cycles.
RESEARCH LIMITATIONS
If time period of the research was longer, the results might be more generalisable, but if more years were considered for present study, the number of firms in statistical population and sample decreased and this led to reduced reliability of the study and the possibility of examining the studied relationships became limited.
The effect of inflation and other economical variables on financial statement values and the relationship between research variables were not taken in to account.
RECOMMENDATIONS
According to research results which suggest the effect of growth opportunities on the relationship between capital structure, dividend policy and ownership structure and firm value, financial statement users and analysts are recommended to consider growth opportunities in determining firm value and examining firm performance.
Researchers are suggested to replicate present study with information of firms outside the Exchange so that more general sable results are obtained.
Finally using other measures suggested for growth opportunities and capital structure is recommended for future and similar studies.
REFERENCES
Adam, T. and V.K. Goyal, 2008. The investment opportunity set and its proxy variables. J. Financ. Rese., 31(1): 41-63.
Anlin Ch. and L. Kao, 2005. The conflict between agency theory and corporate control on managerial ownership: The evidence from Taiwan IPO performance. Int. J. bus., 10(1): 39-60
Barclay, M.J. and C.W. Smith, 1999. The Capital Structure Puzzle: Another Look at the Evidence. J. Appl. Corp. Financ., 12(1): 8-20.
Chen, M.C., S.J. Cheng and Y. Hwang, 2005. An empirical investigation of the relationship between intellectual capital and firms’ market value and financial performance. J. Intell. Capital., 6(2): 159-76.
Cuervo, A., 2002. Corporate governance mechanisms: A plea for less code of good governance and more market control. J. Corp. Governance. 10(2): 84-93 DeAngelo, H., L. DeAngelo and D.J. Skinner, 2000.
Special dividends and the evolution of dividend signaling. J. Financ. Econ., 57(3): 309-354.
Dyck, A. and L. Zingales, 2004. Private benefits of control: An international comparison. J. Financ., 59(2): 537-600.
Erol, T., 2004. Strategic Debt with Diverse Maturity in Developing Countries. Emerg. Mark. Financ. Tr., 40(5): 5-24.
Fama, E.F. and K.R. French, 1998. Taxes, Financing Decisions and Firm Value. J. Financ., 53(3): 819-843.
Firth, M., P.M.Y. Fung and O.M. Rui, 2002. Simultaneous Relationship among Ownership, Corporate Governance and Financial performance. Working Paper. Retrieved from, http://ssrn.com/ abstract=337860, (Assessed on: 21 February 2008) Gordon, L.A. and M.D. Myers, 1998. Tobin’s q and
overinvestment. Appl. Econ. Lett., 5(1): 1-4. Gursoy, G. and K. Aydogan. 2002. Equity ownership
structure, risk taking and performance. Emerg. Mark. Financ. Tr., 38(6): 6-25.
Jayesh K., 2004. Does Ownership Structure influence firm value? Evidence from India. Indira Gandhi Institute of Development Research, India. pp: 48 Jensen, M.C., 1986. Agency costs of free cash flow,
corporate finance and takeovers. Am. Econ. Rev., 76(2): 323-329.
Jensen, M.C., 1993. The modern industrial revolution, exit and the failure of internal control systems. J. Financ., 48(3): 831-80.
Lang, L.H.P. and R.H. Litzenberger, 1989. Dividend Announcements: Cash flow signaling versus free cash flow hypothesis. J. Financ. Econ., 24(1): 181-91.
Lang, L.H.P., E. Ofek and R.M. Stulz, 1996. Leverage, investment and firm growth. J. Financ. Econo., 40(1): 3-29.
Lopez-Iturriaga, F. and V.L. Crisostomo, 2010. Do Leverage, Dividend Payout and Ownership Concentration Influence Firms’ Value Creation? An Analysis of Brazilian Firms. Emerg. Mark. Financ. Tr., 46(3): 80-94.
McConnell, J.J. and H. Servaes, 1995. Additional evidence on equity ownership and corporate value. J. Financ. Econo., 27(2): 595-612.
Miller, M.H. and F. Modigliani, 1961. Dividend policy, growth and the valuation of shares. J. Bus. 34(4): 411-433.
Modigliani, F and M.H. Miller, 1958. The cost of capital, corporation finance and the theory of investment. Am. Econo. Rev., 68(3): 261-97. Morck, R., D. Wolfenzon and B. Yeung, 2005.
Corporate Governance, Economic Entrenchment and Growth. J. Econ. Lit., 43(3): 655-720.
Myers, S.C., 1997. Determinants of corporate borrowing. J. Financ. Econ., 5(2): 147-75.
Nourvash, I and S. Yazdani, 2010. Study of effect of financial leverage on investment for firms listed in Tehran Securities Exchange. J. Account-Financ. Res., 2: 35-48.
Reinhart, C.M., 2002. Credit Ratings, Default and Financial Crises: Evidence from Emerging Markets. World Bank. Econ. Rev., 16(2): 151-70. Rizov, M., 2004. Credit constraints and profitability:
Evidence from a transition economy. Emerg. Mark. Financ. Tr., 40(4): 63-83.
Rodrigues, D.A., 2000. Os Investimentos no Brasil nos Anos 90: Cenkrios Setorial e Regional, (Capital Expenditures in Brazil in the 1990s: Industry and Regional Analysis), Revista doBNDES, 7(13): 107-136.
Seifert, B., H. Gonence and J. Wright, 2005. The international evidence on performance and equity ownership by insiders, blockholders and institute. Old dominion university. J. Multinatl. Financ. Manag., 15(2): 171-191
Sinai, H.A. and A. Rezaeian, 2005. Study of effect of firm characteristics on capital structure. J. Soc. Human. Sci., 19: 123-148.
Singh, M. and S. Faircloth, 2005. The Impact of Corporate Debt on Long Term Investment and Firm Performance. Appl. Econ., 37(8): 875-83. Torre, A., J.C. Gozzi and S.L. Schmukler, 2007. Capital
Market Development : Whither Latin America? Policy Research Working Paper Series, no. 4156, World Bank, Washington, D.C. pp: 1-27.
Yahia-ZadehFar, M., Sh. Shams and M. Mattan, 2010. Relationship between firm characteristics and its capital structure in firms listed in Tehran Securities Exchange. Account. Res., 8: 123-138.