1
Estimating the Heating Energy Consumption of the Residential Buildings in
2Hebron, Palestine
3Shireen Bader Al Qadi
4
salqadi@lincoln.ac.uk 5
Prof. Behzad Sodagar
6 7 Dr. Amira Elnokaly 8 9
School of Architecture and the Built Environment
10
University of Lincoln, Lincoln, UK
11 12
Highlights
13
Palestinian households spend 3.5%-21.6% of their monthly income on space heating
14
during winter
15
The average nominal heated area of the Palestinian houses is only 9.2% of the total
16
dwelling area during a winter day
17
A regression model for estimating the space heating is developed using 14 socioeconomic
18
and physical parameters that have impact on the energy consumed for heating
19
Abstract
20
The domestic sector uses the majority of the energy consumed in Palestine. The Palestinian Central
21
Bureau of statistics (PCBS) performs periodic statistics regarding the average energy consumption
22
of the households, but there is no up to date breakdown of the energy consumption in the residential
23
sector. The Palestinian energy sector main challenges are the high fuel prices, lack of sustainable
24
consumption and energy insecurity. Developing energy policies and studying the potential of
25
shifting towards more independent and sustainable energy sources needs a clear understanding of
26
the current energy consumption. The main contribution of this paper is a regression model to
27
estimate the energy consumed for heating in the housing sector in Hebron. The survey was used to
28
collect quantitative and qualitative data. The total number of households in Hebron who responded
29
to the survey was 322 households. The survey tackled physical characteristics of the dwellings,
30
socioeconomic features of the households in addition to the pattern of heating the spaces, quantity
31
and type of fuel used for heating. On average the households heated only 9.2% of the total area of
32
their houses during the winter days. Based on the data collected from the survey, a regression
33
model is developed to estimate energy consumption with an R2 adjusted 0.606 indicating 60.6%
accuracy of the predicted energy consumed for heating. The regression model depends on 14
1
parameters which include the type of settlement, physical characteristics of the dwelling that are
2
housing typology, level of thermal insulation of the walls, the main building materials and the
3
housing age. In addition, to socioeconomic parameters which are the family monthly income and
4
the occupancy period. Moreover, the type of the heating system used, the number of heated months
5
and the nominal heated area were influential parameters in this model. The model can be used as a
6
rule of thumb to estimate the energy consumed for heating in the Hebron housing sector by
7
professionals, policy makers and building industry.
8
Keywords 9
Heating energy, housing typology, energy consumption; type of settlement, nominal heated area,
10
regression model
11
1. Introduction
12
Palestinians procure most of their electricity and energy resources (excluding fuel wood) from 13
Israel (Abu-Madi & Abu Rayyan, 2013; Ibrik, 2009). The Palestinians have to pay the blue tax on 14
the fuel amounting to 17% making energy less affordable to most Palestinians according to Paris 15
Protocol (PASSIA, 2001). The annual energy consumption per inhabitant in Palestine is the lowest 16
in the region (IEA, n.d). While energy consumption in kWh/capita in Israel was 3,955, in Jordan 17
1,426 in 2013, the annual energy consumption in Palestine was 790 kWh/capita (IEA, 2014). The 18
energy resources in Palestine is less affordable than anywhere else in the Middle East countries 19
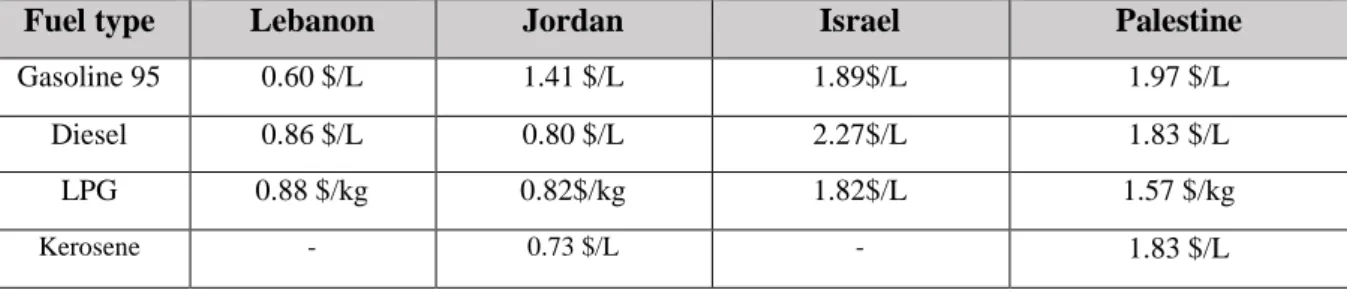
(Juaidi et al., 2016). Table 1 shows that the prices of different types of fuels in Palestine is almost 20
double the price in the neighboring countries of Jordan and Lebanon. Fuel prices in Palestine is 21
almost the same price as in Israel for the consumer despite the income gap between the citizens of 22
the two regions. In 2011 the per capita income in the Israel is 150% higher than the per capita
23
income in the West Bank (Eckstein, 2011). Table 2 compares the residential electricity block tariffs 24
in Lebanon, Jordan and Palestine. In these countries when tariffs are unable to cover the fuel source 25
bill and operating costs, government subsidies cover the gap between expenditures and revenues. 26
The electricity prices for the consumer in Lebanon is the lowest compared to Jordan and Palestine. 27
While the prices for the blocks with the lower electricity consumption blocks in Jordan is lower 28
than in Palestine, the prices in the higher consumption blocks is slightly higher in Jordan. The 29
Israeli electricity tariff follows the voltage capacity with a peak/off peak and a seasonal tariff, hence, 30
it cannot be compared with the previous countries (The Israel Electric Corporation LTD., 2012). 31
32
Table 1: Fuel Prices for the Consumer (Including VAT) in Lebanon, Jordan, Israel and Palestine on The 1st February 2018 33
Fuel type Lebanon Jordan Israel Palestine
Gasoline 95 0.60 $/L 1.41 $/L 1.89$/L 1.97 $/L
Diesel 0.86 $/L 0.80 $/L 2.27$/L 1.83 $/L
LPG 0.88 $/kg 0.82$/kg 1.82$/L 1.57 $/kg
Kerosene - 0.73 $/L - 1.83 $/L
Sources: (The Lebanese Ministry of Energy and Water,2018), (Jordan Ministry of Energy and Mineral Resources,2018), (Israeli
1
Ministry of National Infrastructures, 2018) ,(The Palestinian National Authority Ministry of Finance,2018). Prices for the consumer
2
including VAT and currency conversion from JD and ILS to USD is based on 5th February 2018 prices
3 4
Table 2: A Comparison Between the Electricity Prices for the consumer Between Lebanon, Jordan and Palestine 5
6
Data from (Electricité du Liban, 2012), (National Electric Power Company, 2017) and (Palestinian Electricity Regulatory Council,
7
2017) , Prices for the consumer including VAT and Currency conversion from JD and ILS to USD is based on 5th February 2018
8
prices
9
Due to the costly and insecure imported energy, in addition to the exigent and increasing demand,
10
there is a potential for using different types of renewable energy sources (Al Qadi & Alrjoub, 2011;
11
Elnokaly & Elseragy, 2007; Yaseen, 2009). The Palestinian Electricity Regulatory Department’s
12
recent statistics shows that there had been an increase in the energy production from renewable
13
sources (mainly the solar photovoltaic cells) from 5,792kWh in 2015 to 6,253 kWh in 2016
14
(Palestinian Electricity Regulatory Council, 2017).
15
Rational Investment in renewable energy needs to be preceded by energy optimization.In Palestine,
16
most of the energy consumed by the residential sector and should be among the targeted sectors in
17
any energy policy that tends to shift to more sustainable energy technologies to increase energy
18
security (Nejat et al., 2015; Ismail, Moghavvemi and Mahlia, 2013). Understanding the trend of the
19
energy consumption is a first step towards optimizing the energy consumed for buildings. The
20
Palestinian Central Bureau of Statistics (PCBS) energy surveys identify the amount of energy used
21
by the household per month for certain months. Table 3 shows the average amount of electricity and
22
fuel used by the Palestinian in the West Bank households for the different purposes during January
23
2015 based on the results of the last energy survey (PCBS, 2015). Obviously, no breakdown of the
24
energy for specific uses like heating, cooling and appliances is defined. The latest breakdown of
25
energy consumption in the housing sector was illustrated by Ouda (2010), who developed a detailed
26
analysis of the annual energy consumption by the Palestinian households in the West Bank as
27
demonstrated in Figure 1. The breakdown highlights that solar energy contribute significantly to the
Domestic Hot Water (DHW) consumption (Ouda, 2010). It also shows that space heating comes in
1
the first category for using the hydrocarbon fuel.
2
Since 2010, many changes took place on the socio-economic situation. For example, the
3
unemployment rate increased from 23.7% in 2010 to 26.9% in 2017 (PCBS, 2015). In addition, the
4
family size in Palestine dropped from 5.8 in 2010 to 5.2 in 2015 (PCBS, 2011; PCBS, 2016a). Such
5
socioeconomic changes have an impact on the energy consumed by the households (Al-Sumaiti,
6
Salama and El-Moursi, 2017; Cai and Jiang, 2008; Swan and Ugursal, 2009).
7
Table 3: The Average Amount of Electricity and Fuel Used by the Palestinian Households in January 2015 8
Average household consumption of energy
Electricity (KWh)
LPG (Kg) Kerosene (Litre)
Gasoline (Liter) Diesel (Litre)
West Bank 328 26 28 115 160
9
10
Figure 1: A Breakdown of the Annual Energy Used by the Palestinian Households in the West Bank (Based on Data from 11
Ouda, 2010) 12
Models of the energy consumption in the housing stock is a key tool to implement the region’s
13
energy policies in an efficient and rational manner (Elnokaly & Martin, 2014; Kavgic et al., 2010).
14
However, estimating the energy consumption in developing countries where a combined energy
15
sources used with primitive means like hand collected wood can be challenging (Wang and Jiang,
16
2017). Generally, no electricity sub-meters are installed in the Palestinian houses, and in some cases
17
one electricity meter is installed for a number of houses to save the cost of connecting to electricity
18
network formally. In addition, no gas network is available in the city. Furthermore, having more
19
than one heating system is common in the Palestinian household to overcome electricity blackouts
20
or running out of certain fuels. This can be due to poor infrastructure or in certain political
21
situations like when fuel is not accessible due to Israeli closures on certain areas. In this context, the
conventional ways of assessing energy consumption such as reading the electricity meters and gas
1
bills are not suitable. (Aly et al.; 2017, Park et al., 2013; Sodagar & Starkey, 2016; Upadhyay et al.,
2
2017). An alternative approach is developed for assessing the energy consumed for the different
3
uses in the Palestinian houses. In this paper, the heating energy consumption is estimated based on a
4
heating system audit and calculating the amount of fuel used as will be explained in section 3.
5
The goal of this paper is to create a model for predicting the heating energy consumed in Hebron
6
residential buildings and to shed light on the main factors that influence the consumption.
7
Understanding the consumption of each of the uses like cooking and lighting is essential, however 8
the main scope of this paper is the space heating energy due to the considerable amount of energy 9
used for space heating in the Palestinian housing sector and because of its direct impact on the 10
thermal comfort, health and wellbeing of the occupants. The research uses a mixed method 11
approach (Creswell, 2003), combining both qualitative and quantitative data to develop a data 12
driven model. The data was gathered through an empirical investigation using a multimode survey 13
from 322 households. The survey defined the socio-economic characteristics of the household, the 14
house physical characteristics, the pattern of space heating and an audit of the heating system’s 15
energy. These factors were examined statistically in SPSS (Guerra Santin, Itard and Visscher, 2009) 16
using Ridge Regression Analysis (Tiwari, 2000) and 14 factors were found to be significant in 17
determining the energy consumed for heating. The developed model can explain 60.6% of the 18
energy used for heating in the Palestinian dwellings in Hebron. It can be used as a simplified tool 19
for the professionals and policy makers to estimate the heating energy consumed based on physical 20
parameters of the houses and socio-economic characteristics of the households. The significance of 21
this paper stems from the methodology that propose an alternative to the energy audit and 22
simulation methods. The proposed method can be used in contexts where a combination of energy 23
resources are used with no proper metering system and with the absence of accurate data that is 24
needed for simulation. Professionals, policy makers and the building industry can benefit from this 25
method and results to estimate the heating energy consumption in Hebron and similar contexts. The 26
paper is structured as follows, starting with a literature review defining the key performance 27
indicators that impact the heating energy followed by research method, results, discussion and 28
finally the conclusion. 29
2 Key performance indicators to estimate the heating energy in the residential buildings
30
In order to develop a model to predict the yearly heat consumption we need to take into account all
31
the parameters that highly influence it (Catalina, Iordache and Caracaleanu, 2013). These indicators
32
can be classified under three main categories which are environmental factors, building and system
33
related factors, occupants’ characteristics and behavior (Ali, Elnokaly & Mills, 2017; Wei, Jones
and de Wilde, 2014). Other parameters like energy policy and fuel prices are considered to have an
1
equal influence in this context so were not included (Jones and de Wilde, 2014).
2
The climate in Hebron is generally a Mediterranean climate. However, the local climate is affected
3
by the type of settlement. The fact that urban areas usually experience higher temperatures than the
4
rural surroundings strictly connected with the urban heat island (UHI) phenomenon (Elnokaly &
5
Elseragy, 2007a; Kolokotroni and Giridharan, 2008; Salvati, Coch Roura and Cecere, 2017;
6
Schwarzet al., 2012). Hebron Governorate contains the city of Hebron in addition to 17
7
municipalities and 32 village councils and two refugee camps that were established after 1948
8
(ARIJ, 2009; PCBS, 2010). The refugee camps were first established using tents by the United
9
Nations for Relief and Works Agency (UNRWA) as temporary residences which were replaced by
10
durable materials later on. The urban form and the density varies in these types of settlements. The
11
literature mentions that the type of settlement can affect other parameters like the fuel choice.
12
Households in the urban areas tend to use more clean fuels than rural households (Narasimha Rao
13
and Reddy, 2007). In addition the type of settlement plays an important role on the family size and
14
structure. The type of settlement is an important parameter in this study.
15
The second category includes the building and system related factor. Housing typology, building
16
orientation, dwelling size, the number of heated rooms, building envelop U-value, the window to
17
wall ratio, and building shape factor, height of the building, age of the building, , level of insulation
18
were emphasized as a key factor of heating energy demand (Aksoezen et al., 2015; Andersson et al.,
19
1985; Catalina, Iordache and Caracaleanu, 2013; Catalina, Virgone and Blanco, 2008; Elnokaly &
20
Elseragy, 2007b; Elseragy & Elnokaly, 2007; Mutani, Gamba and Maio, 2016; Sardianou, 2008;
21
Viggers et al., 2017; Wei, Jones and de Wilde, 2014). The contemporary housing in Hebron was
22
classified in this paper based on a socio-physical criterion which is an extension of the traditional
23
housing classification. The main housing typologies in this paper are the single housing, an
24
apartment in a residential building, an apartment in a multistorey building for an extended family –
25
which is very common in the city of Hebron – and finally an apartment in mixed use housing. In
26
addition, the heating systems features like the type and efficiency of heating system, type of
27
temperature control, and type of heating fuel play a role in the amount of the generated heat and
28
affects the total heating consumption (Wei, Jones and de, 2014). In the south of the West Bank
29
(Hebron and Bethlehem) the main energy sources for heating are wood, LPG and electricity
30
respectively (PCBS, 2015).
31
The third category which influences the energy used for heating is the households’ characteristics
32
like the occupants age, gender, social grade, household size and thermal sensation have an impact
33
on the consumption (Ali, Elnokaly & Mills, 2017; Bedir et al., 2013; Dong et al., 2015; Jones et al.,
34
2015; Matsumoto, 2016; Santamouris, 2016; Wei, Jones and de, 2014). Furthermore, the economic
situation is a main determinant of the heating consumption (Tiwari, 2000). Figure 2 illustrates the
1
main factors that contribute to the energy usage in the housing sector.
2
This research uses an empirical investigation through a survey method for data collection as will be
3
explained in section 3. Hence, the parameters that is included are the ones that are simple enough
4
for the respondents to answer. Technical parameters like U-value or efficiency of the heating
5
system were not included. In addition, parameters that needs spatial survey of the dwellings like the
6
openings to total area is not included too. In this paper 17 socioeconomic and physical parameters
7
are studied to determine their impact on the heating energy consumption as shown in table 4.
8
9
Figure 2: The Main Factors That Impact the Energy Consumption in the Residential Sector (Alqadi, Sodagar,Elnokaly, 2017) 10
11
Table 4: Parameters Used in this Research for Modelling the Heating Energy Consumption 12
No. Parameter No. Parameter No. Parameter
1 Type of settlement 7 Number of rooms 13 Using fire place 2 Duration of occupancy 8 Main building materials 14 Using central heating 3 Household size 9 Total monthly income 15 Using LPG heaters 4 Occupancy rate 10 Heated area 16 Using Kerosene heaters 5 Building typology 11 Level of thermal insulation of walls 17 Using electric heaters 6 Building age 12 Number of months in which heating systems are used
13
3 Research Method
14
There are several ways to quantify the energy consumed in buildings. The bottom-up approach has
15
the potential to model buildings in a detailed manner and to taking into account the interactions of
16
the buildings, occupants and active systems (Lannon et al., 2016). It encompasses the energy
physics approach, the statistical models and the hybrid approach (Foucquier et al., 2013; Kumar,
1
Aggarwal and Sharma, 2013; Mocanu et al., 2016).
2
A growing interest is noticed in the statistical approach for calculating the energy consumption in
3
buildings (Kneifel and Webb, 2016; Lü et al., 2015). The statistical method incorporates the
4
macroeconomic and socioeconomic factors, easy to develop and use and is able to define a typical
5
end-use energy consumption with no detailed data (Kavgic et al.,2010). However, the statistical
6
method has some drawbacks as it relies on historical data to predict future consumption. In addition
7
to the fact that it needs a large sample size making it time consuming (Baird and Bieber, 2016;
8
Bozdogan, 2004). Moreover, there is the multicollinearity issue which is a condition in where the
9
predictor variables are correlated with each other to some degree affecting the outcome (Baird and
10
Bieber, 2016). These issues should be tackled carefully when developing the statistical models.
11
Due to the lack of detailed data on the actual thermal characteristics of the Palestinian residential
12
buildings, the statistical approach was the most suitable method identified to be used in this research.
13
It is beneficial in cases where it is difficult to collect detailed physical features like building
14
geometry or thermal characteristics (Foucquier et al., 2013). Moreover, in the statistical models the
15
user behavior needs not to be modelled which is a great advantage (Brøgger and Wittchen, 2017). In
16
this research, the regression analysis is used (Montgomry, Peck and Vining, 2012). The next section
17
of the paper discusses the regression models and how they are developed.
18
3.1Regression models 19
Among the different types of the statistical methods, the methods of regression analysis are the most 20
widely used statistical tools for discerning the relationships between variables (Draper & Smith, 21
2014). The regression methods are easy to implement, less computational power than other 22
statistical approaches and gives satisfactory prediction ability (Fumo and Rafe Biswas, 2015). In 23
Hebron case, due to unavailability of detailed data on the thermal characteristics of buildings and 24
the absence of sub-meters in the houses, the regression modelling is adopted as a mean to predict 25
the energy consumption. 26
The main idea behind the regression methods is finding a mathematical relationship (equation) 27
between the dependent variable and explanatory variables (predictors) (Fumo & Rafe Biswas, 28
2015). It can be applied using certain software like the Statistical Package for the Social Sciences 29
(SPSS) and STASTICA (IBM, 2017) as well as Tibco Software (Tibco Software Inc., 2017). 30
In the multiple linear regression, all the available predictors are used together with the appropriate 31
slope to quantify the effect of each predictor (James et al., 2013). The coefficient of determination 32
R2assessesthe quality of fit of the linear model. R square (R2) is an important indicator when
evaluating the regression model. It is the coefficient of determination that indicates the fitness of the
1
model and can be understood as the amount of variation of the dependent variable explained by the
2
regression equation (Anderson, 2003). The value of R2 varies between 0 and 1 and the preferred
3
model would be with an R2 value close to 1 (Yan & Sue, 2009). If for example, the value 4
of R2=0.85 this points out that 85% of the total variability of the dependent variable is defined by 5
the predictor variables in the model (Fumo & Rafe Biswas, 2015). In this research Ridge regression 6
model was used. In regression analysis, Ridge estimators are often used to alleviate the problem of 7
multicollinearity which happens when the factors have a correlation with each other that can affect 8
the final results of the model (Wan, 2002). 9
Linear regression has been used in several studies to define the factors that influence and predict the 10
energy consumption in the buildings (Amiri et al., 2015; Braun, 2014; Pulido-Arcas et al., 2016). 11
For example, a multivariate regression analysis was used to explore the overall effect of socio-12
economic and behavioral variables on residential energy consumption of conditioned space in China, 13
based on data obtained from surveys (Chen, Wang & Steemers, 2013). Similarly, it has been used to 14
understand the effects of environment indicators and household features on residential energy 15
consumption (Tso & Guan, 2014). 16
Creating a regression model needs usually a large set of data (Bozdogan, 2004). Concomitantly, the 17
mixed method was used in this research in order to combine the strengths and perspectives of both 18
the qualitative and quantitative methods. It is also believed that this approach emphasizes the real 19
human experience by considering both the qualitative and quantitative aspects in the research 20
(Johnson & Onquegbuzie, 2004). The survey method was used in this paper to collect the data. 21
3.2 Designing the questionnaire
22
For collecting a large set of data to estimate the energy used for heating and cooling in buildings 23
various studies have adopted the survey method (Jridi & Nouri, 2015; Hu et al., 2017; Santamouris 24
et al., 2013; Zheng et al., 2014). The survey main strategy is to collect the same information about 25
all the cases in a sample (Aldridge and Levine, 2001). The flexibility in the survey method allows 26
many variables to be included producing a large amount of data, hence, allowing hypothesized 27
relationships to be tested (Baker, 1999). Meanwhile, it is possible that this data lacks the depth on 28
the topic (Kelley, 2003). 29
The questions of the survey were a combination of multiple choices using Likert scale in addition to 30
using matrix questions (Fowler, 2009). The questionnaire was divided into four main parts. The first
31
part tackled the household characteristics, such as the number of occupants, income and age range.
32
The second part focused on the housing properties, such as age, building materials, location,
typology and area. These parts included the main physical and socio-economic factors that
1
potentially have an impact on the energy consumption for heating and cooling. Figure 2 is an
2
example of the questions that focus on the socio-economic situation of the households. The third
3
section concentrated on the heating and cooling patterns in the spaces, type of fuel and system used
4
and frequency of heating (see Figure 3). The fourth part assesses the thermal comfort however it is
5
not discussed in this paper.
6
7
Figure 3: A Sample of the Survey Questions on the Socio-Economic Characteristics of the Households (Authors’
8
Own) - (1000 ILS=281.2$ in 01/08/2017) 9
10
The questions were designed to fit the purpose within the specific Palestinian context. The
11
respondents could select more than one choice of the heating systems if applicable. The households
12
were asked about the type of electric heating system used and duration of using. Fuel delivery takes
13
place in fundamentally primitive ways. For example, people who rely on liquefied gas petroleum
14
(LPG) for heating generally use bottles of 12kg capacity and others use kerosene tanks. The
15
households were asked about the number of LPG bottles consumed per month. Estimating the
16
amount of kerosene used in litres can be hard for the households, hence they were asked about the
17
frequency of filling the tanks during the heating season in order to calculate the fuel consumption
18
taking into account average capacity of the kerosene tanks of the common used heating systems.
19
The respondents defined also the total amount of wood they used for heating in tonnes.
20
3.3Sampling method
21
A multi-mode survey depends on more than one way of collecting data to increase the response rate
22
and decrease the cost (Biffignandi & Bethlehem, 2012). In this research, the web based surveys and
23
questionnaires were used. Web based survey have several advantages including the decrease in cost
24
and ease of analysis, but also have drawbacks including the potential for selection bias (McPeake,
25
Bateson and O’Neill, 2014). In this research, the electronic survey tool Smartsurvey was used in
26
addition to the hard copy self-complete questionnaires to increase the credibility of the survey 27
results in December 2016. Smartsurvey was found to be a suitable tool since it enables the survey to 1
be created in different languages – Arabic in this case – and to have clear, undisturbed Excel 2
spreadsheet results afterwards. Snowball sampling was used to address the energy consumption in 3
the housing sector (Sesan, 2012; Wall & Crosbie, 2009). 4
The sample size of the Energy Survey that was held in 2015 by the PCBS were 87,656 households 5
among them 740 households were from Hebron district (PCBS, 2015a). No formal statistics are
6
available regarding the current total number of the households in Hebron as the consensus results of 7
2017 was not published yet. Some statisticians dispute the logic that sample size is necessarily 8
dependent on population size (Alreck and Settle, 2004). Defining sample size can be derived 9
depending on the researcher acceptable error (Roscoe 1975). A level of error of 10% is considered 10
acceptable (Roscoe 1975). Aiming for a margin of error (based on 95% confidence interval) at the 11
most of +/- 6 percentage points for each possible response a sample size of 266 would be needed 12
(Creative Research systems, 2012; Assheton,2017).
13
The total number of responding households from both methods in Hebron was 322, which exceeds 14
the required sample. The number of respondents from Hebron using the internet survey method 15
were 259. The main criticism of the internet-based sampling is that they cannot be generalized as 16
they are unrepresentative (Bethlehem and Biffignandi, 2012). However, according to the formal 17
statistics 48.3%of the Palestinian households has a connection to the internet (PCBS, 2014). On the 18
other hand, there are other means of connecting to the internet like a connection from a workplace, 19
or other informal means. In order to increase the credibility of the survey results and to eliminate 20
the internet sampling, 100 questionnaires (hard copies) of the survey were distributed during a visit 21
to Hebron in December 2016. These were self-complete questionnaires, with the aim to address the 22
people who might have no internet access or are unfamiliar with internet use to participate in the 23
survey. The number of responses using this method was 63 (returned percentage of 63%). 24
25
3.4 Heating energy calculations
26
The respondents first had to choose the type of energy used for heating. The main types of fuel used
27
for heating in Palestine are wood, LPG, kerosene and diesel, in addition to electricity (PCBS, 2015a).
28
Each of these fuels’ consumption was calculated using a certain formula depending on the
29
frequency of consumption of the heating system. Each heating system of wood, LPG, kerosene and
30
diesel was assigned a coefficient in order to calculate the energy in kWh as demonstrated in Table 5.
31 32 33
Table 5: The Coefficients for the Common Fuels Used For Heating in Palestinebased on data from (Growsave,
1
2009)
2
Energy Type Reporting Units
Conversion Factor
Wood Logs Tonne 2,778
LPG Kilogram 13.7
Diesel m3 10800
Kerosene Litre 10.3
3
For wood, households usually buy or collect a certain amount of wood in tonnes. For the LPG
4
heating systems bottles of 12kg are used. The capacity of the kerosene heating system tanks is six
5
litres on average and filled regularly, while diesel is stored in tanks and filled periodically.
6
Regarding the diesel and the kerosene tanks it has been assumed that the tanks are refilled when
7
10% of the tank is left. Hence the following Equation 1,2,3 and 4 present the formulas that were
8
developed to estimate the annual heating consumption (AHC) from wood AHC (wood), LPG AHC
9
(LPG), Diesel AHC (Diesel) and Kerosene AHC (kerosene) respectively:
10
AHC (wood) = T*2778 (kWh)/year) (Eq. 1) 11
T: number of tonnes of wood used annually for heating
12
2778: coefficient to transfer the heat from tonnes of wood to kWh (Table 4)
13
AHC (LPG) = B*N*12*13.7 (kWh)/year) (Eq. 2) 14
B: Number of bottles consumed per month during heating seasons 15
N: Number of Heating months 16
12: Amount of LPG in a bottle (kg) 17
13.7: coefficient to transfer the heat from kg of LPG to kWh (Table 4)
18
AHC (Diesel) = V*T*10800*0.9 (kWh)/year) (Eq. 3) 19
V: volume of the Diesel tank in m3 20
T: Number of times of filling the tank per heating season 21
10800: Coefficient to transfer the heat from m3of Diesel to kWh (Table 4)
22
0.9: assuming that the tank will be refilled when it reaches 10% of its capacity
23 24 25
AHC (kerosene) = 6 *N*D*10.3*0.9 (kWh)/year) (Eq. 4)
1
6: The average tank size (L) 2
N: Number of Heating weeks 3
D: Number of times of filling the tank per week 4
10.3: coefficient to transfer the heat from L of Kerosene to kWh (Table 4)
5
0.9: assuming that the tank will be refilled when it reaches 10% of its capacity
6
Equation 1. Formulas were developed to estimate the annual amount of heating energy consumed from
7
wood AHC (wood), LPG AHC (LPG), Diesel AHC (Diesel) and Kerosene AHC (kerosene)
8
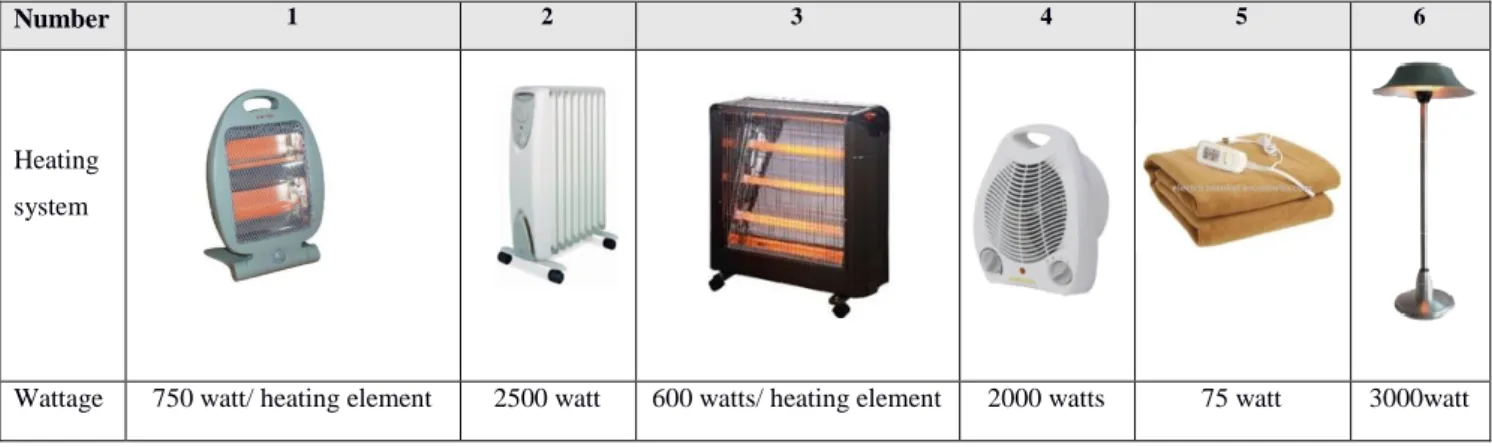
To assess the energy used in the heating using electrical systems, the most commonly used heating
9
electricity systems in the Palestinian market were explored and the average amount of wattage of
10
each system was taken from the producer catalogues as illustrated in Table 6.
11
Table 6: The Common Heating Systems Used in the Palestinian Market (Universal, 2015; Europa, 2015)
12
Number 1 2 3 4 5 6
Heating system
Wattage 750 watt/ heating element 2500 watt 600 watts/ heating element 2000 watts 75 watt 3000watt
13
The amount of electric energy consumed (AEC) Electricity for heating per year was calculated using 14
the following formula:
15
AEC (Electricity)=W*H*30/1000 (kWh)/year) (Eq. 5)
16
W: Wattage (gained from the producer catalogue for each system) 17
H: Hours in which the system used per day 18
N: Number of Heating or cooling months 19
(The number of heating elements used should be multiplied by the previous formula for systems 2 and 4) 20
Equation 2. Formula to calculate the electric energy consume d for heating per year
21
During site visits of 30 houses in Hebron the temperature inside the houses in winter was measured.
22
The average temperature was found to be 12.6 C° in the sitting rooms in the 30 houses. It was also
23
noticed that households who used heating system 2 and 4 in Table 6 were operated on the maximum
wattage to get the maximum amount of heat. Hence, the equation of the electric heaters assumes
1
that systems 2 and 4 in Table 6 operate on the maximum wattage.
2
In addition to the previous systems, people also use air conditioning system, not only for cooling
3
during summer but also for heating during winter. In this case, the respondents had to choose the
4
wattage and the number of the air conditioning systems, in addition to the duration of use during the
5
heating seasons. The wattages for heating for different air conditioning systems obtained from their
6
catalogues are given in Table 7.
7
Table 7: The Average Heating Wattage of the Air Conditioners in Common Heating Systems Used in the Palestinian Market 8
Product Model Wattage for heating Source
Media Air conditioning system Platinum-18GIQ 0.96 (Media, 2015) Media Air conditioning system Platinum-23GFI 1.56 (Media, 2015) Media Air conditioning system Platinum-32GIQ 1.87 (Media, 2015)
9
The annual energy consumption by the air conditioner systems for heating was calculated using the
10
following formula:
11
AEC (electricity) =W*H*N/1000 (kWh)/year) (Eq. 6) 12
W: Wattage (optained from the producer catalogue for each system shown in Table 6) 13
H: Hours in which the system used per day 14
N: Number of heating days during the heating season 15
Equation 3. Formula to calculate the annual energy
16
consumed by the air conditioner systems for heating
17
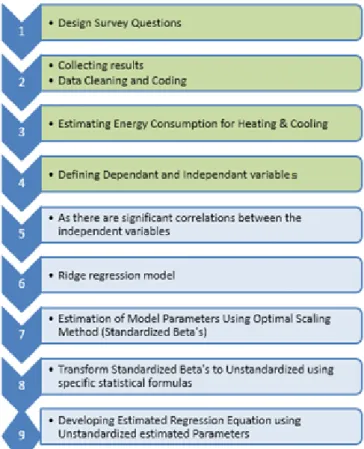
The greatest limitation of this model is not being 18
able to obtain detailed technical data from the 19
correspondents as the survey questions should be 20
simple to increase the response rate. The second 21
limitation is the multicollinearity which was 22
overcame using ridge regression model as explained 23
in Figure 4 that summarizes the method used in this 24
paper. 25
26 27
4. Results
1
4.1.Type of settlement
2
The percentage of respondents living in the different types of settlements compared to the
3
Palestinian Central Bureau of Statistics data of 2016 is illustrated in Table 8. The variation in the
4
results could be due to the difference between the formal and the informal classification of the
5
settlements. While the government recently considered 17 settlements in Hebron Governorate as
6
cities, the residents still tend to consider the city of Hebron as the main city and the rest of the
7
settlements as towns or villages, which was reflected in the variation in the city and villages
8
percentages between the formal statistics and the survey results in this research.
9
Table 8: The Percentage of the Respondents Who Live in the Different Types of Settlements Compared to the Palestinian 10
Central Bureau of Statics of Population (PCBS,2016a)
11
Type of settlement City Rural areas Refugee camps
Survey,2017 64.3% 33.9% 1.9%
PCBS,2016 85.3% 12.0% 2.6%
12
4.2.Households’ socioeconomic characteristics and heating costs
13
The average households’ size in the survey is 5.8. The average monthly income of the households in 14
this survey is 4473.6 ILS($1263.5). Around 37.6% of the households are under the poverty line, 15
which is 2293 ILS ($665.6) per month as a reference for households consisted of two adults and 16
three children according to the PCBS in 2011 (PCBS, 2011). Figure 5 demonstrates the percentage
17
of the total monthly income that the households pay. The results show that there is a reverse
18
correlation between the households’ income and the percentage spent on heating. While the
19
households with income 1400 ILS (($400.3) pay one fifth of their monthly income, households
20
with monthly income that exceeds 12000ILS ($3,374.4) pay less than 5% of their income for
21
heating in both the city and the villages.
22 23 24 25 26 27 28 29
Figure 5: The Percentage of the Heating Expenses from the Households’ Monthly Income
30
(1 ILS= 0.29$ according to 28/2/2018 prices)
4.3.The housing characteristics: 1
The survey reveals that the dominant housing typology differs according to the type of settlement.
2
Table 9 shows the percentages of the housing typologies in the city, the villages and the refugee
3
camps in Hebron and compares them to the PCBS (PCBS, 2015 a). The single housing is the
4
dominant typology followed by the apartments in an extended family residential building in the city
5
and the villages. The latter is a common typology in Hebron, not only as a result of the land scarcity
6
and economic limitations which force the sons to build over the roof of their parents’ house, but it is
7
also a reflection on the importance of the extended family in the local culture. Almost one fifth of
8
the households in the city and the villages live in apartments in residential buildings. However, the
9
situation in the refugee camps is different. The land is rented by the United Nations for Refugees
10
and Works Agency (UNRWA) from the owners of the land and all the houses within the refugee
11
camps’ boundaries are registered in the UNRWA (Barahmi, 2016). The refugee households expand
12
in the very limited area available or add new units over the existing structures.
13
Table 9: The Housing Typologies Percentage in the City, Villages and Refugee Camps in Hebron in the survey vs. PCBS 14 Type of settlement Single housing% Apartment in a residential building% Apartment in an extended family residential building% Apartment in a mixed-use building% Other City 50.3 19.7 28.4 1.6 - villages 48.8 20.8 28 2.4 - Refugee camps 16.7 33.3 50 00.4% - Hebron Governorate in (PCBS) 63.5%, 36.1% 0.4% 15 4.4.Housing Area 16
The area of the housing units was calculated by multiplying the number of rooms by 12 m2 and the
17
number of bathrooms by 5 m2 which is the average size of the room and bathroom in the Palestinian
18
housing market (Al Qadi, Sodagar, and Elnokaly, 2017). The average calculated area of the housing
19
units of the respondents is 125.9 m2 similar to the official statistics in 2015 indicating that the
20
average area of the housing units in Palestine is 126.2m2 (PCBS, 2015). The survey results show
21
that the single housing has the largest average area and that the apartments in residential buildings
22
has the smallest area as depicted in Figure 6.
23 24 25 26 27
Figure 6: The Average Area in the Different Housing Typologies
4.5. Thermal insulation
1
Like many parts of the Middle East, the building sector in Hebron suffers from scarcity of the 2
thermal insulation (Elnokaly & Elseragy, 2007b; Lazzeronia et al., 2017). Figure 7 shows the level 3
of insulation of the different types of housing. Generally using floor and floor thermal insulation is 4
not a common practice. The respondents were asked about the walls thermal insulation. The survey 5
shows that partial insulation in the external walls is common. 6 7 8 9 10 11
Figure 7: Thermal Insulation Level in the Different Housing Typologies
12
4.6.Heating trends and heating systems used
13
The survey revealed that 99.6% of the households heated their houses during winter. In 2015, the 14
PCBS indicated that 6% of the households in the West Bank did not heat their houses (PCBS, 15
2015a). The variation between this survey and the official statistics is mainly due to the
16
geographical differences. The official statistics studied the West Bank including the Jordan Valley 17
region. The average temperature in Jordan Valley was 24.9 °Cbetween 2009 and 2016 and is 18
generally warm during winter so many households do not need to heat their houses according to the 19
responses of the survey (PCBS, 2016c). On the other hand, the average temperature during the same
20
period in Hebron was 16.9 °C with cold winters forcing most of the households to use a source of 21
heating (PCBS, 2016c).
22
The households essentially rely on more than one type of heating system using different fuels to
23
compensate for any fuel deficiencies or electricity blackouts. The survey revealed that there is a
24
variation between the heating systems used in the different types of settlements as demonstrated in
25
Figure 8. The dominant heating system is the electric heaters in all types of settlements. This could
26
be due to the accessibility of electricity, as 99.9% of the Palestinian houses are connected to the
27
electricity network (PCBS, 2015a). The highest percentage of households relying on electricity
28
heaters was in the refugee camps. The reason for this high percentage could be due to the
29
government’s occasional subsidization of the electricity bills to support the refugees.
30
The second type of heating system in all of the settlements was the LPG heaters. Despite the fact
31
that LPG heaters are unsafe, they are popular since unlike most of the electrical systems,
households prepay for the LPG bottles and thus control their heating expenses. The percentage of
1
households using this system in the city was higher than in the villages or the refugee camps. The
2
main reason behind this pattern of consumption is that the number of local distributors and
3
frequency of supply in the city is better than in the villages or the refugee camps making it more
4
accessible to households in the city. Around 37.0% and 22.0% of the households in the city and the
5
villages respectively used the air conditioning system for heating. People tend to use them since
6
they are safer and distribute the heat better than the conventional electric heaters.
7
The type of settlement with the highest percentage of wood burning fireplaces was the villages,
8
followed by the city and the refugee camps as the wood there is more accessible. Central heating
9
systems were popular for heating the houses in Palestine during late eighties and the early nineties.
10
The use of central heating was popular when the fuel prices were reasonable; however, the use of
11
this system declined because of the increase in oil prices. Many of the houses that installed central
12
heating systems do not use them anymore because of the high cost of the fuel. Figure 8 shows that
13
central heating is only used in the city, contributing to 8.7%. None of the households in the villages
14
or the refugee camps uses central heating.
15
Furthermore, the survey showed that kerosene heaters are not popular in Hebron, with only 2.9% of
16
households in the city using them. This is due to the increase in kerosene prices and other heating
17
systems being safer to use. Finally, only 1.4% of the households in the city said that they use solar
18
thermal heating systems in their homes.
19
The (PCBS) use a different way of classification when defining the main heating systems used by 20
households. In 2015 households energy survey 72% of the households used a heater (electrical, 21
LPG and kerosene), 31% used wood burn heaters and 3.6% used the central heating in the south of 22
the West Bank. This classification does not reflect the fact that many of the households use a 23
mixture of several heating systems (PCBS, 2015b).
24
25
Figure 8: Variation in the Types of System Used for Heating in Hebron Settlements
5. Discussion
1
5.1. Comparison with previous studies
2
The survey showed that the Palestinian households’ average energy consumption for heating per 3
household in Hebron Governorate is 2785kWh/year. Ouda (2010) estimated the average annual 4
energy used for heating in the West Bank was 5286 kWh. The variation between this survey and the 5
previous study could be a combination of factors including location, climatic differences, socio-6
economic discrepancies as well as the time lag between the two surveys. The study in 2010 7
included all the cities in the West Bank but this survey studies the heating consumption in the 8
households in Hebron. The variation in the climatic conditions of these cities, social and economic 9
characteristics of the households in the different regions can have an impact on the results. 10
Furthermore, the time span between the two surveys is almost ten years in which economic and 11
social changes has taken place. For example, the fuel prices have increased dramatically in Palestine 12
during the last 10 years. Figure 7 demonstrates the crude oil prices between 1999 and 2015 13
(Historical Crude Oil Prices, n.d) versus the Palestinian households’ overall consumption of the 14
different kinds of energy sources for the years 1999, 2003, 2005, 2010 and 2015 (PCBS, 2000; 15
PCBS, 2004; PCBS, 2006; PCBS, 2011; PCBS, 2015a). There is a negative relation between the
16
fossil fuel prices and the households’ consumption as depicted in Figure 9. It also indicates a 17
positive relation between using wood and the fossil fuel prices. The increase in the price of crude oil 18
between 1997 and 2007 was around 244.4%. The price decreased in 2016 but it was still higher than 19
1997’s price by 84.5%. The local political situation is another reason behind the consumption trend 20
in Figure 9. The Palestinians faced a great economic deterioration during the Second Palestinian 21
Uprising (Intifada) that took place in September 2000, increasing the unemployment rate from 22
14.6% in 2000 to 33.5% in 2002 (PCBS, 2016b). The Second Uprising was followed by a strict
23
closure on the cities and villages by the Israelis, decreasing the accessibility and the affordability of 24
the fuel in addition to most of the basic products (Pressman, 2006).
25 26
1
Figure 9: Annual Average Crude Oil Prices (In $/Barrel) vs. the Average Monthly Consumption of Different
2
Types of Fuels by the Palestinian Households (InvestmentMine, 2017); (PCBS, 2000); (PCBS,2004); (PCBS,2006);
3
(PCBS,2011); (PCBS,2015)
4
5.2. Heating energy, type of settlement, housing typology
5
A variation was found between the heating energy consumed in different settlements. The average 6
heating energy calculated in this survey was 3555.9 kWh, 1400.4 kWh and 1335.1 kWh in the city, 7
villages and refugee camps respectively. The single housing has the highest consumption of heating 8
energy in all the settlements due to larger envelop area as compared to other housing typologies. 9
The consumption in the apartments in the residential buildings in the city is less than the apartments 10
in the extended family multistory building. This can be due to that extended households share the 11
energy resources in many cases. Having one electricity meter for the extended family is an example 12
of that. This procedure leads to an increase in the consumption by the individual households. On the 13
contrary, the consumption of the households who live in an apartment in an extended family 14
building in the villages is less than the households living in residential buildings. This is probably 15
because the households in the villages tend to spend more time together in one apartment during the 16
day which decreases the amount of energy consumed for heating. Finally, the consumption in the 17
households in the mixed-use buildings in the city and refugee camps is the lower than the other 18
typologies within the same settlement. Non- residential spaces are not properly heated in mixed use 19
buildings and hence increased heat loss from dwellings to these spaces and due to lack of insulation, 20
households tend to not to consume energy that will be wasted by heat loss. 21
5.3. Heating energy, income and family size
22
Figure 11 illustrates the annual energy consumed for heating in the different housing typologies in 23
different settlements versus the average households’ monthly income for each of the housing 24
typologies and the size of the household. In this study, a relationship can be seen between the 25
monthly income of the households and the energy consumed for heating in the refugee camps as 26
illustrated in figure 10. However, no clear relationship was found between the households’ income 27
and the energy consumed for heating in the cities and villages. Nevertheless, the variation of the 1
energy consumption can be a reflection of different comfort preferences of the households in the 2
different settlements. A significant positive relationship between the family size and energy use 3
was depicted by Badir (2013). In this survey, a relationship was found between the households’ size 4
in the city and the heating energy consumption; however, this is not applicable in the villages nor in 5
the refugee camps. 6
7
Fig 10: The Average Energy Consumption for Heating in the Housing Typologies in the Different Settlements vs. 8
the Average Households’ Size and the Average Monthly Households’ Income 9
10
5.4. Heating energy, total area and specific heating
11
The house size and the number of rooms contribute towards the total energy consumption of a house
12
(Morrison and Gladhart, 1976). Mileham and Brandt (1990) have found that the best predictor of money
13
spent on energy is the size of a dwelling. However, in this study due to the other many socio-economic and
14
political factors the energy consumed for heating shows no direct relationship with the total area as
15
illustrated in Figure 12, which means that there is no direct relationship between the two variables. Other
16
variables potentially have an impact on the heating energy consumption like the house layout, surface to
17
volume ratio and openings to total area ratio which were not part of the survey.
1
Fig 12: Heating energy vs. Total Area 2
The specific heating energy (energy/sqm) is the highest in the apartments in residential buildings 3
followed by the single housing and the apartments in extended family buildings respectively as 4
shown in Figure 11. The average area of the apartments in residential buildings is less than the other 5
types of housing as shown in Figure 6. 6
The specific heating energy (energy/sqm) is the highest in the apartments in residential buildings 7
followed by the single housing and the apartments in extended family buildings respectively as 8
shown in Figure 11. The average area of the apartments in residential buildings is less than the other 9
types of housing as shown in Figure 6. Regarding the single housing, and despite that the average 10
area is the highest in this typology, single housing is more exposed to the external environment than 11
the other housing typologies which means that the heating loss is higher and more heating is needed 12
to maintain a certain level of warmth. The specific heating energy in the apartments in the extended 13
family buildings and in mixed use buildings comes in third place and fourth place respectively 14
which reflects the average area of these typologies in the survey. 15
16
Fig 11: The Specific Heating Energy vs. Housing Typology 17 18 19 20 21 22
1
5.5. Nominal heated area
2
Since no clear relationship between the house area and the heating energy found, the heated area is 3
examined. The Palestinian households do not heat the entire house during winter. Basically, only 4
the occupied areas are heated throughout the day as a result of economic limitations. In the survey, 5
the households were asked to define the areas that were heated during different periods in a typical 6
day during winter. The day was divided into five main periods, each is 4.8 hours long. The 7
distribution of the heated spaces is illustrated in Figure 10. The chart shows that the majority of the 8
households heated the living room during the afternoon and evening. The survey revealed that the 9
majority of the households heated the guest room occasionally. Most of the households heated the 10
bedroom during the evening before going to sleep. The results indicated that 33.5% and 43.2% of 11
the households have never heated the kitchen or the bathrooms respectively. This is because 12
cookers, ovens and other utilities in the kitchen produce heat which compensate for the heating 13
demand. Figure 13 depicts the number of households that heated the different spaces during a 14
typical winter day. 15
In order to calculate the nominal heated area, the area of the average room (3.5 *4m) was multiplied 16
by 0.2 (4.8 divided by 24 hours) for each period during which the room was heated. For example, if 17
the household heated the living room during the afternoon and evening and three bedrooms during 18
the evening, the nominal heated area in this case will be (3.5*4*2*0.2)+ (3.5*4*3*0.2)= 14.0 m2 19
/day. 20
21
Figure 13: The Pattern of Heating the Different Spaces in the Houses during a Typical Day in Winter
22
Based on the analysis of 322 cases, the average nominal heated area in the houses was 12.1 m2/day. 23
This Figure represents 9.2% of the average housing area. The maximum nominal heated area did 24
not exceed 11.1% of the total area of any of the 322 houses. The average nominal heated area was 1
the highest in the city followed by the refugee camps and then the villages for the different housing 2
typologies as shown in Figure 14. The nominal heated area varied between less than 4.0m²/day in 3
the apartments in the residential buildings in the refugee camps to 14.0m²/day in the apartments in 4
the extended family housing in the city. The variation could be due to a combination of parameters 5
including comfort preferences, energy cost and occupancy rate that affects the duration of heating. 6
The average calculated heated area of the single housing was very close in the city, the villages and 7
the refugee camps. Similarly, not much variation was found between the calculated heated area in 8
the city and the villages in the mixed-use housing. On the contrary, a discrepancy was noticed in the 9
apartments in both extended family housing and the residential buildings in the three types of 10
settlements. The previous discussion shows that the households spatial experience shrinks during 11
winter due to the inability to heat all the areas in the house. 12
13
Figure 14: The Average Nominal Heated Area for the Different Housing Typologies in the Settlements in Hebron
14
6. Developing a model for estimating the annual heating energy for Hebron
15
For this research, a multi linear regression model is developed based completely on the empirical 16
data collected in survey to predict the annual heating energy in the houses in Hebron by SPSS using 17
Ridge Regression Analysis. Among the 17 factors that have been investigated in the survey, 14 18
factors were found to be significant in determining the energy consumed for heating as indicated in 19
Table 10. The factors are considered to be significant if the Sig. (2-Tailed) value is less than 0.05. In 20
addition to previously discussed factors, building material, occupancy period and the housing age 21
were found important with Sig. (2-Tailed) value equals 0.000, 0.022 and 0.001 respectively. The 22
data sets yielded the following Fitted Regression Equation (Model) for determining the annual
1
heating energy consumption (Y):
2
(Eq. 7) 3
Equation 4: Fitted Regression Equation (Model) for determining the annual heating energy consumption (Y) 4
Where i is the ith influencing factor and F is the value of the factor as shown in Table 10. The 5
households’ size and the total area of the house are considered critical in determining the energy 6
consumption in the housing sector (Badir, 2013; Mileham & Brandt, 1990; Morrison & Gladhart, 7
1976). In this study, the households’ size and the total housing area had no significant impact on the 8
energy used for heating. The Sig. (2-Tailed) value for the households’ size was 0.238> 0.05, while 9
for the total area it was 0.301>0.05, indicating that these variables have no significant effect on the 10
annual heating consumption. The explanation behind it, is that regardless of the households’ size or 11
the housing size, the family members spend their time together in a heated part of the house, 12
basically one room. On the other hand, the nominal heated area has a significant effect on the 13
heating energy consumed with a Sig. (2-Tailed) value of (0.00). Despite that their Sig. (2-Tailed)
14
value were > 0.05, using central heating and using the kerosene heaters were included in the factors
15
since they had an effect on the R2 of the model.
16
7. Model evaluation
17
The R2 in this model is almost 0.606, which means that the model can explain 60.6% of the energy
18
used for heating. Figure 15 compares the fitted values of the regression analysis with the calculated
19
values from the survey and shows the model performance. The study method used here may have
20
certain limitations because it does not consider other important factors like orientation, adjacent
21
buildings, building geometry, space layout, surface to volume ratio and openings to area ratio
22
(Elseragy and Elnokaly; 2007). Obviously, there are several methods of estimating the heating
23
energy consumption like simulation programs but such methods need detailed data which are not
24
always available in the Palestinian context (Ren and Chen, 2015;Sami-Mecheri, Semmar and
25
Hamid, 2015; Al Qadi, Sodagar and Elnokaly, 2017). The proposed model in this study is a
26
simplified method that can be used as rule of thumb or a user-friendly method for estimating the
27
energy consumed for heating in Hebron in the context where the detailed data is not available.
28 29
1
Figure 15: The Calculated vs. the Fitted Energy Used for Heating
2 3
8. Conclusion
4
In order to assist the shift towards more independent and sustainable energy technologies in
5
Palestine the current energy consumption should be identified and optimized. This paper main
6
contribution is a regression model that estimates the heating energy consumption in the residential
7
sector in Hebron. With the absence of detailed data on heating energy consumption in Palestine, a
8
model for estimating the annual energy consumption was developed using Ridge Regression
9
Analysis with an R2 of 0.606. The housing typology, housing age, building materials and wall
10
insulation were important physical features in this model with Sig. (2-Tailed) equals 0.000 for all of
11
them. The nominal heated area was an important determinant with a Sig. (2-Tailed) equals 0.000.
12
The households’ monthly income and occupancy period were found to have a significant impact on
13
the amount of energy used for heating with Sig. (2-Tailed) equals 0.010 and 0.024 respectively. The
14
type of settlement was found to have an impact on the annual heating energy consumption with Sig.
15
(2-Tailed) equals 0.027. The number of months during which the households heated their houses
16
was influential with a Sig. (2-Tailed) equals 0.036. In addition, the type of heating systems were
17
influential with Sig. (2-Tailed) varied between 0.000 and 0.134. The model can be used as a
18
simplified and user friendly tool to estimate the heating energy consumed by the Palestinian
19
households in Hebron by professionals, policy makers and building industry. Future research is
20
required to identify other influencing factors such as the building orientation, floor layout,
21
fenestration design, and volume-to-surface ratio.
22 23 24
Table 10, Influencing Factors (F) Affecting the Heating Consumption 1
2
3
Factor i Description Options Value (F) Sig.
(2-Tailed) value F1 The Housing Typology Single Housing 279.351 .000 Apartment in a Residential Building 558.702 Apartment in an Extended Family Building 838.053 Apartment in a Mixed-Use Building 1117.404 F2 Type Of Settlement The City 373.666 .011 The Villages 747.332 The Refugee Camps 1120.998 F3 Walls Insulation Not Insulated 329.968 .000 Partially Insulated 659.936 Fully 989.904 Not Sure 1319.872
F4 Heated Area In (Sq.M/Day) as
Explained in section 5.5. 81.235* Calculated Heated Area .000 F5 The Main Building Materials Brick, Concrete and Stone 281.799 .000 Concrete and Stone 563.598 Bricks and External Plaster 845.397 Bricks And (Stone on The Main Façade and
Plaster on The Remaining Façades) 1127.196 Stone (Old Buildings System) 1408.995
Factor i Description Options Value (F)
Sig. (2-Tailed) Value F6 The Family Monthly Income
Less Than 1500 Ils
137.531 .024 1500-3000 Ils 275.062 3000-5000 Ils 412.593 5000-7500 Ils 550.124 7500- 1000 Ils 687.655 F7 The Housing Age
Less Than 1 Year
155.810 .001 1-5 Years 311.62 11-20 Years 467.43 21-40 Years 623.24 More Than 40 Years
779.05 F8 Using Fire Place Yes 3968.618 .000 No 7937.236 F9 Using Central Heating Yes 977.411 .101 No 1954.822 F10 Using Lpg Heaters Yes 1067.983 .000 No 2073.546 F11 Using Kerosene Heaters Yes 1020.841 .202 No 2135.966 F12 Using Electrical Heating Systems Yes 946.805 .001 No 1893.61