1
Mochi: Visual Log-Analysis Based Tools for Debugging Hadoop
Jiaqi Tan, Xinghao Pan, Soila Kavulya, Rajeev Gandhi, Priya Narasimhan
Electrical & Computer Engineering Department Carnegie Mellon University, Pittsburgh, PA 15213-3890
{jiaqit,xinghaop,spertet,rgandhi,priyan}@andrew.cmu.edu
Abstract
Mochi, a new visual, log-analysis based debugging tool correlates Hadoop’s behavior in space, time and vol-ume, and extracts a causal, unified control- and data-flow model of Hadoop across the nodes of a cluster. Mochi’s analysis produces visualizations of Hadoop’s behavior using which users can reason about and debug performance issues. We provide examples of Mochi’s value in revealing a Hadoop job’s structure, in optimiz-ing real-world workloads, and in identifyoptimiz-ing anomalous Hadoop behavior, on the Yahoo! M45 Hadoop cluster.
1
Introduction
MapReduce (MR) [7] is a programming paradigm and framework introduced by Google for data-intensive cloud computing on commodity clusters. Hadoop [9], an open-source Java implementation of MapReduce, is used by Yahoo! and Facebook, and is available on Ama-zon’s pay-as-you-use EC2 cloud computing infrastruc-ture. Debugging the performance of Hadoop programs is difficult because of their scale and distributed na-ture. Hadoop can be debugged by examining the local (node-specific) logs of its execution. These logs can be large, and must be manually stitched across nodes to debug system-wide problems. Current Java
debug-ging/profiling tools (jstack,hprof) target
program-ming abstractions to help debug local code-level errors rather than distributed problems across multiple nodes [16]. In addition, these tools do not provide insights at the higher level of abstraction (e.g. Maps and Reduces) that is more natural to MR users and programmers. Sim-ilarly, path-tracing tools [8] for distributed systems pro-duce fine-grained views at the language rather than at the MR abstraction.
Our survey of the Hadoop users’ mailing-list indi-cates that the most frequent performance-related ques-tions are indeed at the level of MR abstracques-tions. We examined the 3400 posts on this mailing list over a 6-month period (10/2008 to 4/2009), and classified the
30-odd explicit performance-related posts2(some posts
1This research was partially funded by the Defence Science &
Technology Agency, Singapore, via the DSTA Overseas Scholarship, and sponsored in part by the National Science Foundation, via CA-REER grant CCR-0238381 and grant CNS-0326453.
2As expected of mailing-lists, most of the 3400 posts were from
users learning about and configuring Hadoop (note that misconfigu-rations can also lead to performance problems). We filtered out, and
had multiple categories) in Table 1. These posts fo-cused on MR-specific aspects of Hadoop program be-havior. The primary response to these posts involved suggestions to use Java profilers, which do not capture dynamic MR-specific behavior, such as relationships in time (e.g., orders of execution), space (which tasks ran on which nodes), and the volumes of data in various pro-gram stages. This motivated us to extract and analyze time-, space- and volume-related Hadoop behavior.
The MR framework affects program performance at the macro-scale through task scheduling and data distri-bution. This macro behavior is hard to infer from low-level language views because of the glut of detail, and because this behavior results from the framework out-side of user code. For effective debugging, tools must expose MR-specific abstractions. This motivated us to capture Hadoop distributed data- and execution-related behavior that impacts MR performance. Finally, given the scale (number of nodes, tasks, interactions, dura-tions) of Hadoop programs, there is also a need to visual-ize a program’s distributed execution to support debug-ging and to make it easier for users to detect deviations from expected program behavior/performance. To the best of our knowledge, Mochi is the first debugging tool for Hadoop to extract (from Hadoop’s own logs) both control- and data-flow views, and to then analyze and vi-sualize these views in a distributed, causal manner. We provide concrete examples where Mochi has assisted us and other Hadoop users in understanding Hadoop’s be-havior and unearthing problems.
2
Problem Statement
Our previously developed log-analysis tool, SALSA [18], extracted various statistics (e.g., durations of Map and Reduce tasks) of system behavior from Hadoop’s logs on individual nodes. Mochi aims to go beyond SALSA, to (i) correlate Hadoop’s behavior in space, time and volume, and (ii) extract causal, end-to-end, dis-tributed Hadoop behavior that factors in both computa-tion and data across the nodes of the cluster. From our interactions with real Hadoop users (of the Yahoo! M45 [11] cluster), a third need has emerged: to provide help-ful visualizations of Hadoop’s behavior so that users can reason about and debug performance issues themselves.
Goals. Mochi’s goals are:
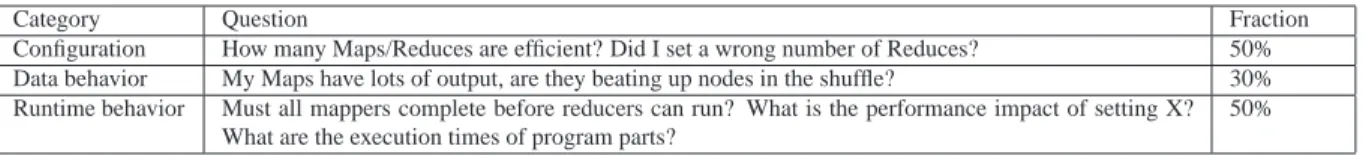
Category Question Fraction
Configuration How many Maps/Reduces are efficient? Did I set a wrong number of Reduces? 50%
Data behavior My Maps have lots of output, are they beating up nodes in the shuffle? 30%
Runtime behavior Must all mappers complete before reducers can run? What is the performance impact of setting X? What are the execution times of program parts?
50% Table 1: Common queries on users’ mailing list
To expose MapReduce-specific behavior that results from the MR framework’s automatic execution, that affects program performance but is neither visible
nor exposed to user Map/Reduce code, e.g. when
Maps/Reduces are executed and on which nodes, from/to where data inputs/outputs flow and from which Maps/Reduces. Existing Java profilers do not capture such information.
To expose aggregate and dynamic behavior that can provide different insights. For instance, Hadoop sys-tem views in time can be instantaneous or aggregated across an entire job; views in space can be of individual Maps/Reduces or aggregated at nodes.
To be transparent so that Mochi does not require any modifications to Hadoop, or to the way that Hadoop users write/compile/load their programs today. This also makes Mochi amenable to deployment in production Hadoop clusters, as is our objective.
Non-goals. Our focus is on exposing MR-specific
as-pects of programs rather than behavior within each Map or Reduce. Thus, the execution specifics or correctness of code within a Map/Reduce is outside our scope. Also, Mochi does not discover the root-cause of performance problems, but aids in the process through useful visual-izations and analysis that Hadoop users can exploit.
3
Mochi’s Approach
MapReduce programs, or jobs, consist of Map tasks fol-lowed by Reduce tasks; multiple identical but distinct in-stances of tasks operate on distinct data segments in par-allel across nodes in a cluster. The framework has a sin-gle master node (running the NameNode and JobTracker daemons) that schedules Maps and Reduces on multiple slave nodes. The framework also manages the inputs and outputs of Maps, Reduces, and Shuffles (moving of Map outputs to Reduces). Hadoop provides a dis-tributed filesystem (HDFS) that implements the Google Filesystem [10]. Each slave node runs a TaskTracker (execution) and a DataNode (HDFS) daemon. Hadoop programs read and write data from HDFS. Each Hadoop node generates logs that record the local execution of tasks and HDFS data accesses.
3.1 Mochi’s Log Analysis
Mochi constructs cluster-wide views of the execution of MR programs from Hadoop-generated system logs. Mochi builds on our log-analysis capabilities to ex-tract local (node-centric) Hadoop execution views [18].
0 200 400 600 800 0 50 100 150 200 Time/s P e r-ta sk
Detailed Swimlanes: Sort Workload (4 nodes)
MapTask ReduceCopyReceive ReduceMergeCopy ReduceTask MapTask ReduceCopyReceive ReduceMergeCopy ReduceTask MapTask ReduceCopyReceive ReduceMergeCopy ReduceTask MapTask ReduceCopyReceive ReduceMergeCopy ReduceTask
Figure 2: Swimlanes: detailed states: Sort workload Mochi then correlates these views across nodes, and also between HDFS and the execution layer, to con-struct a unique end-to-end representation that we call a Job-Centric Data-flow (JCDF), which is a distributed, causal, conjoined control- and data-flow.
Mochi parses Hadoop’s logs3based on SALSA’s [18]
state-machine abstraction of Hadoop’s execution. In its log analysis, Mochi extracts (i) a time-stamped, cross-node, control-flow model by seeking string-tokens that identify TaskTracker-log messages signaling the starts and ends of activities (e.g., Map, Reduce), and (ii) a time-stamped, cross-node, data-flow model by seeking string-tokens that identify DataNode-log messages sig-naling the movement/access of data blocks, and by cor-relating these accesses with Maps and Reduces running at the same time. Mochi assumes that clocks are syn-chronized across nodes using NTP, as is common in pro-duction Hadoop clusters.
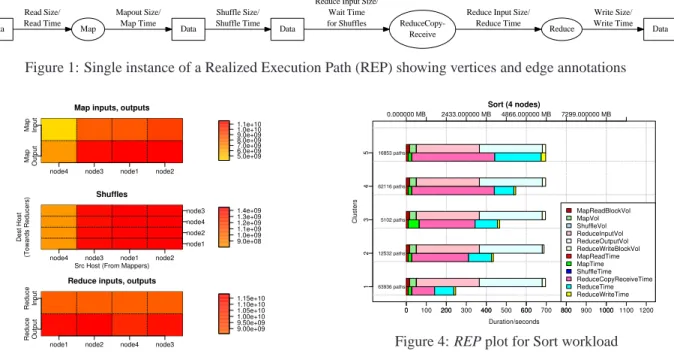
Mochi then correlates the execution of the TaskTrack-ers and DataNodes in time (e.g. co-occurring Maps and block reads in HDFS) to identify when data was read from or written to HDFS. This completes the causal path of the data being read from HDFS, processed in the Hadoop framework, and written to HDFS, creating a JCDF, which is a directed graph with vertices repre-senting processing stages and data items, and edges an-notated with durations and volumes (Figure 1). Finally we extract all Realized Execution Paths (REPs) from the JCDF graph–unique paths from a parent node to a leaf node– using a depth-first search. Each REP is a distinct end-to-end, causal flow in the system.
3Mochi uses SALSA to parse TaskTracker and DataNode logs. We
Data Map Read Size/ Read Time
Data Data
Shuffle Size/
Shuffle Time
ReduceCopy-Receive Reduce Input Size/
Wait Time for Shuffles Data Mapout Size/ Map Time Reduce Reduce Input Size/
Reduce Time
Write Size/ Write Time
Figure 1: Single instance of a Realized Execution Path (REP) showing vertices and edge annotations
5.0e+09 6.0e+09 7.0e+09 8.0e+09 9.0e+09 1.0e+10 1.1e+10 Map inputs, outputs
node4 node3 node1 node2
M a p O u tp u t M a p In p u t
Src Host (From Mappers)
D e s t H o s t (T o w a rd s R e du c e rs ) 9.0e+08 1.0e+09 1.1e+09 1.2e+09 1.3e+09 1.4e+09 Shuffles
node4 node3 node1 node2
node1 node2 node4 node3 9.00e+09 9.50e+09 1.00e+10 1.05e+10 1.10e+10 1.15e+10 Reduce inputs, outputs
node1 node2 node4 node3
R e d u c e O u tp u t R e du c e In p u t
Figure 3: MIROS: Sort workload; (volumes in bytes) Thus, Mochi automatically generates, and then cor-relates, the cross-node data- and control-flow models of Hadoop’s behavior, resulting in a unified, causal, cluster-wide execution+data-flow model.
3.2 Mochi’s Visualization
Mochi’s distributed data- and control-flows capture MR programs in three dimensions: space (nodes), time (du-rations, times, sequences of execution), and volume (of data processed). We use Mochi’s analysis to drive visu-alizations that combine these dimensions at various ag-gregation levels. In this section, we describe the form of these visualizations, without discussing actual exper-imental data or drawing any conclusions from the visu-alizations (although the visuvisu-alizations are based on real experimental data). We describe the actual workloads and case studies in §4.
“Swimlanes”: Task progress in time and space. In
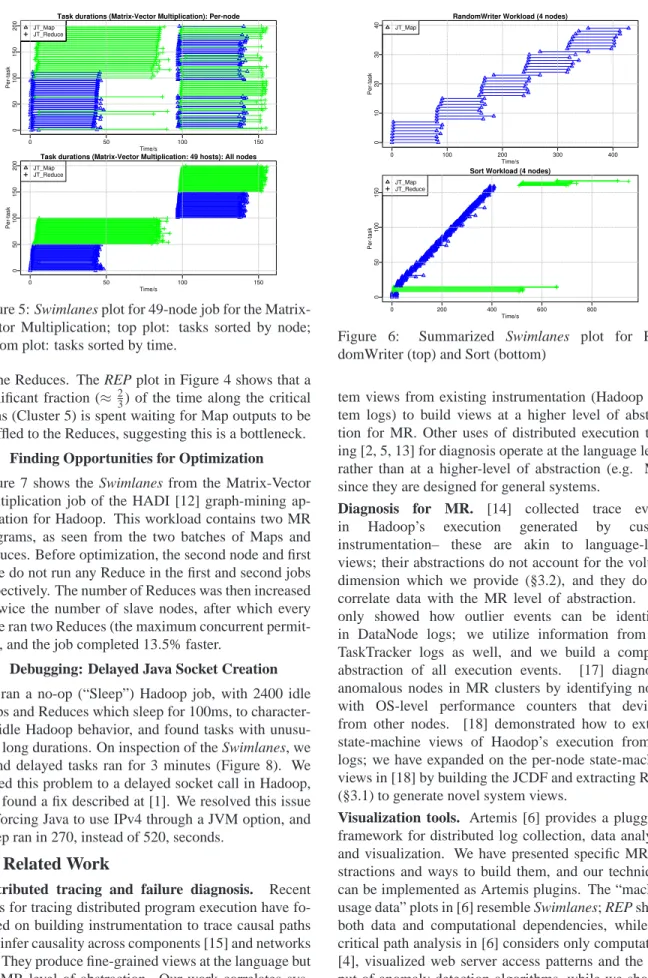
such a visualization, the x-axis represents wall-clock time, and each horizontal line corresponds to an exe-cution state (e.g., Map, Reduce) running in the marked time interval. Figure 2 shows a sample detailed view with all states across all nodes. Figure 6 shows a sample summarized view (Maps and Reduces only) collapsed across nodes, while Figure 7 shows summarized views with tasks grouped by nodes. Figure 5 shows Swimlanes for a 49-slave node cluster. Swimlanes are useful in cap-turing dynamic Hadoop execution, showing where the job and nodes spend their time.
“MIROS” plots: Data-flows in space. MIROS (Map
Inputs, Reduce Outputs, Shuffles, Figure 3) visualiza-tions show data volumes into all Maps and out of all
Re-0 200 400 600 800 1000 1200 Duration/seconds C lu s te rs 63936 paths 12532 paths 5102 paths 62116 paths 16853 paths 0 100 200 300 400 500 600 700 800 900 1000 1100 1 2 3 4 5 0.000000 MB 2433.000000 MB 4866.000000 MB 7299.000000 MB MapReadBlockVol MapVol ShuffleVol ReduceInputVol ReduceOutputVol ReduceWriteBlockVol MapReadTime MapTime ShuffleTime ReduceCopyReceiveTime ReduceTime ReduceWriteTime Sort (4 nodes)
Figure 4: REP plot for Sort workload
duces on each node, and between Maps and Reduces on nodes. These volumes are aggregated over the program’s run and over nodes. MIROS is useful in highlighting skewed data flows that can result in bottlenecks.
REP: Volume-duration correlations. For each REP
flow, we show the time taken for a causal flow, and the volume of inputs and outputs, along that flow (Figure 4). Each REP is broken down into time spent and volume processed in each state. We use the k-means clustering algorithm to group similar paths for scalable visualiza-tion. For each group, the top bar shows volumes, and the bottom bar durations. This visualization is useful in (i) checking that states that process larger volumes should take longer, and (ii) in tracing problems back to any pre-vious stage or data.
4
Examples of Mochi’s Value
We demonstrate the use of Mochi’s visualizations (using mainly Swimlanes due to space constraints). All data is derived from log traces from the Yahoo! M45 [11] production cluster. The examples in § 4.1, § 4.2 involve 4-slave and 49-slave clusters, and the example in § 4.3 is from a 24-slave cluster.
4.1 Understanding Hadoop Job Structure
Figure 6 shows the Swimlanes plots from the Sort and RandomWriter benchmark workloads (part of the
Hadoop distribution), respectively. RandomWriter
writes random key/value pairs to HDFS and has only Maps, while Sort reads key/value pairs in Maps, and aggregates, sorts, and outputs them in Reduces. From these visualizations, we see that RandomWriter has only Maps, while the Reduces in Sort take significantly longer than the Maps, showing most of the work occurs
0 50 100 150 0 50 100 150 200 Time/s P e r-ta sk
Task durations (Matrix-Vector Multiplication): Per-node JT_Map JT_Reduce JT_Map JT_Reduce JT_Map JT_Reduce JT_Map JT_Reduce JT_Map JT_Reduce JT_Map JT_Reduce JT_Map JT_Reduce JT_Map JT_Reduce JT_Map JT_Reduce JT_Map JT_Reduce JT_Map JT_Reduce JT_Map JT_Reduce JT_Map JT_Reduce JT_Map JT_Reduce JT_Map JT_Reduce JT_Map JT_Reduce JT_Map JT_Reduce JT_Map JT_Reduce JT_Map JT_Reduce JT_Map JT_Reduce JT_Map JT_Reduce JT_Map JT_Reduce JT_Map JT_Reduce JT_Map JT_Reduce JT_Map JT_Reduce JT_Map JT_Reduce JT_Map JT_Reduce JT_Map JT_Reduce JT_Map JT_Reduce JT_Map JT_Reduce JT_Map JT_Reduce JT_Map JT_Reduce JT_Map JT_Reduce JT_Map JT_Reduce JT_Map JT_Reduce JT_Map JT_Reduce JT_Map JT_Reduce JT_Map JT_Reduce JT_Map JT_Reduce JT_Map JT_Reduce JT_Map JT_Reduce JT_Map JT_Reduce JT_Map JT_Reduce JT_Map JT_Reduce JT_Map JT_Reduce JT_Map JT_Reduce JT_Map JT_Reduce JT_Map JT_Reduce JT_Map JT_Reduce 0 50 100 150 0 50 100 150 200 Time/s P e r-ta sk
Task durations (Matrix-Vector Multiplication: 49 hosts): All nodes JT_Map
JT_Reduce
Figure 5: Swimlanes plot for 49-node job for the Matrix-Vector Multiplication; top plot: tasks sorted by node; bottom plot: tasks sorted by time.
in the Reduces. The REP plot in Figure 4 shows that a
significant fraction (≈2
3) of the time along the critical
paths (Cluster 5) is spent waiting for Map outputs to be shuffled to the Reduces, suggesting this is a bottleneck.
4.2 Finding Opportunities for Optimization
Figure 7 shows the Swimlanes from the Matrix-Vector Multiplication job of the HADI [12] graph-mining ap-plication for Hadoop. This workload contains two MR programs, as seen from the two batches of Maps and Reduces. Before optimization, the second node and first node do not run any Reduce in the first and second jobs respectively. The number of Reduces was then increased to twice the number of slave nodes, after which every node ran two Reduces (the maximum concurrent
permit-ted), and the job completed 13.5% faster.
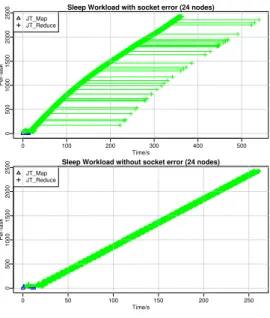
4.3 Debugging: Delayed Java Socket Creation
We ran a no-op (“Sleep”) Hadoop job, with 2400 idle Maps and Reduces which sleep for 100ms, to character-ize idle Hadoop behavior, and found tasks with unusu-ally long durations. On inspection of the Swimlanes, we found delayed tasks ran for 3 minutes (Figure 8). We traced this problem to a delayed socket call in Hadoop, and found a fix described at [1]. We resolved this issue by forcing Java to use IPv4 through a JVM option, and Sleep ran in 270, instead of 520, seconds.
5
Related Work
Distributed tracing and failure diagnosis. Recent tools for tracing distributed program execution have fo-cused on building instrumentation to trace causal paths [3], infer causality across components [15] and networks [8]. They produce fine-grained views at the language but not MR level of abstraction. Our work correlates
sys-0 100 200 300 400 0 10 20 30 40 Time/s P e r-ta sk
RandomWriter Workload (4 nodes) JT_Map 0 200 400 600 800 0 50 100 150 Time/s P e r-ta sk
Sort Workload (4 nodes) JT_Map
JT_Reduce
Figure 6: Summarized Swimlanes plot for
Ran-domWriter (top) and Sort (bottom)
tem views from existing instrumentation (Hadoop sys-tem logs) to build views at a higher level of abstion for MR. Other uses of distributed execuabstion trac-ing [2, 5, 13] for diagnosis operate at the language level, rather than at a higher-level of abstraction (e.g. MR) since they are designed for general systems.
Diagnosis for MR. [14] collected trace events
in Hadoop’s execution generated by custom
instrumentation– these are akin to language-level views; their abstractions do not account for the volume dimension which we provide (§3.2), and they do not correlate data with the MR level of abstraction. [19] only showed how outlier events can be identified in DataNode logs; we utilize information from the TaskTracker logs as well, and we build a complete
abstraction of all execution events. [17] diagnosed
anomalous nodes in MR clusters by identifying nodes with OS-level performance counters that deviated
from other nodes. [18] demonstrated how to extract
state-machine views of Haodop’s execution from its logs; we have expanded on the per-node state-machine views in [18] by building the JCDF and extracting REPs (§3.1) to generate novel system views.
Visualization tools. Artemis [6] provides a pluggable
framework for distributed log collection, data analysis, and visualization. We have presented specific MR ab-stractions and ways to build them, and our techniques can be implemented as Artemis plugins. The “machine usage data” plots in [6] resemble Swimlanes; REP shows both data and computational dependencies, while the critical path analysis in [6] considers only computation. [4], visualized web server access patterns and the out-put of anomaly detection algorithms, while we showed
0 200 400 600 800 0 10 20 30 40 50 60 Time/s P e r-ta sk
Matrix-Vector Multiplication Workload, (4 nodes) JT_Map JT_Reduce JT_Map JT_Reduce JT_Map JT_Reduce JT_Map JT_Reduce 0 100 200 300 400 500 600 700 0 20 40 60 Time/s P e r-ta sk
Matrix-Vector Multiplication Workload, (4 nodes)
JT_Map JT_Reduce JT_Map JT_Reduce JT_Map JT_Reduce JT_Map JT_Reduce
Figure 7: Matrix-vector Multiplication before optimiza-tion (above), and after optimizaoptimiza-tion (below)
system execution patterns.
6
Conclusion and Future Work
Mochi extracts and visualizes information about MR
programs at the MR-level abstraction, based on
Hadoop’s system logs. We show how Mochi’s analysis produces a distributed, causal, control+data-flow model of Hadoop’s behavior, and then show the use of the re-sulting visualizations for understanding and debugging the performance of Hadoop jobs in the Yahoo! M45 pro-duction cluster. We intend to implement our (currently) offline Mochi analysis and visualization to run online, to evaluate the resulting performance overheads and ben-efits. We also intend to support the regression testing of Hadoop programs against new Hadoop versions, and debugging of more problems, e.g. misconfigurations.
Acknowledgements
The authors would like to thank Christos Faloutsos and U Kang for discussions on the HADI Hadoop workload and for providing log data.
References
[1] Creating socket in java takes 3 minutes, 2004.
http://tinyurl.com/d5p3qr.
[2] M. K. Aguilera, J. C. Mogul, J. L. Wiener, P. Reynolds, and A. Muthitacharoen. Performance Debugging for Distributed Sys-tem of Black Boxes. In SOSP, Oct 2003.
[3] P. Barham, A. Donnelly, R. Isaacs, and R. Mortier. Using Mag-pie for Request Extraction and Workload Modelling. In OSDI, Dec 2004.
[4] P. Bodik, G. Friedman, L. Biewald, H. Levine, G. Candea, K. Pa-tel, G. Tolle, J. Hui, A. Fox, M. Jordan, and D. Patterson. Com-bining Visualization and Statistical Analysis to Improve Opera-tor Confidence and Efficiency for Failure Detection and Local-ization In ICAC, Jun 2005.
0 100 200 300 400 500 0 500 1000 1500 2000 2500 Time/s P e r-ta sk
Sleep Workload with socket error (24 nodes)
JT_Map JT_Reduce 0 50 100 150 200 250 0 500 1000 1500 2000 2500 Time/s P e r-ta sk
Sleep Workload without socket error (24 nodes)
JT_Map JT_Reduce
Figure 8: SleepJob with delayed socket creation (above), and without (below)
[5] M. Y. Chen, E. Kiciman, E. Fratkin, A. Fox, and E. Brewer. Pin-point: Problem Determination in Large, Dynamic Internet Ser-vices. In DSN, Jun 2002.
[6] G. Cretu-Ciocarlie, M. Budiu, and M. Goldszmidt. Hunting for problems with artemis. In Workshop on Analysis of System Logs, Dec 2008.
[7] J. Dean and S. Ghemawat. MapReduce: Simplified Data Pro-cessing on Large Clusters. In OSDI, Dec 2004.
[8] R. Fonseca, G. Porter, R. Katz, S. Shenker, and I. Stoica. X-Trace: A Pervasive Network Tracing Framework. In NSDI, Apr 2007.
[9] The Apache Software Foundation. Hadoop, 2007.
http://hadoop.apache.org/core.
[10] S. Ghemawat, H. Gobioff, and S. Leung. The Google Filesystem. In SOSP, Oct 2003.
[11] Yahoo! Inc. Yahoo! reaches for the
stars with M45 supercomputing project, 2007.
http://research.yahoo.com/node/1884.
[12] U. Kang, C. Tsourakakis, A.P. Appel, C. Faloutsos, and J. Leskovec. HADi: Fast Diameter Estimation and Mining in Massive Graphs with Hadoop. CMU ML Tech Report
CMU-ML-08-117, 2008.
[13] E. Kiciman and A. Fox. Detecting Application-level Failures in Component-based Internet Services. IEEE Trans. on Neural
Networks, 16(5):1027– 1041, Sep 2005.
[14] A. Konwinski, M. Zaharia, R. Katz, and I. Stoica. X-tracing Hadoop. Hadoop Summit, Mar 2008.
[15] Eric Koskinen and John Jannotti. Borderpatrol: Isolating Events for Black-box Tracing. In Eurosys 2008, Apr 2008.
[16] Arun Murthy. Hadoop MapReduce - Tuning and Debugging,
2008.http://tinyurl.com/c9eau2.
[17] X. Pan, J. Tan, S. Kavulya, R. Gandhi, and P. Narasimhan. Gane-sha: Black-Box Diagnosis of MapReduce Systems. In
HotMet-rics, Seattle, WA, Jun 2009.
[18] J. Tan, X. Pan, S. Kavulya, R. Gandhi, and P. Narasimhan. SALSA: Analyzing Logs as StAte Machines. In Workshop on
Analysis of System Logs, Dec 2008.
[19] W. Xu, L. Huang, A. Fox, D. Patterson, and M. Jordan. Min-ing Console Logs for Large-scale System Problem Detection. In