TOWARD A RISK FRAMEWORK FOR PRIORITIZING
ANCILLARY TRANSPORTATION ASSETS FOR MANAGEMENT
A Thesis Presented to The Academic Faculty
by
Richard S. Boadi
In Partial Fulfillment
of the Requirements for the Degree MS in Civil Engineering in the
School of CIVIL AND ENVIRONMENTAL ENGINEERING
Georgia Institute of Technology December 2011
TOWARD A RISK FRAMEWORK FOR PRIORITIZING
ANCILLARY TRANSPORTATION ASSETS FOR MANAGEMENT
Approved by:
Dr. Adjo Amekudzi, Advisor
School of Civil and Environmental Engineering Georgia Institute of Technology
Dr. Michael Meyer
School of Civil and Environmental Engineering Georgia Institute of Technology
Dr. Michael P. Hunter
School of Civil and Environmental Engineering Georgia Institute of Technology
To Hirut, Ronia, and Jozy
ACKNOWLEDGEMENTS
I would like to thank God Almighty, for his provision of my academic abilities. I would like to express my sincere gratitude to my advisor, Dr. Adjo Amekudzi, whose encouragement, guidance, and support from the initial to the final level enabled me to develop an in-depth understanding of the study. Furthermore, I would like to thank the entire faculty of Transportation Systems Engineering at the Georgia Institute of
Technology for their support throughout my study. In addition, I would like to thank my mother, sisters, and brother for their prayers and support during my studies. Lastly, to my wife, Hirut, and my two beautiful daughters, Ronia and Jozy, thank you for your understanding and support during all the periods that I have been away.
TABLE OF CONTENTS
Page
ACKNOWLEDGEMENTS IV
LIST OF TABLES VIII
LIST OF FIGURES IX
LIST OF SYMBOLS AND ABBREVIATIONS XI
SUMMARY XII
CHAPTER
1 INTRODUCTION 2
1.1 Background 2
1.2 Ancillary Transportation Assets 4
1.3 Study Objectives and Outline 10
1.4 Research Benefits 12
1.5 Thesis Organization 13
2 LITERATURE REVIEW 14
2.1 Introduction 14
2.2 Scope of Previous Studies 14
2.2 Asset Management 18
2.3 Analytical Tools 23
2.4 Information Technology 24
2.5 Geographic Information System 27
2.6 Risk and Uncertainty 31
2.7 Likelihoods and Consequences 33
2.9 Risk Assessment and Risk Management 35
2.10 Risk Modeling 36
2.10.1 Matrix Risk Models 36
2.10.2 Probabilistic Risk Models 39
2.10.3 Indexed-Based Risk Models 40
2.10.4 Real Options Models 40
2.11 Benefits of Risk Management 41
2.12 Failure of Ancillary Transportation Assets 42
2.13 Consequences of Failure 51
3 RISK-BENEFIT-COST ANALYSIS TO PRIORITIZE ANCILLARY TRANSPORTATION ASSETS FOR MANAGEMENT: CRITICAL
ELEMENTS 54
3.1 Risk Framework 54
3.2 Elements of Risk Framework 55
3.2.1 Identify Management Goals 55
3.2.2 Identify Risks 55
3.2.3 Analyze Risks 56
3.2.4 Assess Risks 56
3.2.5 Select Risk Targets/Standards 57
3.2.6 Adopt a Mitigation Strategy 58
3.2.7 Performance Measurement 58
3.3 Elements of Cost-Benefit Framework 59
4 APPLICATION OF RISK FRAMEWORK 63
4.1 Background 63
4.2 Evaluation of Asset Classes against Selected Performance Measures 66
4.4 Data Availability 69
5 SUMMARY AND CONCLUSION 72
5.1 Conclusion 72
5.2 Recommendations 74
5.3 Direction for Future Research 74
APPENDIX A: SAMPLE SURVEY FORM TO TRACK FAILURE DATA 76
LIST OF TABLES
Page
Table 2.1: Risk Assessments Methods 38
Table 2.2: Sample of Factors Affecting Performance of Assets 44
Table 2.3: Rated Elements of Retaining Walls 45
Table 2.4: Examples of Culverts Failures and Consequences in the United States 53
Table 3.1: Sample Risk Categories 57
Table 3.2: Categories of Risk Effects and Most Likely Consequences Resulting from
Non-Maintenance of Assets 57
Table 4.1: Risk Matrix 63
Table 4.2: Probability Scale 64
Table 4.3: Safety Risk Consequence Scale 65
Table 4.4: Mobility Risk Consequences Scale 65
Table 4.5: Maintenance Risk Consequence Scale 65
Table 4.6: Evaluation Data 67
Table 4.7: Risk Factor Description Scale 67
Table 4.8: Computational Selection Matrix 68
LIST OF FIGURES
Page
Figure 1.1: Example of Guardrail Asset 5
Figure 1.2: Example of Pavement Asset 6
Figure 1.3: Example of Sign Asset 7
Figure 1.4: Example of Lighting Asset 8
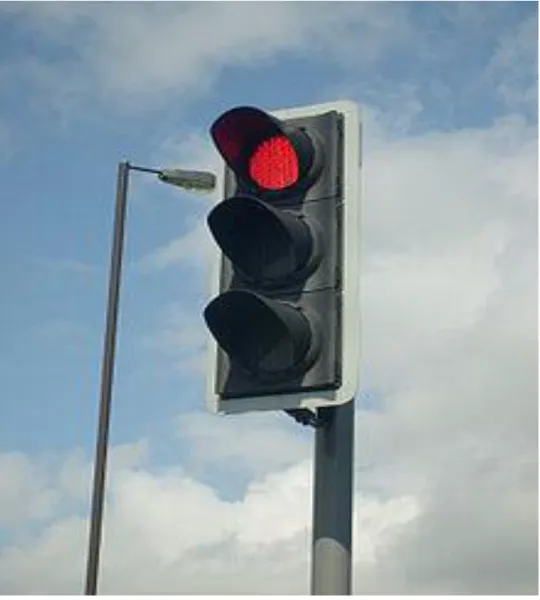
Figure 1.5: Example of Traffic Signal Asset 9
Figure 1.6: Benefits Obtained From various Resource-Allocation Levels 12
Figure 2.1: FHWA Overview of an Asset Management System 20
Figure 2.2: Transportation Asset Management: Resource Allocation and Utilization 21 Figure 2.3: Summary of Findings of Analytical Tools Used to Evaluate and Compare
Options 24
Figure 2.4: Integration of Essential Elements of Strategic Asset Management by the use
of Information Technology 26
Figure 2.5: IT Interactions Model in an Advanced Ancillary Transportation Asset
Management System 27
Figure 2.6: Complete Systems for Roadway Maintenance Organization 28
Figure 2.7: Screenshot from ODOT’s BADCS Mobile Devices 30
Figure 2.8: Screenshot of a Roadway Section of the SHA System 31
Figure 2.9: Sample Risk Matrix 39
Figure 2.10: Bakersfield, California Sinkhole 46
Figure 2.11: Owings Mills Mall Sinkhole in Baltimore, Maryland 47 Figure 2.12: Highway-40 Failure in 2005 between Montreal and Quebec City 48
Figure 2.13: Example of a Failing Road Sign 48
Figure 2.14: A Failed Cantilever Sign Structure 49
Figure 2.16: Damaged Guardrails 51 Figure 3.1: Conceptual Risk Framework for Decision Making 54 Figure 3.2: Conceptual Risk-Benefit-Cost Framework for Decision Making 55
LIST OF SYMBOLS AND ABBREVIATIONS
ſ Average Failure Rate
TAM Transportation Asset Management
AASHTO American Association of State Highway and Transportation Officials
GIS Geographic Information System
FHWA Federal Highway Administration
FY Fiscal Year
CAMG City Asset Managers Group
ODOT Oregon Department of Transportation
DfT Department for Transport
ERS Earth Retaining Structure
IHS Interstate Highway System
HAAFM Highways Agency’s Adaptation Framework Model
NCHRP National Cooperative Highway Research Program
DOT Departments of Transportation
IT Information Technology
GPS Global Positioning System
EAM Enterprise Asset Management
GPS Global Positioning System
BADCS Buckeye Asset Data Collection System
SHA State Highway Administration
FMEA Failure Mode and Effects Analysis
SUMMARY
A growing number of transportation agencies have begun to manage selected ancillary transportation assets systematically—culverts, guardrails, pavement markings, sidewalks and curbs, street lighting, traffic signals, traffic signs, utilities and manholes, earth retaining structures, and environmental mitigation features. Given budget
limitations, several agencies are interested in prioritizing these assets for inclusion in their existing management systems. To provide decision-support capabilities for this task, this study reviews information technology and analytical tools in asset management practices, the basics of risk theory, and examines risk applications in transportation asset management, water mains management, and storm water management. In addition, the study identifies the basic risk elements of a risk-benefit-cost framework for prioritizing ancillary transportation assets for management. These elements can be used as a basis for developing a decision analysis framework to properly make a business case for the
formal management of ancillary transportation assets and to prioritize them for inclusion in existing transportation asset management programs. Using these elements, a risk ranking model was developed that can be used by transportation officials to prioritize their ancillary asset classes for management. A demonstration of the model is presented to illustrate its effectiveness. The study concludes that in order to obtain useful data for the model, the different types of ancillary transportation assets failing on our roadways have to be monitored and data collected on asset failures and their consequences.
Therefore, this study recommends that agencies commit the necessary time and resources to gather information (e.g., asset failures and their consequences) and establish an
integrated database that would support appropriate risk analysis. Tracking and
documenting the failures of ancillary transportation assets would also help in identifying trends/probability of failure as well as quantifying the consequences associated with these failures. This tracked and documented information could be used to estimate appropriate risk factors (i.e., the risk of failure) and used in prioritizing individual asset classes for inclusion in existing management systems.
CHAPTER 1
INTRODUCTION
1.1 Background
A useful analytical tool in business practice over the past several decades, transportation asset management (TAM) has been applied to transportation investment decision making over the lifecycles of infrastructure facilities and systems [1, 2]. The American Association of State Highway and Transportation Officials (AASHTO) defines TAM as ―a strategic and systematic process of operating, maintaining, upgrading, and expanding physical assets effectively throughout their life cycle [3].‖ In the initial years of TAM, agencies tended to focus on pavement and bridge management [2]. Recently, however, various agencies have increasingly expanded their asset management activities to include the management of ancillary transportation assets such as pavement markings, sidewalks and curbs, street lighting, traffic signals, traffic signs, utilities and manholes, and earth retaining structures [4-6], with utilities and manholes being predominantly managed at the local level.
Such expansion of TAM activities requires additional funds for gathering and managing data, and in some cases developing analytical tools. Given that agencies usually have limited funds, ancillary assets will compete for formalized asset
management programs or activities. Making a business case for managing various assets can help agencies prioritize the management of the assets that yield the highest returns and minimize risks in the levels of service provided to system users (i.e., both in
performance and catastrophic failures). To help agencies prioritize the competing assets for formal management, this study reviews geographic information system (GIS) and risk
applications in TAM and then discusses the critical elements of a risk-benefit-cost framework. Finally, the study proposes a risk model that assesses the rates and consequences of failure and prioritizes these assets for formal management.
In recent years, the concept of risk, defined as the probability of failure and its consequence, [9] has been introduced into TAM [1, 7, 8]. Over the years, risk has been used as a basis for decision making in the nuclear power, environment, and food
industries. However, in the past several years, risk had been increasingly incorporated in the systematic management of transportation assets. In fact, the concept is being applied more broadly as a way to make better use of limited resources in providing adequate levels of service to the general public while showing accountability for the use of taxpayer dollars. An international and a domestic assessment of transportation asset management sponsored by the Federal Highway Administration (FHWA) and the
American Association of State Highway and Transportation Officials (AASHTO) in 2005 and 2007, respectively, identified a number of international agencies that have adopted some degree of risk assessment or risk management in some areas of their transportation asset management systems [7]. Both scans ascertained that risk assessment or risk management is most often used in scenario analysis processes [7, 10].
The literature shows that different agencies assess and manage risks using different methods [10]. For example, in FY 2008-09, the Financial Planning Department of the City of Portland requested that the City Asset Managers Group (CAMG)
incorporate a risk-based approach to address existing capital assets. Consequently, the City’s repair and renewal projects were prioritized based on their risk levels. Projects that had higher risk levels were given more attention in funding allocation [11]. A review
of the literature also reveals that risk has been applied to roadway maintenance and slope management. The Oregon Department of Transportation’s (ODOT) unstable slope management process uses a numeric score to categorize the risks associated with potential landslide locations [10]. High-risk locations are given priority and any risky situations are addressed. That is, the system manages and mitigates road conditions (e.g., landslides and rock falls) that contributed to 382 crashes between 1993 and 2003,
resulting in 154 injuries and 23 deaths [10]. The England Department for Transport (DfT) uses a scoring matrix approach to rank and prioritize roadway maintenance projects. The agency reviews the scoring process through management workshops involving stakeholders. In addition, it employs a software package known as SWEEP to perform a life-cycle treatment analysis over a 60-year time horizon [7]. These are a few of several applications of risk in decision making being used by various transportation agencies in the U.S. and internationally.
1.2 Ancillary Transportation Assets
In order to establish a risk management system, it is critical that an agency identify all their ancillary transportation assets. Such assets include culverts, pavement markings, earth retaining structures (ERS), sidewalks, mitigation features, guardrails, traffic signals, utilities, and manholes. State agencies tend to manage all of these assets with the exception of utilities and manholes, which tend to be managed at the local level. All these transportation assets work collectively to ensure the safe and efficient operation of a transportation network. Generally, most of these assets are referred to as roadway safety hardware. Therefore, it is logical to expect that managing these assets in a
systematic manner will improve safety conditions and functional characteristics. One way of improving these conditions and preserving this valuable stock of transportation infrastructure is to efficiently allocate limited resources. Indeed, identifying high-risk ancillary transportation assets and determining the appropriate mitigation strategies are ways of managing transportation infrastructure cost effectively. Examples of ancillary transportation assets —guardrail, lighting, pavement marking, signs, and traffic signals—are illustrated in the following Figures 1.1 through 1.5.
According to the Federal Highway Administration (FHWA), over 160 million sq. ft. of permanent earth retaining structures (ERSs) are constructed in the United States each year, and hundreds of millions of dollars are spent installing, repairing, upgrading, and replacing ancillary assets (safety hardware). The FHWA estimates that about 40 percent of these ERSs are on public projects [12]. However, these critical components of the surface transportation network are given less attention when it comes to their
management despite the important role they play in the geometric design of highway and bridge construction. In addition, other research has identified that most state departments of transportation allocate their safety hardware management program budgets according to expert opinion [4]. However, at the time of increasing highway travel demand, aging infrastructure, and declining/insufficient transportation funds, more systematic
approaches to managing ancillary transportation assets is crucial. Therefore, resource allocation for the management of ancillary structures must be aligned with the asset condition data, the asset risk of failure, and the agency’s management objectives.
1.3 Study Objectives and Outline
Making a business case for managing competing or complementary asset classes involves understanding the overall and marginal costs and benefits associated with introducing more formal management programs relative to the status quo of decision making. That is, we must understand the relative costs and benefits to be incurred and gained, respectively, by gathering data and introducing formal analytical methods that support decision making. Because of subjective uncertainty associated with limited knowledge of the assets and objective uncertainty associated with randomness in the
facilities and systems, a framework for properly making a good business case has to include the consideration of uncertainty. For example, in a set (X=1 ... n) -- where X is used to refer to distinctive asset classes and takes integer values from 1 to n, -- of n competing or cooperating discrete asset classes, the critical question to be answered in making a business case is which asset classes have the highest marginal benefit-cost ratio when data collection and other asset management functions such as performance
prediction and project prioritization are introduced. Figure 1.6 illustrates how the benefit-to-resource ratio can be computed in a deterministic scenario, as presented by Yeddanapudi [13].
Since deterministic scenario analysis does not account for uncertainty, a non-deterministic scenario analysis (i.e., scenario involving uncertainty) would have to be incorporated if this question is expanded to include the consideration of risk with the intent of identifying the asset classes that will result in the most significant risk reduction to the general public, when formal asset management activities are introduced. In order to address this consideration, this study reviews relevant literature on information technology (IT) and analytical tools in asset management practices, the basics of risk theory, and also examines risk applications in transportation asset management, water mains management, and storm water management. In addition, the study identifies the basic risk elements of a risk-benefit-cost framework for prioritizing ancillary
transportation assets for management. Transportation management and water management systems are presented here because they have a range of characteristics (e.g., lack of condition data, lack of resources for maintenance and rehabilitation, and a structure of network of elements) pertinent to the issue being considered. Subsequently,
a decision-support tool was developed using a risk matrix that can help decision makers prioritize alternatives based on their risk differentials. Finally, we demonstrate the model to validate its effectiveness and limitations and recommend steps necessary to improve the decision support capabilities of the proposed model.
Figure 1.6 Benefits Obtained From Various Resource-Allocation Levels [13]
1.4 Research Benefits
Agencies adopting the risk model proposed by this research as a decision-support tool for managing their transportation infrastructure systems would benefit in several ways. For one, this research can help transportation agencies effectively improve and monitor the performance of the transportation network based on their management objectives by identifying high-risk assets and mitigating the risks by prioritizing the identified assets for inclusion in existing asset management systems. In addition, the research can help transportation agencies reduce their potential risk of liability (i.e., social, environmental, financial, and political risks) by proactively identifying high-risk assets and mitigating the risks. The model proposed also offers a systematic procedure for ranking the risk posed by each asset, and aligning the consequence of failure with the
agency’s short- and long-term objectives. Finally, the research provides an alternative effective approach for transportation agencies to allocate and utilize limited
transportation resources in a cost-effective manner.
1.5 Thesis Organization
The remainder of this thesis is organized into the following chapters:
Chapter 2 presents the literature review, providing an overview of the application of risk in decision making, describing where the present effort is focused in risk decision making. The chapter also reviews transportation asset management with an overview of the different phases involved, some information technology systems available, and some analytical tools being used in decision making. In addition, this chapter reviews the basic concepts of risk and finally concludes with risk decision making for infrastructure systems.
Chapter 3 outlines two frameworks (i.e., a risk framework and a risk-benefit-cost framework), details all the components making up the frameworks, and discusses agency’s responsibilities in implementing the risk framework.
Chapter 4 reviews the proposed model, which is based on a risk matrix and discusses the procedure and practical issues in implementing the model. The model is demonstrated in this chapter to demonstrate its potential effectiveness. Chapter 5 presents the summary and conclusion of the research effort. Discussion of the research limitations and prospects for future research are also presented. Finally, recommendations are provided for future work.
CHAPTER 2
LITERATURE REVIEW
2.1 IntroductionRisk analysis has been employed over the years as a decision aid. Risk
applications for resource allocation and other functions can be found in transportation management, waste water management, and water mains management. In fact, several transportation agencies in the United States and around the world have acknowledged the merits of incorporating risk in their decision-making processes of budget allocation and project prioritization [12]. In addition, more and more transportation agencies are considering risk applications to enhance their TAM programs [7].
2.2 Scope of Previous Studies
The literature shows that risk analysis has been employed in various capacities for making decisions in transportation planning and transportation investment. For example, an earlier study developed a Leontief-based infrastructure input-output model to help account for the intraconnectedness within each critical infrastructure as well as the interconnectedness among them. The study generalized the linear input/output model into a generic risk model with the former as the first-order approximation (Haimes and Jaing 2001). A review of the literature also reveals another study (Cambridge
Systematics et al. 2009) that outlines a proposed approach that augments transportation agencies’ existing risk management activities with a process that helps assess risks resulting from the failure of interstate highway system (IHS) assets. The approach helps owners of the IHS to perform risk assessment for their IHS assets and any other assets
they define to be on their highest priority network. This risk assessment approach yields a set of priorities for risk mitigation.
In addition to these studies, Salgado et al. (2010) reviewed some approaches to developing a model based on expert opinion for critical infrastructure risks assessment and vulnerability analysis. The researchers addressed the challenges (i.e., obtaining estimates for the probabilities of the initiating events as well as obtaining values for the associated consequences) in performing quantitative risk assessment of very rare events by reviewing Dempster-Shafer and Fuzzy approaches to elicit expert opinions.
Furthermore, Parsons Brinckerhoff et al. (2009) developed the Highway Agency’s Adaptation Framework Model (HAAFM), which provides a seven-stage process that identifies activities that will be affected by a changing climate, determines associated risks and opportunities, and identifies preferred options in mitigating them. The researchers identified over 80 highway agency activities or vulnerabilities that may be affected by climate change. The study also found that over 60 percent of the risks associated with these vulnerabilities are expected to be materially affected by current predicted levels of climate change within their relevant asset life or activity time horizon. Another finding of the study by Parsons Brinckerhoff et al. is that the risk appraisal enabled vulnerabilities to be prioritized for attention based upon several criteria including their potential to disrupt the operation of the strategic road network.
FHWA (2005) outlines how Queensland, Australia assesses the risk (product of the probability of failure and the consequence of failure) posed by a bridge, using a program called Whichbridge. The program assigns numerical scores to bridges based on
factors such as condition of bridge components, environmental impacts, component materials, design standards and traffic volumes.
Li et al. (2009) also proposed an uncertainty-based methodology that incorporates certainty, risk, and uncertainty inherent in input factors such as highway agency cost, traffic growth rates, and discount rates used in the computation of highway project-level lifecycle benefit or cost. The methodology, therefore, addresses a limitation that existing project-level lifecycle cost analysis approaches encounter. The study found significant differences between scenarios with and without uncertainty considerations. As a result of the large data requirements, the application of the methodology could be limited to only state and large-scale local transportation agencies because of the amount and level of historical data they maintain.
Dicdican and Haimes’ (2004) study on highway infrastructure develops a systematic risk-based asset management methodology to manage the maintenance of highway infrastructure systems [38]. The decision-making methodology developed could enable the harmonization and coordination of actions of different units and levels in a hierarchical organization. The framework uses a multiobjective decision tree for analysis to validate the tradeoffs between long-term and short-term costs, applying the concept of remaining life to distinguish actions in the present from those in the future. The
systemic methodology also enables organizations to prioritize assets for maintenance while addressing the potential for extreme events. The costs, benefits, and risks of maintenance and inspection policies are balanced by the methodology and applied to the various types of assets. The methodology suggested by this paper adopts three objective functions in the options and strategies evaluation process: minimizing short-term cost, minimizing long-term cost, and maximizing the remaining service life of highway assets. The researchers used a constraint function, which enables the method to eliminate
infeasible options by coordinating the remaining service life across assets. The
methodology is not only applicable to highway infrastructure systems, but it can also be applied to the management of large-scale dynamic systems that exhibit similar
characteristics as those of highway systems.
Other studies have also shown that risk has been used as a decision-support tool for investment planning for infrastructure management other than transportation assets. One example of such studies is in the storm water management in which Kannapiran used risk to consider infrastructure decision making. Kannapiran points out in his study on the strategic management of storm water assets that a statistical or conventional
mathematical modeling approach has been found impractical for assessment of
deteriorating infrastructure [39]. The study suggests the use of fuzzy-based risk models because they are more suitable as they link engineering judgment, experience and scarce field data of the deteriorating assets. Kannapiran draws a representative network of a buried storm water system’s data and derives a pipe condition index by linking the field data and reasoning using a fuzzy approach. The result of the study implies that the fuzzy approach can be useful and relevant for asset maintenance and development projects.
In addition, in water main management, Fares and Zayed use a hierarchical fuzzy expert system to assess the risk of failure of water mains. This paper states that there are 700 water main breaks per day in Canada and the United States, costing more than CAD 6 billion since 2000 [30]. It defines risk of failure as the combination of probability and impact severity of a particular circumstance that negatively impacts the ability of infrastructure assets to meet municipal objectives. The study proposes a framework to evaluate the risk associated with the failure of a water main using a hierarchical fuzzy expert system (HFES). The model considers 16 risk-of-failure factors within four main categories which represent both the probability and the negative consequences of failure. It establishes a strong correlation between pipe age and risk of failure followed by pipe
negative consequence of a failure event. Finally, a pilot project was implemented to examine the methodology. This project suggested that a percentage (~8%) of the network’s pipelines is risky and requires mitigation actions in the short term.
The review of the literature found a significant number of studies that show a vertical (i.e., within a group of assets) risk optimization process. In fact, very little research was found in which risk management was employed as a horizontal (i.e., across different asset classes) decision-support tool for asset prioritization.
In essence, the literature review revealed that some degree of risk management is being used in infrastructure decision making to prioritize risky alternatives. However, most of the studies have focused on a project-level analysis of risk in decision making, rather than a program-level addressing tradeoffs across different asset classes and decision-making objectives.
2.2 Asset Management
Asset management concepts are adopted by asset managers to minimize the total cost of designing, acquiring, operating, maintaining, replacing, and disposing capital transportation assets over their useful lives while accomplishing the desired levels of service. The main impetuses to the development of formal asset management programs are demand for increased financial accountability for the publicly-owned assets, aging infrastructure, and growing need for better utilization of limited or declining
transportation resources. The AASHTO definition of TAM focuses on a Department of Transportation business process for resource allocation and utilization with the objective of better decision making based upon quality information and well-defined objectives [2]. Figure 2.1 illustrates the FHWA overview of transportation asset management as outlined
in the ―Asset Management Primer‖ report. Another framework shown in Figure 2.2 is adopted from Volume 1 of the AASHTO Transportation Asset Management Guide (NCHRP, 2002). The framework illustrates resource allocation and utilization process in asset management. The flexibility of the framework presented in Figure 2.1 allows for modifications that meet the needs of organizations with dissimilar policy, institutional, organizational, technological, and financial settings [2].
Figure 2.2 Transportation Asset Management: Resource Allocation and Utilization [2]
With factors such as aging infrastructures, increasing maintenance and
replacement costs, and limited funds, transportation agencies are seeking more proactive and efficient ways to manage their assets. Asset management, therefore, presents a tool that facilitates an agency’s decisions in resource allocation and utilization in managing its transportation infrastructure [2]. Indeed, an asset management tool allows an agency to base its decision methods and criteria on current policy guidelines. In addition, asset
management tools enable asset managers to consider a range of alternatives while they focus on the outcomes of decisions and applying more objective information to decisions. Several examples of asset management tools were identified by the international review performed by United States transportation professionals in Sweden, Australia, New Zealand, and the United Kingdom in 2005 [7]. Asset management, which is a system-based decision-support tool, is also identified as a way of doing business through the incorporation into every aspect of the transportation agency, including planning,
engineering, finance, programming, construction, maintenance, and information systems [2]. Therefore, at a time of declining/insufficient resources, these system-based
management practices can help agencies make informed decisions and also provide the federal, state and local governments and the general public with convenient, safe, and a reliable transportation network.
An effective asset management system entails three main principles [2]. For one, it is strategic, focusing on asset performance and cost and aligning with the policy goals and objectives of an agency. This principle cuts across the other two principles of asset management; analysis and decision-making. Asset management requires complete, current, and accurate information on the transportation infrastructure and strong
analytical capabilities, suggesting that asset managers should employ the suitable level of information collection capabilities. Finally, as a business process, asset management entails tradeoff analyses across competing alternatives together with organizational goals, policies, budget, and asset performance. Thus, through the elicitation of expert
knowledge and engineering judgment, all levels of the organization contribute to
effective communication that addresses the needs of asset management. In addition, with this information in hand, asset managers could make resource allocation decisions while monitoring and evaluating the system in order to make adjustments or changes with the
aim of attaining set performance targets and achieving organizational goals. These processes facilitate an effective asset management program that enables transportation agencies to build, preserve, operate, and improve the performance of their facilities more cost-effectively, make the best use of limited resources, enhance their credibility and accountability, and contribute to the long-term economic vitality of the nation.
2.3 Analytical Tools
The literature reveals that diverse analytical tools have been used by transportation agencies to improve highway network preservation and investment
planning, as approaches, in enhancing the decision-making process in asset management. Figure 2.3 summarizes the findings of a survey of ten DOTs, conducted in 2002,under the auspices of the National Cooperative Highway Research Program (NCHRP) [15]. The Figure illustrates the predominate use of pavement management tool among the ten states. Following the pavement management analysis tool are benefit-cost and safety analysis tools. In addition, lifecycle cost analysis is the least used tool among the surveyed agencies. Many of these model-based tools for asset management focus on cost-effectiveness analyses, prioritization, and optimization methods. Others also focus on the selection of rehabilitation strategies, prediction models, and performance
measures. However, little research has been done on the development of optimization tools for prioritizing different categories of ancillary transportation assets for inclusion in existing transportation asset management systems. In addition, the existing analytical tools are not being utilized to their full potential. These limitations may have hindered transportation agencies wishing to improve their asset management systems.
Figure 2.3 Summary of findings of Analytical tools used to Evaluate and Compare Options [15]
To help state DOTs and other transportation agencies identify, evaluate, and recommend investment decisions for managing their infrastructure assets, NCHRP 20-57 proposed two field-tested analytical tools: AssetManager NT and AssetManager PT [16]. AssetManager NT analyzes investments and their associated performance (i.e., tradeoff analyses) across infrastructure categories in the highway mode over a 10- to 20-year horizon. AssetManager PT focuses on the impact of investment choices on a short-term program of projects.
2.4 Information Technology
Among the myriad challenges to implementing asset management within an organization is gathering and managing the required data (i.e., gathering and organizing
detailed inventory and attribute data on assets). Implementing an integrated information and systems framework based on industry best practices and standards is an effective way to support the exchange and the integration of information across business units within a transportation organization. Increasing the efficiency of automated data processing and data reporting by employing information technology (IT) complements an agency process of making decisions in asset management. Over the years, various sophisticated
analytical tools, techniques, and IT systems that support a comprehensive, fully integrated asset management system have been developed with the advent of more powerful computer systems [17]. These technologies enable transportation officials to effectively communicate with decision makers through ―what if‖ queries (i.e., officials can analyze the effect of varying budget levels on system condition and performance, and on users) [17].
IT plays two major roles in asset management: collection, storage, and the analysis of data; and the presentation and communication of the analysis results to decision makers inside and outside the agency [17]. Figure 2.4 illustrates how IT
integrates the essential elements of strategic asset management. In recent years, IT usage has enhanced the rate of data collection with higher quality and spatial accuracy. The development of powerful data servers and software such as geographic information systems (GIS) and global positioning systems (GPS) facilitate data storage, data retrieval, and data analysis. The second major role of IT in asset management is accomplished through a network of computers within the transportation agency and those of all other stakeholders. Computer networking helps with the distribution of information and the
results of any analyses undertaken by analysts. These results are then graphically presented to the decision makers using advanced multimedia capabilities.
Figure 2 .4 Integration of Essential Elements of Strategic Asset Management by the use of Information Technology [17]
Figure 2.5 illustrates a proposed IT interaction model in an advanced high-quantity, low-cost, or ancillary transportation asset management system developed by Rasdorf et al. [18]. In their model, the source of data is field data collection, automated sensors, and existing data (examples of existing data are legacy and historical data). These data sources are primarily used to populate either inventory and/or condition assessment databases. The paper also identified several IT challenges that arise with respect to collecting, managing, and analyzing asset data. The challenges include asset identification, asset location, data availability, data fragmentation, and unsuccessful data
collection automation. Their model is regarded as an advanced asset management system because it is capable of modeling system performance [18]. In addition to the challenges outlined by the authors, another challenge that should be managed or addressed is the likelihood of data errors. The significance of data error in asset management contributes to the effectiveness of recommendations suggested by an analytical tool.
Figure 2.5 IT Interactions Model in an Advanced Ancillary Transportation Asset Management System [18]
2.5 Geographic Information System
data for capturing, managing, analyzing, and displaying all forms of geographically referenced information. Figure 2.6 illustrates a complete GIS for organizing roadway maintenance proposed by the Environmental Systems Research Institute (ESRI). Transportation agencies can track, locate, and manage the transportation assets through the use of a GIS-based enterprise asset management (EAM), which offers a user-friendly environment. Through the use of GIS technology, transportation asset managers can view, query, and understand data in many ways.
Figure 2.6 Complete Systems for Roadway Maintenance Organization [49] Using GIS as a tool in managing transportation infrastructure assets offers
numerous benefits. For one, the processes of making informed decisions and prioritizing projects are enhanced by the visualization of competing assets and the surrounding
environment. Another benefit is the unique ability of GIS to integrate with a wide gamut of technologies facilitating data integration and decision making. In addition, a GIS-based asset management system can efficiently schedule activities (e.g., asset upgrade or repair) and track work tasks, personnel, equipment, and material usage. In reality, most DOTs report only limited success in both using good asset management practices and incorporating GIS into their asset management practices [19]. However, other DOTs have made positive advances in the use of GIS for asset management. For example, the Ohio Department of Transportation (ODOT) has developed several state-of-the-art GIS standards and geospatial applications to help allocate resources [20]. One such
application developed by the ODOT is the Buckeye Asset Data Collection System (BADCS), a web-based video application capable of collecting large-scale asset inventories on ODOT roadways more efficiently.
The BADCS also includes a mobile asset management application capable of operating on any Windows mobile device with GPS capability, ensuring that data is updated as it is being changed in the field. The combination of all these systems has aided ODOT to achieve and surpass its business goals. In fact, the agency was able to collect data on tens of thousands of assets valued at millions of dollars in less than three months [20]. Figure 2.7 illustrates screenshots from a mobile device. The BADCS is currently being utilized by ODOT Districts 1 and 2.
Figure 2.7 Screenshot from ODOT’s BADCS Mobile Devices [20]
Another DOT that has effectively utilized GIS in their asset management process is the Maryland State Highway Administration (SHA). The SHA uses GIS to accurately track and efficiently manage sidewalks along all state routes and highways to ensure that they comply with the Americans with Disability Act (ADA) [21]. The system has
improved SHA business processes by making fast and accurate sidewalk data available to decision makers. Indeed, over a period of eight months, the SHA collected data on sidewalks along state routes and highways (nearly 900 miles) [21]. The application system has not only enabled SHA to measure its performance in improving facilities, but also guided the sidewalk improvement program so that it focuses on improvements in which the need is most significant and uses funding for the greatest benefit. For example,
the GIS-based system helped SHA identify areas with high pedestrian traffic. Data on pedestrian volumes and pedestrian accidents are utilized in the GIS and this improves the prioritization of sidewalk improvement projects. The interactive nature of the GIS enables users to view SHA videos of sections of roadways and to assess the condition of sidewalks and their attributes, whether the sidewalks are ADA compliant or not. Figure 2.8 shows a screenshot of a roadway section of the SHA system.
Figure 2.8 Screenshot of a Roadway Section of the SHA System [21]
2.6 Risk and Uncertainty
All these technological systems can be made more useful in asset management if they incorporate the risk and uncertainty pertaining to the physical assets. The potential for negative events and consequences constitute opportunities for risk. In the context of safety, risk is viewed as a negative consequence. Thus, the focus of risk management is to mitigate the negative consequences. Risk can be defined in various ways depending
on context. Despite the variations in all the definitions, they all acknowledge two main characteristics related to uncertainty and consequences. The Webster’s Collegiate
Dictionary defines risk as the chance of loss, the degree of probability of loss, the amount of possible loss, or the type of loss that an insurance policy covers [13]. In the literature, the definition of risk usually makes reference to an uncertain cause that results in some sort of damage to an existing entity. This uncertain cause is usually referred to as a risk event. In the context of technical risk event analysis, a numerical value is assigned to the risk [9]. This value is obtained by multiplying the probability of the risk event by the consequence of the event. However, the formulation of risk in this form for decision making fails to incorporate the societal dimensions of risk (i.e., the political and ethical dimension of risk are not taken into account) [9]. In the decision-making process, risk assessment is defined as a systematic process that incorporates the evaluation of
uncertainties, the development of policies, and the possible consequences of such policies [14].
Uncertainty rises as a result of sparse data availability and incomplete knowledge in the decision-making process [15]. Uncertainty also exists as a result of the inherent randomness associated with systems and events [16]. Uncertainty can, therefore, be attributed to three different types of errors in risk-based decision making for
infrastructure: data errors, modeling errors, and forecasting errors. Amekudzi and McNeil, for example, demonstrate the impact of data and model uncertainties associated with highway investment needs analysis [17]. That is, how do these uncertainties impact the optimal solution? Other studies have also shown how optimal maintenance programs can be impacted significantly with small adjustment to their input parameters [18]. In
fact, the level of confidence in the decisions made from the use of these outputs depends on how accurate the input data is. Although these errors could be reduced through the use of statistical models, it must be noted that the extent of reduction of these errors is limited [15]. Pate-Cornell discusses when and why a full uncertainty analysis is justified because of the complexity and cost involved [19]. However, the process of reducing uncertainty helps to represent risks with increasing levels of confidence.
2.7 Likelihoods and Consequences
As mentioned above, risk is measured in terms of likelihoods and consequences. The probability of occurrence of some future event can sometimes be calculated precisely with no uncertainty. Other rare future events, however, are forecasted or predicted with a considerable amount of uncertainty. This level of uncertainty inherent in the forecasting process gives rise to risk. Kaplan and Garrick define risk to be a set of scenarios, si, each with probability pi and consequence xi. If the scenarios are ordered in terms of the increasing severity of the consequences, then a risk curve can be plotted [20]. Another refined notion of risk by Kaplan and Garrick talks about the frequency with which an event might take place instead of using the probability of occurrence of the event. In this context, they introduce the notion of an uncertainty about the frequency with which the event will occur (i.e., the ―probability of a frequency‖) [20].
One challenging factor in measuring risk is the inability to precisely quantify all resulting consequences. Despite the fact that the cost of replacement or repair, or the maintenance cost of some assets may be easily quantified and incorporated in the consequences quantification process, other costs such as societal costs may be very difficult to estimate. To help agencies understand the consequences associated with the failures as they occur, agencies need to accurately track asset failures. Again, accurate
these assets. Both of these factors would facilitate the risk categorization process. An agency that tracks the condition of its ancillary assets and implements strategic management actions is likely to benefit from the reduction/elimination of unexpected failure of these assets as well as saving on emergency repairs resulting from the unexpected failures.
2.8 Types of Risks
The consequence of a risk occurrence differs depending on the type of failure an asset experiences. Ancillary transportation assets are subjected to numerous types of failure that can be grouped under various categories. The two types of failure under consideration in this paper are catastrophic and non-catastrophic (performance) failures, which result in two types of risk. One is catastrophic risk, which results when a
catastrophic failure occurs. Catastrophic failures are failures that are caused by the occurrence of extreme events which are defined as having a low likelihood of occurrence, but with catastrophic results [27]. Examples of such events are earthquakes, hurricanes, and floods. Therefore, the probability of occurrence and the consequences of such failures are termed catastrophic risk. An example of a catastrophic failure is the collapse of a section of the retaining wall in hilly northern Manhattan onto the Henry Hudson Parkway in 2005, sending tons of dirt, rocks, and trees onto the roadway, stopping traffic for miles around, and leading to the evacuation of nearby buildings [28]. The other type of risk is non-catastrophic risk, which results from the occurrence of non-catastrophic or performance failures. This type of failure is caused by the inability of an asset to
properly offer the service for which it was built. Any reduction in operational
performance below the minimal level of service is referred to as a performance failure. Thus, the probability of occurrence and the consequence of such failures can be termed non-catastrophic or performance risks.
2.9 Risk Assessment and Risk Management
The risks associated with the failure of ancillary transportation assets can be managed effectively only if they are assessed correctly. The meaning of the term
management may vary in many ways depending on the discipline and/or context in which it is being used [41]. Risk assessment and risk management, which remain essential components of any asset management process [34], are two distinctive processes; however, the term risk management is sometimes used to describe both the risk
assessment and risk management processes [42]. Risk assessment refers to the scientific process of measuring risks in a quantitative and practical manner. Kaplan and Garrick describe the risk assessment process as an attempt to answer a set of three questions: What can go wrong, what is the likelihood that it would go wrong, and what are the consequences? [29]. Through these three questions, the inherent risks are identified, measured, quantified, and evaluated, and subsequently, their consequences and impacts established. Effectively, the risk assessment process objectively accomplishes an assessment to foresee negative effects or risks so that adverse consequences can be minimized [24]. The assessment process identifies a single event or a sequence of events that can lead to these adverse consequences. These single events or sequences of events are called scenarios. Examples of such events could be the failure of a traffic signal, the failure of a pavement marking, the failure of a sign, or the failure of a culvert. Any of these events could lead to consequences: higher costs of repair, reduction in network mobility, or delay in travel time. The risk assessment process is dependent on the views, the knowledge, and the experience of individuals or experts.
Unlike risk assessment, risk management is a qualitative process that involves the selection and implementation of a risk mitigation strategy that alleviates or accepts the specific risk under consideration [23]. Risk management, which focuses on addressing uncertainties in a proactive manner in order to minimize threats, maximize opportunities,
infrastructure preservation tasks. In addition, the risk management process also attempts to answer three main questions [42]: What are the available options, what are the
associated trade-offs, and what are the impacts of current decisions on future options? These questions build up from the risk assessment process. The last question, which evaluates the impacts of current decisions on future options, is the most critical of all the three questions for managerial decision making [41]. In order to believe that the decision made is optimal or reflects the desired tradeoffs of decision makers and their
stakeholders, policy makers would have to ascertain that they have reasonably optimized the benefits of current decisions with respect to future options. This is achieved by weighing the negative and the positive effects of current decisions on future decisions. In the context of transportation asset management, AASHTO defines risk management as ―a process of identifying sources of risk, evaluating them, and integrating mitigation actions and strategies into routine business functions of the agency‖ [1].
2.10 Risk Modeling
The risk inherent in any situation can effectively be managed if it is better understood. Risk modeling can follow two approaches: quantitative and qualitative assessments. The quantitative risk assessment approach quantifies the likelihood
(probability) and outcomes (consequences) of a future negative event (e.g., the failure of a transportation asset) and multiplies them to obtain the risk of the event. As an
illustration, consider n potential consequences resulting from n potential likelihoods of future events. Then, risk can be defined quantitatively as a collection of n pairs.
Risk= {(Li,O1),………, (Ln,On)},
where Oi and Li denote the consequences (i.e., outcomes) of i and its likelihood, respectively.
An example of an analysis tool used in quantitative risk analysis is Monte Carlo Simulation. Other methods such as fault tree analysis, Bayesian inference, and fuzzy arithmetic can also be used to quantify risk.
In contrast to quantitative risk analysis, qualitative risk analysis employs a set of standard parameters: severity, impact, and mitigation. In this approach, the probability of an event may be unknown, not agreed upon, or not recognized to have any consequence [30]. Examples of such approaches used in qualitative risk analysis are fuzzy theory, failure mode and effects analysis (FMEA), and preliminary risk/hazard analysis [31]. In fact, a list of examples of risk assessments methods is presented in Table 2.1.
Qualitative risk assessment also assigns relative values for measures of risk based on ranking or separation into descriptive categories such as low, medium, high; not
important, important, and very important; or other ordinal scales such as a scale from 1 to 10. Three types of risk models for risk assessment—matrix, probabilistic, and index models—are outlined by Muhlbaurer [32]. Another model enjoying increased applications is the Real Options model. These models are discussed in some detail below.
Table 2.1: Risk Assessment Methods [48]
Method Scope
Safety/Review Audit
Identifies equipment conditions or operating procedures that could lead to a casualty or results in property damage or environmental impacts.
Checklist Ensures that organizations are complying with standard practices. What-If Identifies hazards, hazardous situations, or specific accident events that
could result in undesirable consequences. Hazard and
Operability Study (HAZOP)
Identifies system deviations and their causes that can lead to
undesirable consequences and determine recommendation actions to reduce the frequency and/or consequences of the deviations
Preliminary Hazard Analysis (PrHA)
Identifies and prioritizes hazards leading to undesirable consequences early in the life of a system. It determines recommended actions to reduce the frequency and/or consequences of the prioritized hazards. This is an inductive modeling approach.
Probabilistic Risk Analysis (PRA)
Quantifies risk, and was developed by the nuclear engineering
community for risk assessment. This comprehensive process may use a combination of risk assessment methods.
Failure Modes and Effects Analysis
(FMEA)
Identifies the equipment failure modes and the impacts on the
surrounding components and the system. This is an inductive modeling approach.
Fault Tree Analysis (FTA)
Identifies combinations of equipment failures and human errors that can result in an accident. This is a deductive modeling approach. Event Tree Analysis
(ETA)
Identifies various sequences of events, both failures and successes that can lead to an accident. This is an inductive modeling approach.
The Delphi Technique
Assists experts to reach consensus on a subject such as project risk while maintaining anonymity by soliciting ideas about the important project risk that are collected and circulated to the experts for further comments. Consensus on the main project risks may be reached in a few rounds of this process.
Interviewing
Identifies risk events by interviews of experienced project managers or subject-matter experts. The interviewees identify risk events based experience and project information.
Experienced-Based Identification
Identifies risk events based on experience including implicit assumptions.
Brain Storming Identifies risk events using facilitated sessions with stakeholders, project team members, and infrastructure support staff.
2.10.1 Matrix Models
One of the simplest modeling methods used in risk assessment is the matrix model. The matrix model, as the name suggests, assess risk categories using a risk matrix, which is a two-dimensional presentation of likelihood and consequences using qualitative metrics for both dimensions, with each (probability and consequence) assessed as low, medium, or high. A matrix model can sometimes rank a risk event by assigning simple numerical scales to the likelihood and consequences of the event (e.g., the scale of zero to five mapped to ―not likely‖ to ―most likely,‖ respectively). This approach of risk ranking requires the elicitation of expert opinions. Figure 2.9 illustrates a sample risk matrix defining the various risk severity zones depending on the likelihood and consequence of the event.
Figure 2.9 Sample Risk Matrix
2.10.2 Probabilistic Risk Models
Another modeling approach usually employed in risk assessment is probabilistic risk analysis (PRA) through which an initiating event is transformed into a risk profile by adopting a systematic approach [33]. PRA exhibits a superior predictive ability amongst all the other risk models. This superior characteristic is attributed to the fact that this
model relies heavily on historic failure data and event/fault-tree analysis, making it highly data driven [32].
2.10.3 Indexed-Based Risk Models
The indexed-based risk model is also used in risk assessment. The indexing method of modeling depends on either statistical or engineering judgment. This method assigns relative weights to the individual components of the asset that contribute to the risk event, depending on how much influence the components have on the failure of the asset. In this case, the risk of failure of an asset is based on the probability, or likelihood, of failure of the individual components that contribute to the overall probability of failure [32].
2.10.4 Real Options Models
Risk assessment methodologies have evolved over the years, giving rise to the emergence of one assessment tool known as the real options model, which has been applied to analyze risk in the transportation management process [34]. The Real Options approach is one that captures the investor’s flexibility to optimize the timing of his or her investment. Real Options methodology considers investments in assets as options (i.e., permits with different values at different time periods to undertake some business decision). The Real Options model offers a nuanced approach to strategic investment that considers the value of opened options for budget decision makers [35]. The approach involves developing estimates of the benefits from an investment project and discounting them to their present value at the discount rate that reflects the market price of the risky project.
2.11 Benefits of Risk Management
Adopting risk as a management decision-support tool for transportation infrastructure systems offers several benefits. For one, prioritizing the inclusion of ancillary transportation assets into existing asset management systems by using risk management enables transportation agencies to better balance limited funds to provide adequate levels of service for their customers. In addition, risk management facilitates the efficient allocation of limited transportation resources. Resources are often directed to the highest-risk assets after the agency evaluates their associated risks. That is, within an asset class, risk management can be used to optimize the ―return-on-investment‖ of competing assets for a single objective analysis. However, in the case of multi-objective analysis, it is challenging for agencies to achieve this goal. In situations in which
different objectives are under consideration, one may have to perform trade-off analyses and not focus solely on optimizing the ―return-on-investment.‖ The effective mitigation of such risk leads to the reduction of the likelihood of risk events. Reduction of event likelihood in turn translates into reduced failures. In addition, effective risk mitigation strategies also lessen the consequences associated with the failure of an asset.
Another benefit of risk management is that it can enable asset managers make a better case to decision makers for resources. By quantifying or assessing the probability of failure and consequence of failure of an asset, that is, estimating the risk of failure, asset managers are able to justify why more resources should be made available to manage such failing assets. In addition, responses to situations are made quicker in the event of a failure. Knowing the magnitude of the risks associated with the failure of an asset, agencies are able to put in place strategic response procedures for any envisioned failure. This benefit is much more critical for catastrophic failures. This is because the probabilities of such failures are difficult to quantify, and if they occur, they should be
2.12 Failure of Ancillary Transportation Assets
Before the risk of failure of an ancillary transportation asset is addressed, it is essential to understand why and how these assets fail. There are many ways in which a transportation asset can fail. All else being equal, transportation assets usually fail as a result of lack of effective and timely maintenance, repair, or rehabilitation. Undertaking these activities to preserve and to prolong the service life of the transportation system assets is a complex, large-scale activity that is not only affected, but is also influenced, by many elements [29]. As noted earlier, the failures experienced by ancillary transportation assets can be classified into two main categories: catastrophic failure and
non-catastrophic or performance failure. While non-catastrophic failures tend to be rare, performance failures, in contrast, are very common. There are many causes of performance failure for any given class of assets. Table 2.2 shows some examples of elements that should be rated to assess the performance of an ancillary transportation asset. In fact, Table 2.3 illustrates the FHWA and the National Park Services (NPS) checklist of elements for the performance of ERSs in their Retaining Wall Inventory Field Guide (WIFG) based on the wall structural type.
Many ancillary transportation assets have experienced various types of catastrophic failures. In 2006, Perrin conducted a study to review some examples of failed culverts in the United States [46]. Parts of the survey questionnaire sent to transportation agencies in the United State queried for documentation on any failures during the past 10 years, and the agencies’ current procedure for documenting culvert failures. The study further obtained more specific information from agencies that had documented failures within their jurisdiction within the past 10 years. Examples of such specific information includes: location, duration of repair, and culvert details and the costs involved in repairing or replacing the culvert. The study also presented a few examples of culvert failures, as illustrated by Figures 2.10 to 2.12. In addition to the
failed culverts, Figures 2.13 and 2.14 illustrate some examples of failed signs, and Figure 2.15 is an illustration of a failed ERS.
Table 2.2: Sample of Factors Affecting Performance of Assets
Asset Category ID
Year Built
Static Data
(Long/Lat) LOCATION Condition Element Culvert Corrugated Pipe Across Freeway Cracking Corrosion Infiltration Distortion or Deflection Surface Settlement Lighting Steel
Support Arterial Pole Condition
Lens Condition
Bulb Condition
Pavement
Marking Tape Retro Reflectivity
Solvent Base Cracking
Epoflex Night Visibility
Day Visibility
Marking Thickness
Bead Density
Uniformity
Traffic Signals Corrosion
Truss Seat
Base Plate
Anchor Rod
Pole to Base Plate Connection
Mast Arm to Pole Connection Luminaries ERS Deformation Settlements Panel Condition Drainage Reinforcement Metal Loss Guardrail Splice Connections Condition Post Condition Rail Condition Blockout Condition
Figure 2.12 Highway-40 Failure in 2005 between Montreal and Quebec City [46]
Figure 2.15 Failed Earth Returning Structure along Riverside Drive near Manhattan in New York [37]
Figure 2.16 Damaged Guardrails [50]
2.13 Consequences of Failure
Consequences arise as a result of the failure of ancillary transportation asset. The consequences of failure of ancillary transportation assets may be defined as any negative loss or impact, directly or indirectly, experienced as a result of the failure of the asset. Two main categories of consequences can be classified: agency consequences and user consequences. User consequences are classified as the losses experienced by the system users, while the loss of failure experienced by the agency is said to be the agency’s experienced consequence. Again, the consequences of failure can be classified as direct or indirect consequences. Direct consequences resulting from the failure of an asset include replacement cost, repair cost, environmental degradation cost, and remediation costs of which are considered consequences associated with the agency, and fatalities, bodily injuries, delay, and property damages are considered consequences associated with the user. In contrast, litigation, political reactions, dissatisfaction of customers, fines, and
penalties constitute indirect consequences [32]. As an illustration, the 2006 study by Perrin mentioned above outlines some consequences of failure surrounding culverts [46]. Table 2.4 outlines a few catastrophic failures of culverts within the United States and their associated consequences as documented by Perrin. The study concludes that most of these failing culverts were corrugated metal pipes, which had reached their life expectancy age, but with no systematic replacement plan in place to replace them [46]. Other consequences resulting from the failure of ancillary transportation assets have also been documented in the literature. For one, the Palm Beach Post in Lake Worth, FL, reported that one person died while three other people sustained various degrees of injuries in 2010, after they were in a traffic accident that involved 3 vehicles at an intersection with a malfunctioning/failed traffic light [52]. In addition, the County of Camden, New Jersey was found liable for a car accident in which a driver crashed through a guardrail that county officials knew was faulty. The teen driver ended up having his left leg amputated and a jury awarded him a record $31 million in damages [53].
![Figure 1.2 Pavement Marking Asset [16]](https://thumb-us.123doks.com/thumbv2/123dok_us/712650.2588748/18.918.165.832.191.725/figure-pavement-marking-asset.webp)
![Figure 1.6 Benefits Obtained From Various Resource-Allocation Levels [13]](https://thumb-us.123doks.com/thumbv2/123dok_us/712650.2588748/24.918.218.820.282.595/figure-benefits-obtained-various-resource-allocation-levels.webp)
![Figure 2.1 FHWA Overview of an Asset Management System [15]](https://thumb-us.123doks.com/thumbv2/123dok_us/712650.2588748/32.918.176.827.131.791/figure-fhwa-overview-asset-management.webp)
![Figure 2.2 Transportation Asset Management: Resource Allocation and Utilization [2]](https://thumb-us.123doks.com/thumbv2/123dok_us/712650.2588748/33.918.177.827.113.735/figure-transportation-asset-management-resource-allocation-utilization.webp)
![Figure 2.3 Summary of findings of Analytical tools used to Evaluate and Compare Options [15]](https://thumb-us.123doks.com/thumbv2/123dok_us/712650.2588748/36.918.161.816.105.553/figure-summary-findings-analytical-tools-evaluate-compare-options.webp)
![Figure 2 .4 Integration of Essential Elements of Strategic Asset Management by the use of Information Technology [17]](https://thumb-us.123doks.com/thumbv2/123dok_us/712650.2588748/38.918.182.718.200.638/figure-integration-essential-elements-strategic-management-information-technology.webp)
![Figure 2.5 IT Interactions Model in an Advanced Ancillary Transportation Asset Management System [18]](https://thumb-us.123doks.com/thumbv2/123dok_us/712650.2588748/39.918.194.763.339.854/figure-interactions-model-advanced-ancillary-transportation-asset-management.webp)
![Figure 2.6 Complete Systems for Roadway Maintenance Organization [49]](https://thumb-us.123doks.com/thumbv2/123dok_us/712650.2588748/40.918.167.809.421.938/figure-complete-systems-roadway-maintenance-organization.webp)
![Figure 2.7 Screenshot from ODOT’s BADCS Mobile Devices [20]](https://thumb-us.123doks.com/thumbv2/123dok_us/712650.2588748/42.918.167.807.103.581/figure-screenshot-odot-s-badcs-mobile-devices.webp)