with PDot in an E-Learning Context
Matthias Heintz, Effie Lai-Chong Law
University of Leicester,University Road, Leicester, LE1 7RH, United Kingdom [email protected], [email protected]
Abstract. This paper presents the requirements engineering work conducted in the Go-Lab project, which aims to improve science education by enabling teachers to deploy online labs and scaffolding apps to enrich the traditional classroom-based teaching and learning. We tackled the challenge of developing a Participatory Design approach to address the specific arrangement of the project where the initial user-based requirements engineering process and the technical implementation process were launched at about the same time instead of running the two processes one after the other. To support the PD activities, PDot, an online tool to gather user requirements and feedback, has been developed. In this paper, we present the design of PDot together with preliminary usability and User Experience evaluation results and future development plans. By presenting our challenges and approaches we aim to stimulate discussions about our proposed solution and possible improvements and to inspire other research projects with similar setups.
1
Introduction
The Go-Lab (Global Online Science Labs Inquiry Learning at School) project1 is
a European initiative to support science teaching by enabling teachers to incorporate online resources in science lessons [2], especially online labs and scaffolding apps. The requirement engineering (RE) work described in this paper has been conducted in the context of Go-Lab with the aim of facilitating its software design and development process. Go-Lab supports three major types of online labs, namely, remote labs, virtual labs and datasets. Remote labs are real laboratories that are controlled through a website. An example is WebLab-DEUSTO Aquarium2, where real balls with different density can be thrown into
tubes filled with different liquids using a web interface, and results can be observed through webcams to learn about Archimedes’ principle. Virtual labs are simulations that emulate real labs. An example is Splash: Virtual Buoyancy Laboratory3, where virtual balls with different densities can be created and then
1 http://www.go-lab-project.eu/ [last accessed: 22/06/2015]
2 http://www.golabz.eu/lab/weblab-deusto-aquarium-0 [last accessed: 22/06/2015]
thrown into virtual tubes filled with different liquids. Datasets represent the results of experiments already conducted, for example, with the Large Hadron Collider at CERN. An analysis tool is then used as online lab to visualize and work with those results. An example for this approach is HYPATIA4. Although
in this case the real lab is not controlled through a web interface that allows users to conduct the experiment at the spot, the results can be used as if they would have been obtained that way.
By scaffolding apps, we refer to applications that facilitate learning such as the Hypothesis Scratchpad5, which enables learners to create hypotheses by
drag&drop, using predefined building blocks with words and expressions given by their teacher and with their own terms.
The Go-Lab project develops new and innovative online labs and scaffolding apps as well as collecting existing ones in a repository website [5]. To ensure compliance of the developed digital artefacts with the requirements and visions of the prospective users, a Participatory Design (PD) approach [11] has been applied in the project.
2
Motivation
In the Go-Lab project, the prototype development phase was kicked off more or less at the same time as the requirements engineering (RE) process involving end-users. This setup was somewhat unusual, because typically a user-based RE process takes place, at least in the initial project phase, prior to implementation. However, in the context of Go-Lab, some mock-ups of the main features were created based on the legacy of the related projects. To some extent this could be considered as advantageous, given that bootstrapping a new system can be very challenging and time-consuming, and it is always advisable to avoid reinventing wheels. Adapting existing designs with the ultimate goal of enhancing them can be more cost-effective than starting the design from scratch, especially when potential end-users may have limited or even no experience with online labs. Nevertheless, ongoing involvement of end-users to improve the proposed design is indispensable. This complies with the principle of Participatory Design (PD), whereby end-users can exert direct influence on the proposed design by voicing out their needs or preferences and by articulating their ideas that will seriously be considered and addressed during the development process.
4 Hybrid Pupils' Analysis Tool for Interactions in ATLAS
(http://www.golabz.eu/lab/hypatia-hybrid-pupils-analysis-tool-interactions-atlas [last accessed: 22/06/2015])
Feedback can be collected in the form of solutions proposed directly by users to address undesirable, unusable or missing features that they experience or discover when interacting with the prototype. This is alternative to the conventional waterfall-like approach: first formally specifying requirements based on users’ input and then asking experts to evaluate the implemented solution against the specification. We argue that this solution-based
requirements specification can generally be more actionable and faster to implement than the traditional way of translating users’ needs/requirements into design solutions, whereby mitigating the issue of being lost in translation [3] and of the filtering effect [10].
Requirements engineering and prototype development are normally conducted in tandem as well as in iteration. This entails user-based evaluations of increasingly interactive prototypes, ranging from non-interactive mock-ups to executable applications with most of the functionalities required. To accommodate this need, traditional Participatory Design methods, which are mostly paper-based, are deemed inadequate. For instance, the interactivity of an executable prototype cannot be evaluated with static paper-based screenshots.
As compared with the paper-based approach, an online tool can effectively support the evaluation of interactive prototypes. Putting in the context of Go-Lab, existing applications have been evaluated in terms of their compatibility with the goals and objectives of Go-Lab. In particular, with partners of a European project geographically distributed, it is necessary as well as desirable to have a tool that can address this distance barrier, considering potential advantages in face-to-face as well as distributed situations [8]. Nonetheless, as no appropriate technical solution is yet available, we have been motivated to design and implement our own, which is called Participatory Design online tool, or in its short form, PDot [7].
Requirements have therefore been collected on two levels. On the basic level, requirements for digital artefacts developed in Go-Lab are captured, using the software-supported PD approach supported by PDot. On the meta-level, requirements for PDot itself are derived from observing users when interacting with it to provide feedback on the Go-Lab artefacts and from analysing users’ responses to specific questionnaires. The focus of this paper is the development and evaluation of PDot and proposal of the new variant of the PD method to gather solution-based UX requirements it supports.
3
Design of PDot
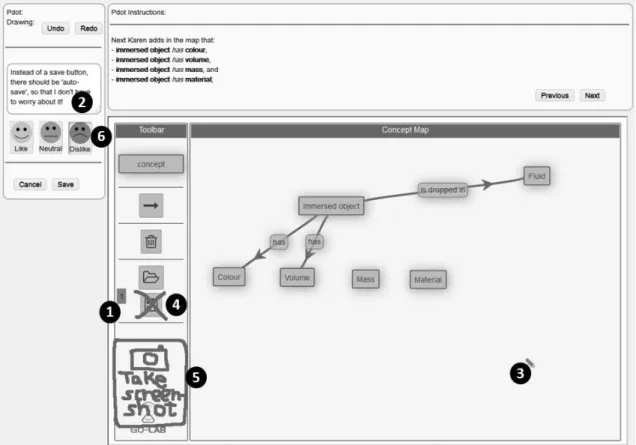
PDot consists of three components, as shown in Figure 1. The first component is the PDot box, which is displayed as the left hand column and is used for
capturing users’ feedback. The second component is the PDot Instruction Area, which is located at the upper part of the screen on the right hand side. This is used for giving guidance to the participants throughout the Participatory Design activity. The third component is the software to be evaluated, which is displayed in the lower part on the right hand side (e.g., the screenshot shown in Figure 1 shows the Concept Mapper6 scaffolding app).
Figure 1: Screenshot of PDot (for referencing parts or elements of the picture in the text, numbers on black dots have been added)
To give feedback the participant first clicks on the position of the screen to comment on. This creates a yellow sticky note in this place ( in Figure 1). The feedback can then be specified textually to give an explanation and detailed description of the problem and suggested solution, using the text input box in PDot (in Figure 1). At the same time the cursor changes to a blue pen ( in Figure 1), allowing the participant to additionally provide visual feedback by creating a freehand drawing using the mouse. Examples for such creative feedback are crossing out an element to suggest its removal ( in Figure 1) or drawing something, like a “Take screenshot button” ( in Figure 1) to suggest adding an element to the software. Three buttons in PDot ( in Figure 1) enable
the participants to specify their mood, which can be helpful for researchers and developers later on in analysing the results.
4
Preliminary Evaluation of PDot
4.1
Procedure and Participants
PDot has been used and evaluated in several Participatory Design workshops. As the related data analysis is still ongoing, only preliminary results are reported here. To give examples from the two main user groups, teachers and students from upper primary school up to universities, the results regarding usefulness, usability and user experience from one student- and one teacher-based event are reported.
The student-based event was conducted in March 2015 with 32 first-year university students in computing who used PDot to give feedback on a complete online lesson on Electricity - An Alternative approach of Ohm's Law7, including
learning scaffolding apps and an online lab. The evaluation took place in a partly distributed setting, as the students were briefed in class but performed the actual evaluation in their own time, either at home or during another class. 28 (24 male and 4 female; all university students currently studying in the United Kingdom) of the participants filled in the questionnaire about PDot completely, 4 only partially (not answering the questions reported in this paper).
The teacher-based event was conducted in April 2015 as part of a teacher conference with 20 teachers who used PDot to give feedback on an online chemistry laboratory called BOND lab8 on precipitations. As the tool was used as
part of the workshop on site, the setting was non-distributed in this case. 19 (2 male and 17 female; 8 Primary School, 9 Secondary School, 1 Further Education college, 1 university; all from the United Kingdom) of the participants filled in the questionnaire about PDot completely, one only partially (not answering the questions reported in this paper).
4.2
Instruments
The evaluation approach we adopted was primarily subjective self-reporting. After using PDot, the participants were asked to complete a questionnaire on usability and user experience (see Appendix A). Specifically, Section 2 is based
7 http://www.golabz.eu/spaces/electricity-alternative-approach-ohms-law [last accessed:
22/06/2015]
on two standardized questionnaires, namely AttrakDiff [6] and Usability Metric for User Experience (UMUX) [4], whereas Section 3 and 4 have been developed by the first author to get first impressions on the usability and feature set of PDot. Consequently the questions are based on three usability attributes: Learnability (easy to learn), Efficiency of Use (ease of use), and Subjective Satisfaction (useful) [9] enhanced with questions regarding the usefulness of different PDot features and free form fields to explain in more detail. Put concisely, AttrakDiff is grounded in the theoretical assumption that the hedonic and pragmatic quality of an interactive product contributes to its attractiveness, which in turn leads to positive user experience and intention to use. UMUX is built upon the traditional notion of usability (ISO 9241-11:19989) and System Usability Scale (SUS) [1]
with the aim of producing an even more parsimonious scale for industrial use. The list below summarizes the measures taken (see Appendix A for details):
Background
Some demographic data have been collected from the participants, including gender, age, school type, and country. These can be co-variants for the evaluation results of PDot, but are not dealt with accordingly in this study, given the small sample size.
User Experience (AttrakDiff and UMUX)
These two standardized questionnaires capture quantitative data to be analysed with appropriate statistical methods.
Usability
A set of 11 usability statements collects quantitative data to be analysed with appropriate statistical methods.
Features
The open-ended questions enable participants to give qualitative comments on existing features of PDot and to propose new ones. However, as the response rate to this question is rather low, the limited findings are not reported in this paper.
5
Results and Discussions
To compare the responses of students and teachers regarding the “Usability of PDot” statements in the questionnaire a non-parametric Mann-Whitney-U test has been performed, given that the results of a Shapiro-Wilk test of normality indicates a non-normal distribution of the data. Only two question showed a
9 ISO 9241-11:1998 Ergonomic requirements for office work with visual display terminals
significant statistical difference between teachers and students: “Sticky notes marking the spot of my feedback were useful.” with U=177.50, p<0.05, student mean rank=20.84, teacher mean rank=28.66 and “It was easy to switch between different modes (instructions, interact with app, give feedback).” with U=158.50, p<0.05, student mean rank=20.16, teacher mean rank=29.66. A possible explanation why teachers (mean=3.53) found it easier, as compared with their student (mean=2.79) counterparts, to switch between PDot modes might lie in the different software artefacts evaluated by the students and teachers. The teachers were evaluating an online lab, which requires less navigation and fewer switching between interacting with the lab and giving feedback using PDot as compared to the students’ evaluation of a whole online lesson, which not only includes an online lab but also several scaffolding apps and other online resources (e.g., Electrical circuit lab10, Conclusion Tool11 and YouTube videos).
While on average both user groups found the virtual sticky notes useful, we are not sure why teachers (mean=4.32) did this significantly more than students (mean=3.71).
The other questions did not show any significant difference in the ratings between the students and teachers, suggesting that their perceptions of the functionalities of PDot are similar. For the teachers’ responses, the mean values were all higher than 3.0, indicating their overall neutral attitude towards the statements or their tendency to agree with the statements. For the students’ responses, the mean values were less than 3.0 for two of the statements, suggesting that they tended to disagree on them while being neutral or inclined to agree on the other statements. The first statement on which the students disagreed is “Design of PDot was visually appealing.” (mean = 2.79, SD = 1.1) and the second one is “It was easy to switch between different modes (instructions, interact with app, give feedback).” (already discussed above). The rating of students for the former statement, albeit not significantly different from the teachers (mean = 3.32, SD = 1.06), indicates that the design seems sufficient for the teachers whereas the students seem to see the need for improvement. In our future work, data analysis with a bigger dataset will be performed to see if these first impressions can be confirmed.
To compare the responses of students and teachers regarding the “User Experience of PDot” statements (which were rated by 26 students and 19 teachers) in the questionnaire, an independent samples t-test has been performed for pragmatic and hedonic quality measured through AttrakDiff, given that the
10 http://www.golabz.eu/lab/electrical-circuit-lab [last accessed: 22/06/2015] 11 http://www.golabz.eu/apps/conclusion-tool [last accessed: 22/06/2015]
result of a Shapiro-Wilk normality test indicates the normal distribution of the data (significance levels greater than 0.05, see Table 1).
Table 1: Normality test results for pragmatic and hedonic quality (from AttrakDiff word pairs)
Shapiro-Wilk Statistic df p value Pragmatic Quality students .975 26 .748 teachers .938 19 .245 Hedonic Quality students .975 26 .755 teachers .907 19 .064
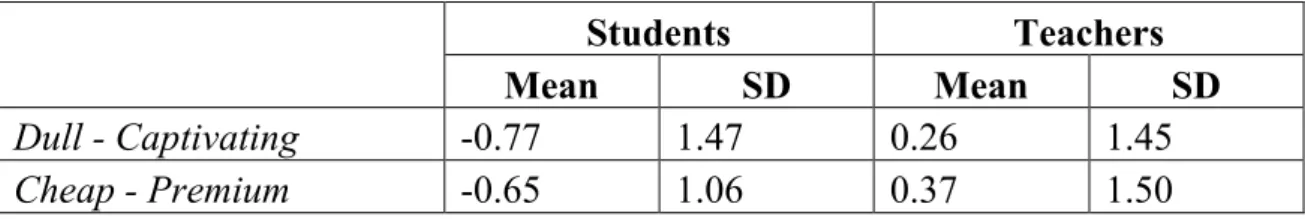
For the User Experience question based on AttrakDiff, no significant differences in the perception of the pragmatic quality between students and teachers have been found. But teachers rated the hedonic quality significantly higher than students did with t[43] = -2.18, p<0.05 (student: mean = -0.27, SD = 0.78 and teacher: mean = 0.37, SD = 1.19). Both mean ratings are in the average region, thus there is still room for improvement, but the teachers already perceived a higher potential for getting pleasure from the tool usage. When analysing the statements individually using a non-parametric Mann-Whitney-U test, as the results of a Shapiro-Wilk test of normality indicates a non-normal distribution of the data, two of them show significant differences. One is “dull - captivating” with U=142.00, p<0.05, student mean rank=18.96, teacher mean rank=28.53 and the other one is “cheap - premium” with U=127.00, p<0.01, student mean rank=18.38, teacher mean rank=29.32. The mean student rating of these statements goes towards the negative and the mean teacher rating towards the positive side of the scale (calculated from the 7 point scale by using values from -3 for the word on the left to +3 for the word on the right, see Table 2 for results).
Table 2: Ratings of word pairs from AttrakDiff with significant differences between students and teachers
Students Teachers Mean SD Mean SD
Dull - Captivating -0.77 1.47 0.26 1.45
Cheap - Premium -0.65 1.06 0.37 1.50
These findings correspond to the results of the analysis of the Usability questions, where the students stated that they did not find PDot visually appealing where the teachers did. For the 4 statements of the UMUX
questionnaire, no significant differences in rating between the students and teachers have been found. In our future work, data analysis with a bigger dataset will be performed to see if the same trends can be found.
Analysing a bigger dataset, including teachers and students evaluating different or the same applications using PDot will also help to overcome one of the limitations of the current data analysis. As the samples reported on in this paper not only differed regarding their characteristics (teachers or students), but also regarding the artefact evaluated using PDot, the latter might also influence the results, thus limiting the certainty of the reasons for the differences. Future analysis and results will show if the responses of each target group are consistent, when using PDot to give feedback about the same and different digital artefacts, overcoming this limitation of the preliminary data analysis.
6
Future work
The preliminary results of the usability and User Experience evaluation show that usability and usefulness of PDot are perceived as sufficient, but there is still room for improvement, at least from the students’ perspective especially regarding the visual representation of the tool. As PDot is currently still under development, these results are going to be taken into consideration for its future re-design and development. Besides asking usability-related questions, the questionnaire also gathered functionality-related information, which will be incorporated in the new version of PDot currently developed. For example it has been reported that it can be difficult to identify in which mode PDot currently is. This will be addressed by visually highlighting the feedback mode through a coloured frame around the prototype. An alternative idea is to “grey out” the prototype while it is not interactive, as done in other applications (e.g., the Snipping Tool in Microsoft Windows), but it has to be checked first, if this alteration of the prototype might have an influence on the quality of feedback.
As the dataset reported on in this paper is rather small and thus only allows first impressions about the usability and User Experience rating of PDot, more data will be collected and analysed to check if these preliminary findings will be further supported.
Currently PDot allows participants to freely express their feedback and input (through freehand drawings and in a single textbox). Accordingly, the results gathered are a mixture of usability issues, feature requests (requirements), and other matters (e.g. feedback regarding the learning content). As the Go-Lab project at this stage is interested in all kinds of feedback and not only requirements, PDot provides a sufficient way to gather it for the researchers working on improving the usability and user experience of the project’s results.
To support researchers in the task of classifying and analysing the results gathered, (partially) automated analysis, for example, through Natural Language Processing, might be added in upcoming versions of PDot.
Acknowledgements
This work was partially funded by the European Union in the context of the Go-Lab project (Grant Agreement no. 317601) under the Information and Communication Technologies (ICT) theme of the 7th Framework Programme for R&D (FP7). This document does not represent the opinion of the European Union, and the European Union is not responsible for any use that might be made of its content.
We would like to thank all teachers and students participating in our workshops.
References
[1]Brooke, J. SUS-A quick and dirty usability scale. Usability evaluation in industry, 189(194), 1996. pp. 4-7.
[2]de Jong, T., Sotiriou, S. and Gillet D. Innovations in STEM education: the Go-Lab federation of online labs. Smart Learning Environments, 1(1), 2014. pp. 1-16.
[3]DePaula, R. Lost in translation: a critical analysis of actors, artifacts, agendas, and arenas in participatory design. In Proceedings of the eighth conference on Participatory design: Artful integration: interweaving media, materials and practices-Volume 1, July. ACM, 2004, pp. 162-172.
[4]Finstad, K. The Usability Metric for User Experience. Interacting with Computers, 22, 5, September 2010.
[5]Govaerts, S., Cao, Y., Vozniuk, A., Holzer, A. C., Garbi Zutin, D., San Cristóbal Ruiz, E., Bollen, L., Manske, S., Faltin, N. and Salzmann, C. Towards an Online Lab Portal for Inquiry-based STEM Learning at School. Proc. of ICWL 2013, 2013.
[6]Hassenzahl, M. and Monk, A. The Interference of Perceived Usability From Beauty, Human Computer Interaction, 25:3, 2010, pp. 235-260
[7]Heintz, M., Law, E. L.-C., Govaerts, S., Holzer, A. and Gillet, D. Pdot: Participatory Design Online Tool, CHI '14 Extended Abstracts on Human Factors in Computing Systems. ACM, 2014, pp. 2581-2586.
[8]Heintz, M., Law, E. L.-C. and Heintz, S. Review of Online Tools for Asynchronous Distribute Online Participatory Design. In Dominik Renzel, Ralf Klamma (eds.), "Large-Scale Social Requirements Engineering", IEEE Computer Society Special Technical Community on Social Networking E-Letter, vol. 2, no. 3, September 2014.
[10] Ovaska, P., Rossi, M. and Smolander, K. Filtering, negotiating and shifting in the understanding of information system requirements. Scandinavian Journal of Information Systems, 17(1), 7. 2005.
[11] Schuler, D. and Namioka, A. Participatory design: principles and practices. 1993.
Appendix A: Questionnaire
1.
General information
12 Age: Gender: Female Male School type: * Primary School Secondary School Other: Country: * Austria Belgium Cyprus Estonia France Germany Greece Netherlands Portugal Spain Switzerland United Kingdom Other:2.
User Experience
In the table below you will find 10 pairs of contrasting attributes. Where you place your choice between two attributes indicates your view about the quality of PDot.
12The students answered the same questions as the teachers but instead of the
General Information, they just had to specify their student ID, from which those information could be derived.
This choice tells us that PDot is somewhat likeable, but there is still room for improvement
(Note: There is no right or wrong answer. Your personal opinion is what counts.)*
Please choose the appropriate response for each item:
Confusing Structured Practical Impractical Predictable Unpredictable Simple Complicated Dull Captivating Stylish Tacky Cheap Premium Unimaginative Creative Good Bad Ugly Beautiful
For each of the following statements, please indicate your extent of agreement by selecting the number of choice. *
Please choose the appropriate response for each item:
Strongly Disagree 1 2 3 4 5 6 Strongly Agree 7 1. The PDot capabilities meet my requirements. 2. Using PDot is a frustrating experience. 3. PDot is easy to use.
4. I have to spend too much time correcting
3.
Usability of PDot
Please indicate your opinion regarding the following statements from 1 (Strongly Disagree) to 5 (Strongly agree):
Please choose the appropriate response for each item:
1 2 3 4 5
The tool used to conduct the evaluation (PDot) was easy to learn.
PDot was easy to use.
Features of PDot were sufficient for the task.
Design of PDot was visually appealing. Having a scenario to follow included in
PDot was useful.
Sticky notes marking the spot of my feedback were useful.
Freehand drawing functionality was useful.
Textual feedback option was useful. Option to specify mood was useful. It was easy to switch between different
modes (instructions, interact with app, give feedback).
PDot was useful to give feedback.
4.
Features
What did you like about PDot?
What did you not like about PDot?
Which features would you like additionally in PDot?
Which features would you like to have removed from PDot?