Oriented-SLA and Energy-Efficient Virtual Machine Management
Strategy of Cloud Data Centers
Lijun Xu
1, Weifeng Wang
1and Xiaoqing Zhang
2*1
School of Computer and Information Engineering, Xinxiang University, Xinxiang,
453003, P.R.China
2
School of Mathematics and Computer Science,Wuhan Polytechnic University,
Wuhan, 430023, P.R.China
[email protected], [email protected], [email protected]
Abstract
Cloud computing has revolutionized the information and communication technology industry by enabling on-demand provisioning of elastic computing resources on a pay-as-you-go basis. However, due to the large-scale popularization and application, cloud data centers consume enormous amounts of electrical energy, which results in high operating costs and carbon dioxide emissions. In this paper, twenty-two algorithms are simulated for testing the trade-off between the applications performance and energy consumption during virtual machine management of cloud data centers in CloudSim simulation toolkit. The goal of these algorithms is to reduce energy consumption under ensuring the performace of cloud applications. A large number of simulation experimental results prove the performance of these twenty-two algorithms respectively.
Keywords: Virtual machine management, CloudSim, Service Level Agreement, Energy efficient
1. Introduction
Cloud computing [1] is emerging as the latest distributed computing paradigm and attracts increasing interests of researchers in the field of distributed and parallel computing. The proliferation of cloud computing has resulted in the establishment of large-scale data centers containing thousands of computing nodes and consuming enormous amounts of electrical energy. The reason for this extremely high energy consumption is not just in the amount of computing resources used and the power inefficiency of hardware, but rather lies in the inefficient usage of these resources. High energy consumption by the infrastructure leads to substantial carbon dioxide emissions contributing to the greenhouse effect [2]. For reducing energy consumption in cloud data centers and ensuring SLA [3] between users and cloud resource providers, the paper constructs a simulation experiments researches to current existed oriented-SLA and energy efficient virtual machine management and placement strategies in [4], whose objective is to save energy and reduce the number of SLA violation.
1
For reducing energy consumption with meeting SLA, we split the problem of the adaptive placement of virtual machine into the following two parts:
(1) Detection Strategy. Determining when a physical node is considered as being overloaded (or called hotspot) requiring migration one or more virtual machines from this node.
(2) Selection Strategy. Selecting which virtual machines that should be migration from an overloaded physical server.
2. Related Works
Virtual machine placement in cloud data center is an important problem that remains to be effectively addressed. The mapping problem between virtual machines and physical hosts is to decide how to allocate virtualized resource on the cloud to many applications, thus is greatly impacts on the performance, cost and QoS guaranteed service. In ref.[5], a multi-objective optimization genetic algorithm is proposed to determine deployment strategy, which is subject to application SLA constraint. In ref.[6,7], the live migration problem of virtual machines is described as an optimization problem. The optimization objective is to minimize the energy consumption of physical hosts in cloud data center. But, the above work does not consider the performance and SLA violation from the view of user’s applications. Hien Nguyen et al. [8] propose a resource management framework combining a utility-based dynamic virtual machine provisioning manager and a dynamic virtual machine placement manager. Both problems are modeled as constraint satisfaction problems. The virtual machine provisioning process aims at maximizing a global utility capturing both the performance of the hosted applications with regard to their SLA and the energy related operational cost of the cloud computing infrastructure. Different from Li Qiang et al. [5], Hien Nguyen et al. [8] lacks of the use of the live migration mechanism of virtual machines. R. Raghavendra et al. [9] have investigated the problem of power management for a data center environment by combining and coordinating five diverse power management policies. The authors explored the problem in terms of control theory and applied a feedback control loop to coordinate the controllers’ actions. Sivadon Chaisiri et al. [10] propose an optimal virtual machine placement (OVMP) algorithm. The algorithm can minimize the cost spending in each plan for hosting virtual machines in a multiple cloud provider environment under future demand and price uncertainty.
Obviously, the virtual machine deployment problem in cloud computing environment mainly involves only a single target optimization at present. For example, the physical host used is least, or minimizing SLA violations and guaranteeing QoS performance of applications, or reducing the total energy consumption of data center and virtual machine migration number. However, these optimized goals may be in conflict with each other. In order to reduce the number of hosts used, all virtual machines need to be deployed reasonably to a smaller number of hosts in bin-packing mode, which can reduce the overhead of idle nodes. But this needs multiple virtual machine migrations to achieve. In order to guarantee the QoS of applications and reduce SLA violation, virtual machines have to be consolidated and migrated in many times, which can turn on more hosts and lead to more energy consumption. Meanwhile, the energy consumption is associated with the specific resource utilization of physical hosts, so the least used hosts can not always bring the minimum energy consumption. An efficient virtual machine deployment strategy should balance and compromise the energy consumption, QoS and SLA.
3. Host Overload Detection Algorithms-Detection Strategy
3.1 MPA
The main idea of MPA (Maximal Power Algorithm) is known as that all hosts consume maximum power all the time in a heterogeneous non-power aware cloud data center, which means the CPU keeps the maximal power condition.
3.2 DVFS
DVFS is also called as Dynamic Voltage and Frequency Scaling [11]. The main idea of DVFS is: when CPU is not fully utilized, the performance of CPU can be reduced through reducing the supply voltage and clock frequency of CPU, which can reduce the dynamic power consumption with cubic orders of magnitude and can not affect the performance.
3.3 STH
STH is called as Static Threshold. It is based on the idea of setting upper utilization thresholds for nodes and keeping the total utilization of the CPU by all the virtual machines under the threshold. If the CPU utilization of a physical node exceeds the static upper threshold, some virtual machines have to be migrated from the node to reduce the CPU utilization in order to prevent a potential SLV violation, as showed in Figure 1.
Host 1 VM VM VM VM Host 1 VM VM VM Host 2 VM VM VM Host 2 VM VM Threshold Threshold Figure 1. STH 3.4 IQR
Interquartile Range (IQR) is a measure of statistical dispersion. It is equal to the difference between the third and first quartiles: IQR=Q3-Q1. Unlike the total range, the
interquartile range is a robust statistic, having a breakdown point of 25%, and thus is often preferred to the total range. In the overload algorithm based on IQR, the CPU utilization threshold is defined as,
1
u
T
IQR
(1) Where ε is a parameter of the method defining how strongly the system tolerates host overloads. In other words, the parameter allows the adjustment of the safety of the method: a lower value of ε results in a higher tolerance to variation in the CPU utilization, while possibly increasing the level of SLA violations caused by the consolication.3.5 LR
The main idea of the Local Regression method [12] is fitting simple models to localized subsets of data to build up a curve that approximatesthe original data. The observation (xi,yi) are assigned neighborhood weights using the tricube weight function shown in Equation (2). 3 3 0, (1 | | ) , | | 1 u otherwise T u if u (2)
If the inequalities (3) are satisfied, the algorithm detects a host overload, requiring some VMs to be offloaded from the host.
1 1 ˆi 1 k k m y x x t
(3)Where tm is the maximum time required for a migration of any of the VMs allocated to the host.
3.6 RLWR
RLWR can adjust the value of the static upper utilization threshold based on a statistical analysis of historical data collected during the lifetime of virtual machines. Based on LR, the fit is evaluated at the xi to get the fitted value
y
ˆ
i, and the residualsˆ
i iˆ
ie
y
y
. At the next step, eahc observation (xi,yi) is assigned an additional robustness weight ri, whose value depends on the magnitude ofe
ˆ
i. Each observation is assigned the weight riwi(x), where ri is defined as,ˆ
(
6 )
i i
r
B e
s
(4) Where B(u) is the bisquare weight function.
2 2 0, ( ) (1 | | ) , | | 1 otherwise B u u if u ,
s
median e
|
ˆ
i|
(5)If the inequalities (6) are satisfied, the algorithm detects a host overload, requiring some VMs to be offloaded from the host.
1 1 ˆi 1 k k m y x x t
(6)Where tm is the maximum time required for a migration of any of the VMs allocated to the host.
3.7 MAD
Median Absolute Deviation (MAD) is a robust statistic, being more resilient to outliers in a data set then the standard deviation. In standard deviation, the distances from the mean are squared leading to large deviations being on average weighted more heavily. For a univariate data set x1,x2,…,xn, MAD is defined as the median of the absolute deviations from the median of the data set:
(|
( ) |)
i i j j
MAD
median
x
median x
(7) In the overload detection algorithm based on MAD, CPU utilization threshold Tu is defined as showed in the following,1
u
T
MAD
(8)4. Virtual Machine Selection Algorithms-Selection Strategy
4.1 MPM
MPM (Minimum Period Migration) migrates a virtual machine v that requires the minimum period to complete a migration relatively to the other virtual machines allocated to the node. The migration period is defined as the amount of RAM utilized by
the virtual machine divided by the space network bandwidth available for the physical node j. Let Vj be a set of virtual machines currently allocated to the node j. The set R of migrated virtual machines searched by MPM is
min
( )
(
)
. .
( )
(
)
{
}
u j v R j j v R a u j jRAM v NET
R
Q V
s t u
u v
T
Q V
U U
V
(9)Where, RAMu(v) is the amount of RAM currently utilized by the virtual machine v and NETj is the spare network bandwidth available for the node j.
4.2 MNM
MNM (Minimum Number Migration) selects the minimum number of virtual machines needed to migrate from a physical node to lower the CPU utilization below the upper utilization threshold if the upper threshold is violated. Let Vj be a set of virtual machines currently allocated to the node j, Q(Vj) is the power set of Vj (include null set and all subset of universal set). The set R of migrated virtual machines searched by MNM is
min
(
)
. .
( )
(
)
{
}
j j v R a u j jR
R
Q V
s t u
u v
T
Q V
U U
V
(10)Where, uj is the current CPU utilization of the node j, ua(v) is the fraction of the CPU utilization allocated to the virtual machine v.
4.3 MU
MU (Minimum Utilization) prefers to migrate the virtual machines with the lowest CPU utilization. MU is suit for the virtual machine placement strategy with priority. The virtual machine with high CPU utilization has high priority and the virtual machine with low CPU utilization has low priority.
4.4 RCA
RCA (Random Choice Algorithm) depends on a random selection of a number of virtual machines needed to reduce the CPU utilization by a physical node below the fixed utilization threshold. The set R of virtual machines find by RCA:
(0,| ( ) | 1)
d
j
R X U Q V (11)
5. Simulation Experiments
CloudSim [13] has been selected as a simulation platform, as it is a modern simulation framework aimed at cloud computing environment. Contrasting to other simulation toolkits, such as SimGrid and GangSim, it allows the modeling of virtualized environments, supporting on-demand resource provision and their management. It has been extended to enable energy aware simulations, as the core framework does not provide this capacity.
The cloud environment includes a data center, which consists of N heterogeneous physical nodes. According to different process power of CPU, these physical nodes are divided equally into two types, represented by (1800MIPS, 2600MIPS). Two types of physical nodes both include two process elements (CPU core), 4G RAM and 1GB/s network bandwidth. Each virtual machine requires one CPU core with 2500, 2000, 1500, 500MIPS, 0.8, 1.7, 1.5, 0.6BG of RAM and 100MB of bandwidth. Each virtual machine runs a web-application or any kind of application with variable workload, which is modeled to generate the utilization of CPU according to a uniformly distributed random variable. The application runs for 150,000 MI that is equal to 10 min of the execution on 250 MIPS CPU with 100% utilization. Initially, all virtual machines are allocated according to the requested characteristics assumin g 100% CPU utilization.
In order to compare the efficiency of the algorithms we use the following eight metrics to evaluate their performance.
(1) Total energy consumption. The total energy consumption of all physical hosts in data center during the execution of application loads.
(2) The number of virtual machine migration. The number of virtual machine migration during the auto-adaptive virtual machine optimization placement and consolidation. (3) The SLAV time per active host (SLATAH)
It is a percentage of time, during which active hosts have experienced the CPU utilization of 100%. , 1 ,
1
SLATAH=
N i s i i aT
N
T
(12) (4) The ratio of performance degradation (RPD)It means the overall performance degradation by virtual machines due to migrations.
, 1 ,
1
RPD=
M i d i i tC
M
C
(13) Where N is the number of physical hosts, Ti,s is the total time during which the physical host ihas experienced the utilization of 100% leading to a SLAV, Ti,a is the total of the physical host i being the active state (serving virtual machines), M is the number of virtual machines, Ci,d is the estimate of the performance degradation of the virtual machine j caused by migration, and Ci,t is the total CPU capacity requested by the virtual machine j during its lifetime. In our experiments, we estimate Ci,d as 10% of the CPU utilization in MIPS during all migrations of the virtual machine j.
(5) The service ratio of single node. It is the product of RPD and SLATAH.
(6) The overall SLA violation. Overall SLA violation (SLAV) is defined as a fraction of the difference between the requested MIPS by all the virtual machines Uj,r(t) and the actually allocated MIPS Uj,a(t) relatively to the total requested MIPS over the lifetime of the virtual machines, as showed in following equation,
, , 1 , 1
[
( )
( )]
SLAV
100%
( )
M j r j a j t M j r j tU
t
U
t dt
U
t dt
(14)Where, M is the number of virtual machines. This metric represents the percentage of the CPU performance that has not been allocated when demanded by application relatively to the total demand.
(7) The average SLA violation. The proportion of not allocated CPU to the total requirement brought by virtual machine migration.
(8) The number of shutdown. The number of shutdown during the auto-adaptive virtual machine optimization placement and consolidation.
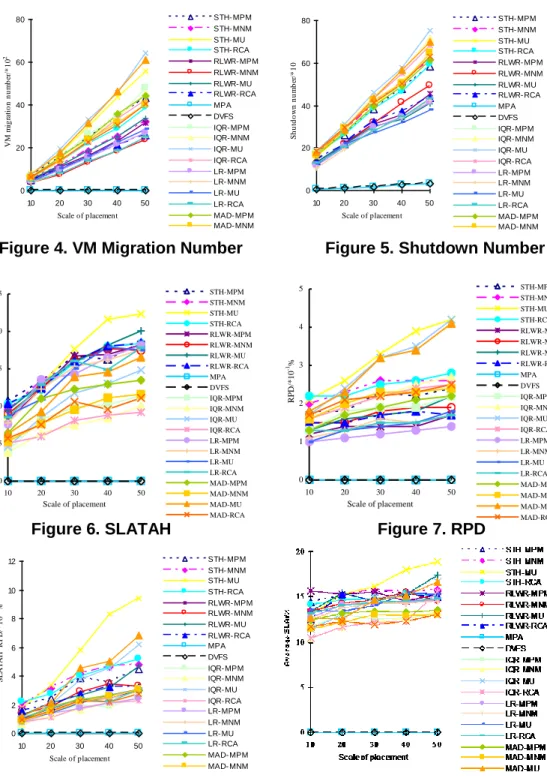
The following eight figures (Figure 2~9) shows that the changes of the performance metric of algorithms under different placement scale of virtual machines. The placement scale of virtual machines is defined as the number of physical nodes and virtual machines. Let the number of virtual machines equals to the number of physical nodes.
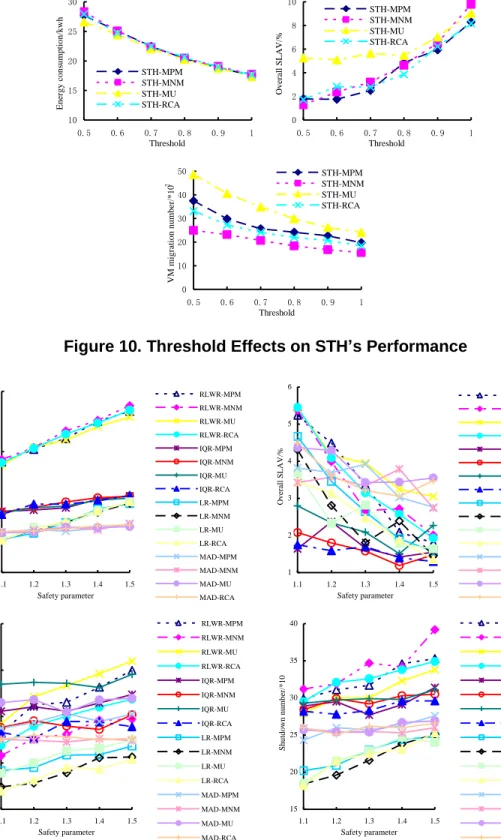
Figure 10 is to show the effect of different thresholds on the energy consumption and SLA of STH. with the increase of the fixed threshold, the energy consumption reduces but overall SLAV increases. This is because the increasing threshold will lead to more virtual machine consolidation, which brings less virtual machine migration. From the above experimental results, we can see the greater threshold dose not mean better, which is related to the tradeoff between the energy consumption of hosts and the performance of service.
Figure 11 is to show the effect of different safe factors on the energy consumption and SLA of RLWR, LR, MAD and IQR. We can see that with the increase of the safe factor, the energy consumption increases, the overall SLAV reduces and the number of virtual machine migration increases. This is because the safe factor ε is a parameter of the method that defines how aggressively the system consolidates virtual machines. In other words, the lower the safe factor ε, the less the energy consumption, but the higher the level of SLAV caused by the consolidation.
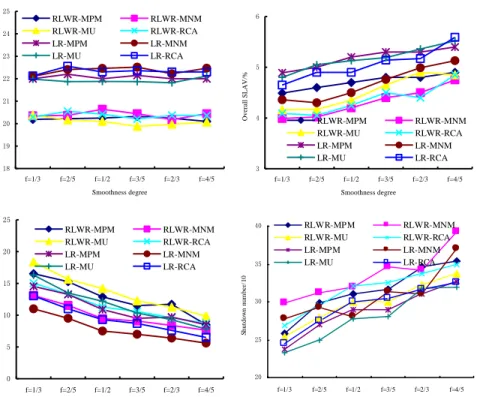
Figure 12 is to show the effect of different smoothness degrees on the energy consumption and SLA of RLWR and LR. The smoothness factor does not greatly effect on the energy consumption of the algorithm. But, the overall SLAV increases and the number of virtual machine migration drops off. This is because the increase of smoothness factor demonstrates the number of observation points increases for estimating a point, which makes the algorithm more robust in terms of bearing load peaks. As a result, this will bring less virtual machine migration and more SLAVs.
0 40 80 120 160 10 20 30 40 50 Scale of placement E n er g y c o n su m p ti o n /k w h STH- MPM STH- MNM STH- MU STH- RCA RLWR- MPM RLWR- MNM RLWR- MU RLWR- RCA MPA DVFS IQR- MPM IQR- MNM IQR- MU IQR- RCA LR- MPM LR- MNM LR- MU LR- RCA MAD- MPM MAD- MNM MAD- MU MAD- RCA 0 2 4 6 8 10 10 30 50 Scale of placement O v er al l S L A V /% STH- MPM STH- MNM STH- MU STH- RCA RLWR- MPM RLWR- MNM RLWR- MU RLWR- RCA MPA DVFS IQR- MPM IQR- MNM IQR- MU IQR- RCA LR- MPM LR- MNM LR- MU LR- RCA MAD- MPM MAD- MNM MAD- MU MAD- RCA
0 20 40 60 80 10 20 30 40 50 Scale of placement V M m ig ra ti o n n u m b er /* 1 0 2 STH- MPM STH- MNM STH- MU STH- RCA RLWR- MPM RLWR- MNM RLWR- MU RLWR- RCA MPA DVFS IQR- MPM IQR- MNM IQR- MU IQR- RCA LR- MPM LR- MNM LR- MU LR- RCA MAD- MPM MAD- MNM MAD- MU MAD- RCA 0 20 40 60 80 10 20 30 40 50 Scale of placement S h u td o w n n u m b er /* 1 0 STH- MPM STH- MNM STH- MU STH- RCA RLWR- MPM RLWR- MNM RLWR- MU RLWR- RCA MPA DVFS IQR- MPM IQR- MNM IQR- MU IQR- RCA LR- MPM LR- MNM LR- MU LR- RCA MAD- MPM MAD- MNM MAD- MU MAD- RCA
Figure 4. VM Migration Number Figure 5. Shutdown Number
0 5 10 15 20 25 10 20 30 40 50 Scale of placement SL A TA H /% STH-MPM STH-MNM STH-MU STH-RCA RLWR-MPM RLWR-MNM RLWR-MU RLWR-RCA MPA DVFS IQR-MPM IQR-MNM IQR-MU IQR-RCA LR-MPM LR-MNM LR-MU LR-RCA MAD-MPM MAD-MNM MAD-MU MAD-RCA 0 1 2 3 4 5 10 20 30 40 50 Scale of placement RP D /*10 -1% STH-MPM STH-MNM STH-MU STH-RCA RLWR-MPM RLWR-MNM RLWR-MU RLWR-RCA MPA DVFS IQR-MPM IQR-MNM IQR-MU IQR-RCA LR-MPM LR-MNM LR-MU LR-RCA MAD-MPM MAD-MNM MAD-MU MAD-RCA
Figure 6. SLATAH Figure 7. RPD
0 2 4 6 8 10 12 10 20 30 40 50 Scale of placement S L A T A H * R P D /* 1 0 -2% STH- MPM STH- MNM STH- MU STH- RCA RLWR- MPM RLWR- MNM RLWR- MU RLWR- RCA MPA DVFS IQR- MPM IQR- MNM IQR- MU IQR- RCA LR- MPM LR- MNM LR- MU LR- RCA MAD- MPM MAD- MNM MAD- MU MAD- RCA
10 15 20 25 30 0.5 0.6 0.7 0.8 0.9 1 Threshold E ne rgy cons umpt ion/ kwh STH-MPM STH-MNM STH-MU STH-RCA 0 2 4 6 8 10 0.5 0.6 0.7 0.8 0.9 1 Threshold Ove ra ll S L AV /% STH-MPM STH-MNM STH-MU STH-RCA 0 10 20 30 40 50 0.5 0.6 0.7 0.8 0.9 1 Threshold VM mi gr ati on number /*10 2 STH-MPM STH-MNM STH-MU STH-RCA
Figure 10. Threshold Effects on STH’s Performance
10 15 20 25 1.1 1.2 1.3 1.4 1.5 Safety parameter Ener gy cons um pt ion/ kw h RLWR-MPM RLWR-MNM RLWR-MU RLWR-RCA IQR-MPM IQR-MNM IQR-MU IQR-RCA LR-MPM LR-MNM LR-MU LR-RCA MAD-MPM MAD-MNM MAD-MU MAD-RCA 1 2 3 4 5 6 1.1 1.2 1.3 1.4 1.5 Safety parameter O ver al l SL A V /% RLWR-MPM RLWR-MNM RLWR-MU RLWR-RCA IQR-MPM IQR-MNM IQR-MU IQR-RCA LR-MPM LR-MNM LR-MU LR-RCA MAD-MPM MAD-MNM MAD-MU MAD-RCA 5 10 15 20 25 1.1 1.2 1.3 1.4 1.5 Safety parameter V M m igr at ion num ber /*10 2 RLWR-MPM RLWR-MNM RLWR-MU RLWR-RCA IQR-MPM IQR-MNM IQR-MU IQR-RCA LR-MPM LR-MNM LR-MU LR-RCA MAD-MPM MAD-MNM MAD-MU MAD-RCA 15 20 25 30 35 40 1.1 1.2 1.3 1.4 1.5 Safety parameter Shutdown numbe r/ *10 RLWR-MPM RLWR-MNM RLWR-MU RLWR-RCA IQR-MPM IQR-MNM IQR-MU IQR-RCA LR-MPM LR-MNM LR-MU LR-RCA MAD-MPM MAD-MNM MAD-MU MAD-RCA
Figure 11. Safety parameter Effects on the Performance of RLWR, IQR, LR and MAD
18 19 20 21 22 23 24 25 f=1/3 f=2/5 f=1/2 f=3/5 f=2/3 f=4/5 Smoothness degree E n er g y co n su m p tio n /k wh RLWR-MPM RLWR-MNM RLWR-MU RLWR-RCA LR-MPM LR-MNM LR-MU LR-RCA 3 4 5 6 f=1/3 f=2/5 f=1/2 f=3/5 f=2/3 f=4/5 Smoothness degree Ov er all SLAV /% RLWR-MPM RLWR-MNM RLWR-MU RLWR-RCA LR-MPM LR-MNM LR-MU LR-RCA 0 5 10 15 20 25 f=1/3 f=2/5 f=1/2 f=3/5 f=2/3 f=4/5 Smoothness degree VM m ig ratio n n u m b er /1 0 2 RLWR-MPM RLWR-MNM RLWR-MU RLWR-RCA LR-MPM LR-MNM LR-MU LR-RCA 20 25 30 35 40 f=1/3 f=2/5 f=1/2 f=3/5 f=2/3 f=4/5 Smoothness degree S hu tdo w n nu m be r/ 10 RLWR-MPM RLWR-MNM RLWR-MU RLWR-RCA LR-MPM LR-MNM LR-MU LR-RCA
Figure 12. Smoothness Degree Effects on the Performance of RLWR and LR
6. Conclusion
Oriented-SLA and energy-efficient virtual machine management strategies of cloud data centers are researched in this paper through a number of simulation experiments. We can see that virtual machines are not only deployed on fewer hosts in these self-adaptive placement strategies, which promotes energy efficiency through turning off unused hosts, but also the load prediction of resource can bring high-reliable QoS delivery and avoid overmuch SLA violations. Experimental results show that these strategies have a good effect on decreasing SLA violation under ensuring energy efficiency.
Acknowledgements
This work was financed partially by the project of department of education in Henan province (15A520094).
References
[1] L.M. Vaquero, L. Rodero-Merino, J. Caceres, “A break in the clouds: towards a cloud definition”, SIGCOMM Computer Communication Review, vol. 39, (2008), pp.50-55.
[2] A. Beloglazov, J. Abawajy, R. Buyya, “Energy-aware resource allocation heuristics for efficient management of data centers for Cloud computing”, Future Generation Computer Systems, vol.18, (2012), pp.755–768.
[3] R. Buyya, C.S. Yeo, S. Venugopal, J. Broberg, I. Brandic, “Cloud computing and emerging IT platforms: vision, hype, and reality for delivering computing as the 5th utility”, Future Gener Comput System, vol.25, (2009), pp.599–616.
[4] A. Beloglazov, R. Buyya, “Optimal Online Deterministic Algorithms and Adaptive Heuristics for Energy and Performance Efficient Dynamic Consolidation of Virtual Machines in Cloud Data Centers”, Concurrency and Computation: Practice and Experience, vol.24, (2012), pp.1397-1420.
[5] L. Qiang, H. Qin-Fen, X. Li-Min, “Adaptive management and multi-objective optimization for virtual machine placement in cloud computing”, Chinese Journal of computers, vol.34, (2011), pp.2253-2264. [6] W. Xiaorui, W. Yefu, “Coordinating Power Control and Performance Management for Virtualized Server
Clusters”, IEEE Transactions on Parallel and Distributed Systems, vol. 22, (2010), pp.245-259.
[7] J. Gueyoung, M.A. Hiltunen, K.R. Joshi, “Mistral: Dynamically Managing Power, Performance, and Adaptation Cost in Cloud Infrastructures”, 2010 IEEE 30th International Conference on Distributed Computing Systems (ICDCS),(2010).
[8] H. Nguyen, V., F.D. Tran, J.M. Menaud, “Performance and Power Management for Cloud Infrastructures”, 2010 IEEE 3rd International Conference on Cloud Computing (CLOUD), (2010), pp.329-336.
[9] R. Raghavendra, P. Ranganathan, V. Talwar, Z. Wang, X. Zhu, “No “power” struggles: coordinated multi-level power management for the data center”, SIGARCH Computer Architecture News, vol.36, (2008), pp. 48-59.
[10] S. Chaisiri, B-S Lee, D Niyato, “Optimal virtual machine placement across multiple cloud providers”, Proceedings of APSCC’2009, (2009), pp.103–110.
[11] G., Magklis, G. Semeraro, D.H. Albonesi, “Dynamic frequency and voltage scaling for a multiple-clock-domain microprocessor”, IEEE Micro, vol.23, (2003), pp.62-68.
[12] W.S. Cleveland, “Robust locally weighted regression and smoothing scatterplots”, Journal of the American Statistical Association, vol.74, (1979), pp.829-836.
[13] R. Buyya, R. Ranjan, R.N. Calheiros, “Modeling and simulation of scalable Cloud computing environments and the CloudSim toolkit: Challenges and opportunities”, International Conference on High Performance Computing & Simulation, (2009), pp.1-11.
Authors
Lijun Xu, He is currently a Ph.D. student in the School of Computer Science and Technology at Wuhan University of Technology and an associate professor at the Xinxiang University. He received his B.S. from Henan Normal University, Xinxiang, Henan,China, in 2001, and M.S. from the Wuhan University of Technology, Wuhan, Hubei, China, in 2007. He has worked at the Xinxiang University since 2001. His research interests include resource management in cloud computing environments and Computer network. He has published about 10 papers.
Xiaoqing Zhang, He is a lecturer of Wuhan Polytechnic University. He received an M.S. degree in Computer Science and Technology and the Ph.D. degree in Computer Application Technology from Wuhan University of Technology. His current research interests include cloud computing, the Internet of things and wireless sensor networks.