Y. Kambayashi, W. Winiwarter, M. Arikawa (Eds.): DaWaK 2002, LNCS 2454, pp. 232-244, 2002. © Springer-Verlag Berlin Heidelberg 2002
Warehouse Design
Pedro Bizarro and Henrique Madeira DEI-FCTUC
University of Coimbra 3030 Coimbra - Portugal
[bizarro, henrique]@dei.uc.pt
Abstract. Data warehouse design is clearly dominated by the business
perspective. Quite often, data warehouse administrators are lead to data models with little room for performance improvement. However, the increasing demands for interactive response time from the users make query performance one of the central problems of data warehousing today. In this paper we defend that data warehouse design must take into account both the business and the performance perspective from the beginning, and we propose the extension to typical design methodologies to include performance concerns in the early design steps. Specific analysis to predicted data warehouse usage profile and meta-data analysis are proposed as new inputs for improving the transition from logical to physical schema. The proposed approach is illustrated and discussed using the TPC-H performance benchmark and it is shown that significant performance improvement can be achieved without jeopardizing the business view required for data warehouse models.
1 Introduction
Data warehouses often grow to sizes of gigabytes or terabytes making query performance one of the most important issues in data warehousing. Performance bottlenecks have being tackled with better access methods, indexing structures, data reduction, parallelism, materialized views, and more. Although hardware and software power continuously increased, performance is still a central concern since the size of data is also continuously increasing.
Although it is possible to store the data warehouse in a multidimensional database server most of the data warehouses and OLAP applications store the data in a relational database. That is, the multidimensional model is implemented as one or more star schema formed by a large central fact table surrounded by several dimensional tables related to the fact table by foreign keys [1].
There are three different levels in a Data Warehouse (DW) development: conceptual, logical and physical. It is largely agreed that conceptual models should remain technology independent since their main goal is to capture the user intended needs. On the other end, going from the conceptual to the logical and physical schemes is almost always and semi-automated process. In this paper we argue that this path leads to sub-optimal physical schemes. Our view is that although the three
levels accomplish several degrees of independence, in the end the physical scheme is too much influenced by the conceptual model which will jeopardize performance.
In practice, current DW design methodologies are directed towards obtaining a model reflecting the real world business vision. Performance concerns are normally introduced very late in the design chain, as it is accepted that star schema represent a relatively optimized structure for a data warehouse. The designer attention is focused on the capture of the business model and the performance optimization is often considered an administrative task, something that will be tuned later on. In the end, the data warehouse designer is lead to a physical model in which there is almost no room for performance improvement. The DW administrator choices are reduced to the use of auxiliary data structures such as indexes, materialized views or statistics, which consume administration time, disk space and require constant maintenance.
In this paper we propose the extension of established DW design approaches [2] to include performance concerns in the early steps of the DW scheme design. This way, DW design takes into account both the business and the performance perspective from the beginning, and specific analysis to predicted DW usage profile and meta-data analysis is proposed to improve the transition from logical to physical schema.
The paper is organized as follows. Section 2 presents related work. Section 3 recalls current design methodologies and introduces our approach. In section 4 we present a motivating example and in section 5 we apply the design method to that example. Section 6 presents performance figures and section 7 concludes the paper.
2 Related Work
Improving performance has always been a central issue in decision support systems [3]. The race for performance has pushed improvements in many aspects of DW, ranging from classical database indexes and query optimization strategies to pre-computation of results in the form of materialized views and partitioning.
A number of indexing strategies have been proposed for data warehouses such as join indexes [4], bitmapped join indexes [5], and star joins [6] and most of these techniques are used in practice [6], [7], [5]. Although essential for the right tune of the database engine, the performance of index structures depends on many different parameters such as the number of stored rows, the cardinality of data space, block size of the system, bandwidth of disks and latency time, only to mention some [8].
The use of materialized views is probably the most effective way to accelerate specific queries in a data warehouse. Materialized views pre-compute and store (materialize) aggregates computed from the base data [9]. However, storing all possible aggregates causes storage space problems and needs constant attention from the database administrator.
Data reduction techniques have recently been proposed to provide fast approximate answers to OLAP queries [10]. The idea consists of building a small synopsis of the original data using sampling or histogram techniques. The size of the reduced data set is usually very small when compared to the original data set and the queries over the reduced data can be answered quite fast. However, the answers obtained from a reduced data set are only approximate and in most cases the error is large [11], which greatly limits the applicability of data reduction in the data warehouse context.
Many parallel databases systems have appeared both as research prototypes [12], [13], [14], [15] and as commercial products such as NonStop SQL fromTandem [16] or Oracle. However, even these “brute force” approaches have several difficulties when used in data warehouses such as the well-known problems of finding effective solutions for parallel data placement and parallel joins.
Recent work [17], [18] proposed the use of uniform data striping together with an approximate query answering to implement large data warehouses over an arbitrary number of computers, achieving nearly linear query speed up. Although very well adapted to data warehousing, these proposals still need massive parallel systems, which may be expensive and difficult to manage.
In spite of the numerous research directions to improve performance, the optimization of the data warehouse schema for performance has been largely forgotten. In [19] the use of vertical fragmentation techniques during the logical design of the data warehouse has been proposed, but the proposal of a design approach that takes into account both the business and the performance perspective in the definition of the data warehouse schema has not been proposed yet, to the best of our knowledge.
It is generally accepted that the star schema is the best compromise between the business view and performance view. We believe that usage profile and meta-data information can be used in early design stages to improve the data warehouse schema for performance and this is not contradictory with a data warehouse focused on the business view. This effort could lead to physical designs very far from the traditional star schema expected by most of the OLAP tools. However, the idea of having an intermediate layer to isolate queries from the physical details has already been proposed [20] and can also be used in our approach.
3 Data Warehouse Design: A Performance Perspective
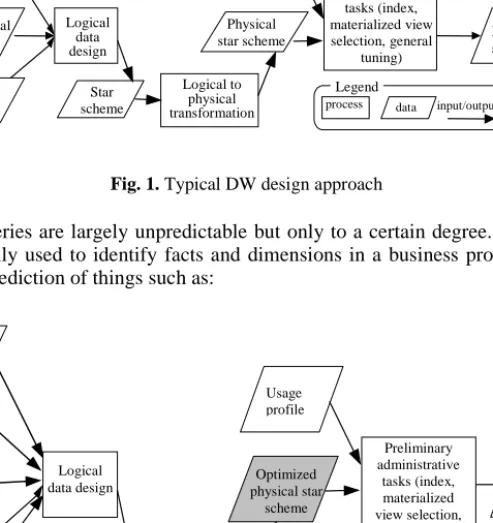
Data warehouse design has three main sources of input: the business view, data from operational systems (typically OLTP systems), and a set of design rules [2]. The outcome is a model composed by several stars. Latter in the process, administrative optimizations are made, such as selecting and creating indexes and materialized views. These optimizations are manly influenced by the real usage of the DW. Figure 1 represents this design approach.
The star scheme is so popular manly because it is especially conceived for ad hoc queries. It is also assumed that there is no reason to presume that any given query is more relevant or frequent than any other query. Or at least, this does not influence greatly the design process. We argue that even in decision support with ad hoc queries it is possible to infer (during the analysis steps) some data that describes or reveals characteristics of future most frequent queries. Meta-data can also provide significant insight on how to further optimize the scheme. This information is essential to improve data warehouse schema for performance and this does not jeopardizes the business view desired for the data warehouse.
The design approach should then be changed to incorporate these additional input parameters in the design process as early as possible. Figure 2 shows the proposed data warehouse design approach.
The next sections describe the new design inputs “predicted usage profile” and “meta-data” and how they influence the DW design.
Fig. 1. Typical DW design approach
User’s queries are largely unpredictable but only to a certain degree. The analysis method usually used to identify facts and dimensions in a business process can also help in the prediction of things such as:
Fig. 2. Proposed DW design process
• that some facts are asked more frequently than others;
• that some dimension attributes are seldom used while others are constantly used;
• that some facts, or some dimension attributes are used together while some will almost never be used together;
• that some mathematical operations will be frequent while others will not;
• etc.
The key word is frequent. After all, the main goal in any optimization is to improve the frequent case.
We
cannot use probability numbers to classify the likelihood of some DW data being asked. But at least we can use relative classifications and say “xPredicted usage profile Meta-data Business view Operational data Logical data design Optimized physical star scheme Usage profile Preliminary administrative tasks (index, materialized view selection, general tuning) Final star scheme Design rules Continuous DW administration Optimized star scheme Logical to physical transformation Legend
process data input/output Business view Operational data Logical data design Physical star scheme Usage profile Final star scheme Design rules Continuous DW administration Star scheme Logical to physical transformation Legend
process data input/output Preliminary administrative tasks (index, materialized view selection,general tuning)
is more likely to happen than y” or “x is much more likely to happen than z” or “the probability of w happen is almost zero”.
In general, what we want to know is which things (queries, restrictions, joins, mathematical operations, etc) are likely to happen frequently. We must schedule analysis meetings with users to uncover their most common actions, taking into account the business process and the typical decision support needs. This way the typical usage profile will be characterized to a certain degree, even if some knowledge is fuzzy. However, as we will see, even rough usage information can lead to significant performance improvement.
4 Motivation Example – TPC-H
The TPC Benchmark H (TPC-H) is a widely known decision support benchmark proposed by the Transaction Performance Processing Council [21]. Our idea is to illustrate the proposed approach using the business model of TPC-H. To do this we will redesign the original TPC-H scheme, preserving the business view but changing the scheme to take into account possible usage information and meta-data. Of course, the TPC-H “business” is not a real case (it is just a realistic example) but as we keep the business view and the TPC-H queries, this is a good way to exemplify our approach. At the same time, we will use the TPC-H queries to assess the improvements in performance.
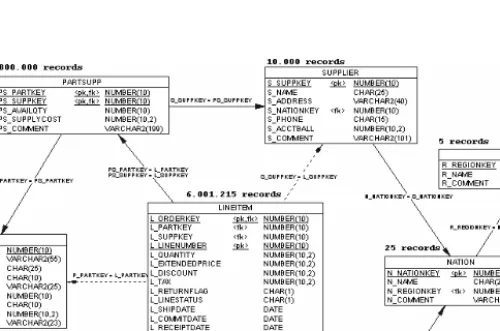
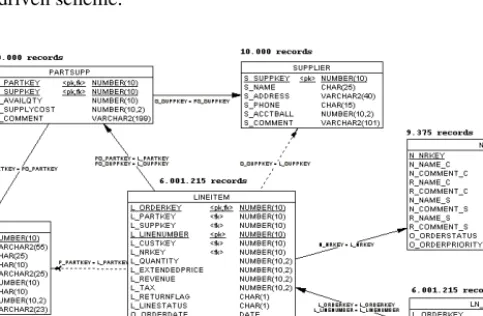
The TPC-H scheme consists in eight tables and their relations. Data can be scaled up to model businesses with different data sizes. The scheme and the number of rows for each table at scale 1 are presented in Figure 3.
The TPC-H represents a retail business. Customers order products, which can be bought from more than one supplier. Every customer and supplier is located in a nation, which in turn is in a geographic region. An order consists of a list of products sold to a customer. The list is stored in LINEITEM where every row holds information about one order line. There are several date fields both in LINEITEM and in ORDERS, which store information regarding the processing of an order (order date, ship date, commit date and receipt date). The central fact table in TPC-H is LINEITEM although PARSUPP can also be considered another fact table (in fact, TPC-H scheme is not a pure star scheme, as proposed by Kimball).
The dimensions are PART, SUPPLIER and ORDERS. There are two snowflakes, ORDERS→ CUSTOMER→ NATION→ REGION and SUPPLIER→ NATION→ REGION. Therefore, to find out in which region some LINEITEM has been sold it is necessary to read data from all the tables in the first snowflake.
5 Redesigning the Scheme towards Performance
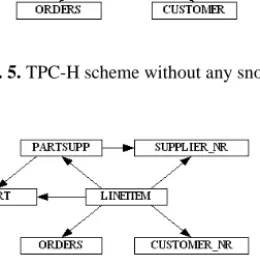
5.1 Tuning TPC-H in the Kimball’s WayThe TPC-H scheme is filled with real world idiosyncrasies and clearly there are improvements to be made. If one follows the guidelines of Kimball [1] the snowflakes must be removed since they lead to heavy run-time joins. A number of different schemes without the snowflakes or with smaller snowflakes can be devised. We show three of them in Figure 4, Figure 5 and Figure 6.
Fig. 4. TPC-H without snowflake from ORDERS to CUSTOMER
In Figures 4, 5, and 6, NR represents a join between NATION and REGION. Similarly CUSTMER_NR represents a join between CUSTOMER, NATION and REGION and finally SUPPLIER_NR represents a join between SUPPLIER, NATION and REGION.
The changes in these three schema are of two types: breaking snowflakes by transforming a snowflake table into a dimension (CUSTOMER in Figure 4 and Figure 5 and NR in Figure 5) and merging several tables into one bigger denormalized table (NR in Figure 4 and Figure 5, CUSTOMER_NR in Figure 6 and SUPPLIER_NR in Figure 6). It is possible to apply both techniques simultaneously.
Fig. 5. TPC-H scheme without any snowflake
Fig. 6. TPC-H scheme with CUSTOMER and SUPPLIER highly denormalized
All these alternative schemes break the connection between ORDERS and CUSTOMER. CUSTOMER is now a dimension of its own, and therefore, any query fetching data from both LINEITEM and CUSTOMER will not need to read from ORDERS as before. The gains are considerable because ORDERS is a huge table.
5.2 Assumptions in TPC-H Analysis
Breaking snowflakes and denormalizing dimensions are traditional steps, as proposed by Kimball. By analyzing the model from the point of view of “predicted usage data” and “meta-data” we will show that the scheme can be further improved.
A thorough analysis of the users’ needs cannot be done because TPC-H is a benchmark without real users. In what follows, we will consider that the TPC-H queries reflect closely the “predicted usage data”. Therefore, we are assuming that the most common accessed structures in the 22 TPC-H queries (tables, columns, restrictions, operations, etc) are also the most common in the “predicted usage data”.
5.3 Meta-data Analysis
Text attributes in a fact table (usually known as false facts), especially big strings, can degrade performance because they occupy too much space and normally are rarely used. In our example, TPC-H, the columns L_COMMENT, L_SHIPMODE and L_SHIPINSTRUCT are text attributes that occupy almost half the space in LINEITEM. However, the queries seldom read those attributes. Taking them out of LINEITEM will cause a slimmer fact table. That is especially good because almost every query reads the fact table. Similarly, O_COMMENT in ORDERS also occupies too much space and is rarely read. Removing O_COMMENT from ORDERS
improves the overall performance since it is the second largest table both in size as in accesses.
Big dimensions represent a problem in a star scheme because they are slow to browse and to join with the fact table. With mini-dimensions [1] it is possible to break a big dimensions into smaller ones. However, having many dimensions implies many foreign keys in the fact table, which are very expensive due to the fact table size. Thus the reverse procedure may be applied to join (using Cartesian product) two smaller dimensions into a bigger, hopefully not to big, dimension. It is also common to denormalize (using joins) a snowflake into just one bigger table.
In Figure 5, there are two dimensions for NR representing the customer nation and region and the supplier nation and region. Having two dimensions forces LINEITEM to have two foreign keys (FK). One way to remove one FK is to make a new dimension representing the Cartesian join between NR and NR. This new dimension (lets call it NRNR) will hold every possible combination of customer nation and supplier nation. It is not a regular denormalization because there is no join condition.
NATION has 25 lines and REGION has 5, therefore, NR has 25 lines (because is a join). NRNR is the result of a Cartesian join of two tables (customer’s NR and supplier’s) each with 25 rows. It will have 25*25 = 625 rows. Having NRNR allows to remove one FK from LINEITEM while still having a small dimension with only 625 rows. Dimensions this size fit entirely in memory and represent no downside.
Note that conceptually, having NR and NR merged into a dimension represents a rupture from the business perspective because unrelated information is mixed.
5.4 Predicted Usage Data Analysis 5.4.1 Removing Less Used Facts
The analysis of the TPC-H queries reveals that the attributes L_SHIPINSTRUCT, L_SHIPMODE and L_COMMENT, in LINEITEM, are almost never read. Thus, we created a new table, LN_EXTRA, to hold them. Since LN_EXTRA must still be related with LINEITEM, it also needs to hold LINEITEM’s primary key (PK) columns. The advantage of removing those three columns from LINEITEM is that queries reading it will find a slicker table. In this example, LINEITEM will be almost half its size after the removal of these columns. On the other hand, LN_EXTRA is a huge table with as many rows as LINEITEM. Queries reading LN_EXTRA fields will cause a join between LINEITEM and LN_EXTRA. However, the advantage surpasses the disadvantage because LINEITEM is queried every time where LN_EXTRA hardly is.
5.4.2 Frequently Accessed Dimensions
Due to the nature of the query patterns, some dimensions may also be hot spot places. If they are big it is especially important to tune them.
ORDERS is a huge table, which leads to slow joins and to slow queries. Furthermore ORDERS is frequently read. Small improvements in ORDERS will cause large or frequent gains. After analyzing the TPC-H queries, we noticed that by far, the most selected attribute in ORDERS is O_ORDERDATE. The field O_COMMENT is almost never selected, and O_TOTALPRICE, O_CLERK and
O_SHIPRIORITY are selected rarely. O_ORDERSTATUS and O_ORDER-PRIORITY appear frequently but not as much as O_ORDERDATE. Table 1 below shows the read frequencies of these columns and our changes to the scheme.
Table 1. Improvements due to ORDERS columns
Columns Read frequency Action and comments
O_ORDERDATE Very frequent Move to fact table
O_ORDERSTATUS,
O_ORDERPRIORITY Frequent
Move to NRNR; moving the hot spot from ORDERS to a smaller table
O_TOTALPRICE, O_CLERK, O_SHIPPRORITY
Rare Leave in ORDERS
O_COMMENT Very, very rare Move to LN_EXTRA
O_ORDERDATE was changed to LINEITEM since it is usually read whenever the other date fields in LINEITEM are. Remember that O_COMMENT was changed to LN_EXTRA. Another change was moving O_ORDERSTATUS and O_ORDER-PRIORITY to NRNR. Since ORDERS cannot be directly related with nations and regions, another Cartesian join is needed. However, O_ORDERSTATUS has only 3 distinct values and O_ORDERPRIORITY has only 5 distinct values (meta-data information!). Thus, the new NRNR table will hold 625 * 3 * 5 = 9375 rows, which is still small. Thus the hot spot focus was moved to a much smaller table (ORDERS is more than 150 times bigger than NRNR having 1,500,000 rows).
5.4.3 Fields Accessed Together/Apart
The previous changes benefited from the fact that only the columns in the same read frequency are usually accessed together. If that was not the case, spreading ORDERS’ columns all over the scheme would force run-time joins. For instance, with the new scheme, a query that reads both O_COMMENT, O_CLERK and O_ORDERSTATUS must join at run time LINEITEM, ORDERS, NRNR and LN_EXTRA. Therefore, the frequent access dimension analysis must be done together with the fields accessed together/apart analysis.
In the end, queries selecting O_ORDERDATE (and LINEITEM columns) will be faster than before because O_ORDERDATE is closer to where the other usually selected fields are. Queries to O_ORDERPRIORITY and O_ORDERSTATUS will also be faster because the NRNR dimension is very small and then joining it with LINEITEM is cheaper. Finally, queries to O_TOTALPRICE, O_CLERK and O_SHIPPRIORITY will also be faster because ORDERS is now a much thinner table. Only the very few queries to O_COMMENT will be slower.
5.4.4 Store Common Reads, Calculate Uncommon Reads
Avoid time mathematical calculations if you can. If needed trade frequent run-time operations for less frequent run-run-time mathematical operations.
In the example, almost all queries calculate revenue at run-time using the formula: L_EXTENDEDPRICE * (1 - L_DISCOUNT). An obvious improvement is to store the value of revenue, let’s call it L_REVENUE. The calculation will be done just once at load time. However, storing just L_REVENUE leads to the lost of information because it is not possible to determine the values of L_EXTENDEDPRICE and L_DISCOUNT. One better approach is to store not only L_REVENUE but L_EXTENDEDPRICE as well. This avoids the run-time calculation of L_REVENUE and still permits to compute the value of L_DISCOUNT
5.5 Optimized Star Scheme
Figure 7 presents our optimized scheme after all the changes mentioned so far. Note that Figure 7 depicts a rather uncommon schema. Some dimension attributes are out of their natural place, spread over other tables (both over dimensions and fact tables). Artificial tables like LN_EXTRA were created only to lighten the burden on other more frequently accessed tables. Even stranger is NRNR, a new dimension holding information from customer’s nation, customer’s region, supplier’s nation, supplier’s region, and some order’s information.
What is relevant is that Figure 7 scheme was a direct result of new design process, which accounts for predicted usage profile and meta-data information. We believe that current data warehouse design methodologies are unable to produce such performance driven scheme.
5.6 The Need of a Logical Level
The scheme of Figure 7 provides excellent performance results (see section 6). However, it models the business in a way that is not natural, at least from the end user’s perspective. One way to present the right business view to the user, in spite of having a different scheme at the physical level, is to have a layer in between to insulate the physical from the conceptual scheme. This layer has been already proposed in the literature [20].
6 Results
To measure improvements in performance it is necessary to adapt the queries to the new scheme and compare their results to the ones obtained before the changes were made. Due to time restrictions, only some of the queries were tested. Their results are presented in Table 2.
All performance figures where taken in a Win2000 box with a 300 MHz clock and 320 Mbytes of RAM using Oracle 8i (8.1.6) server. To the fairness of experiments, all queries were optimized using indexes, hints, and statistics (statement ANALYZE). From all possible plans of each query and its scheme only the best execution plans were considered. This also proved another interesting result: it was much easier to optimize the queries with the new scheme than with the original one. The main reason was that the new scheme, which is simpler, yields less execution plans.
Table 2. Comparison of results
Original Scheme Changed Scheme Times faster/slower
Query 1 204.1 s 264.2 s 1.29 times slower
Query 3 515.5 s 159.1 s 3.23 times faster
Query 4 398.3 s 61.6 s 6.47 times faster
Query 5 969.4 s 48.2 s 20.11 times faster
Query 6 78.9 s 49.6 s 1.59 times faster
Query 7 400.7 s 0.7 s 572.42 times faster
Query 8 239.9 s 47.7 s 5.03 times faster
Query 9 1661.2 s 1029.3 s 1.61 times faster
Query 10 471.1 s 257.9 s 1.86 times faster
Query 21 552.7 s 585.4 s 1.06 times slower
Regarding space, the main differences are due to LINEITEM, LN_EXTRA, ORDERS, NATION, REGION and NRNR. All the other tables and indexes are more or less the same in both schemes or its size is not relevant. Their space distribution is showed in Table 3.
Although the new scheme takes up more space, the hotspot part, the one with most of the reads, got 33% smaller.
Table 3. Differences in space
Original Scheme Changed Scheme
LINEITEM 757 Mb 550 Mb ORDERS 169 Mb 60 Mb NATION ≈ 0 Mb --REGION ≈ 0 Mb --NRNR -- 8 Hotspot Sub-Total 926 Mb 618 Mb LN_EXTRA -- 920 Mb Total 926 Mb 1538 Mb
7 Conclusions
DW performance is a major concern to end-users. However, performance considerations are typically introduced in the later stages of the DW design process. Almost every enhancement (new types of indexes, new types of joins, data reduction, sampling, real-time information, materialized views, histograms, statistics, query plan optimizations, etc) is applied after the physical scheme has been obtained.
We propose that data warehouse design must take into account both the business and the performance perspective from the early design steps. Specific analysis to predicted data warehouse usage profile and meta-data analysis are proposed as new inputs for improving the transition from logical to physical schema. Following this approach, the designer will face uncommon scheme options for performance optimization that do not directly portrait the business model, but still allow answering all queries. Some of these options break the fact or dimension frontiers. Examples are changing attributes from one table to another, splitting one big dimension into several smaller ones, merging several small dimensions into a bigger one, and placing in the same table attributes that are usually acceded together even if they belong to different entities. An intermediate software layer can used to allow schema optimization for performance without jeopardizing the business view required for data warehouse models at the end user level.
The TPC-H performance benchmark is used in the paper to illustrate and discuss the proposed approach. The execution of TPC-H queries in both the original and the optimized schema have shown that significant performance improvement can be achieved (up to 500 times).
References
1. R. Kimball, “The Data Warehouse Toolkit”, John Willey & Sons, Inc.; 1996.
2. R. Kimball et. al, “The Data Warehouse Lifecycle Toolkit”, Ralph Kimbal, Ed. J. Wiley & Sons, Inc, 1998
3. E. F. Codd, S. B. Codd, C. T. Salley. “Beyond decision support”. ComputerWorld, 27(30), July 1993.
4. P. Valduriez. “Join Indices”. ACM TODS, Vol 12, Nº 2, pp 218-246; June 1987.
5. P. O’Neil, D. Quass. “Improved Query Performance with Variant Indexes”. SIGMOD 1997.
6. “Star queries in Oracle8”. Technical White Paper, Oracle, 1997. Available at
http://technet.oracle.com/products/oracle8/htdocs/xsq4twp.htm, accessed in May 2001. 7. T. Flanagan and E. Safdie. “Data Warehouse Technical Guide”. White Paper, Sybase
1997.
8. Marcus Jurgens and Hans-J. Lenz. “Tree Based Indexes vs. Bitmap Indexes: A Performance Study”. Proceedings of the Int. Workshop DMDW’99, Heidelberg, Germany, 1999.
9. S. Chauduri and U. Dayal. “An overview of data warehousing and OLAP technology”. SIGMOD Record, 26(1):65-74, March 1997.
10. Joseph M. Hellerstein, “Online Processing Redux”. Data Engineering Bulletin 20(3): 20-29 (1997).
11. P. Furtado and H. Madeira. “Analysis of Accuracy of Data Reduction Techniques”. First International Conference, DaWaK’99, Florence, Italy, Springer-Verlag, pp.377-388. 12. H. Boral, W. Alexander, L. Clay, G. Copeland, S. Danforth, M. Franklin, B. Hart, M.
Smith & P. Valduriez. “Prototyping Bubba, A highly parallel database system”. IEEE Transactions on Knowledge and Data Engineering 2 (1990), 4-24.September 1990. 13. D. J. DeWitt et al.. “The Gamma Database Machine Project”. IEEE Trans. Knowledge and
Data Engineering, Vol. 2, Nº1, March 1990, pp.44-62.
14. G. Graefe. “Query evaluation techniques for large databases”. ACM Computing Surveys, 25(2):73-170, 1993.
15. Michael Stonebraker: “The Postgres DBMS”. SIGMOD Conference 1990: 394.
16. Tandem Database Group. “NonStop SQL: A Distributed, Performance, High-Availability Implementation of SQL”. HPTS 1987: 60-104.
17. J. Bernardino and H. Madeira, “Experimental Evaluation of a New Distributed Partitioning Technique for Data Warehouses”, IDEAS’01, Int. Symp. on Database Engineering and Applications, Grenoble, France, July, 2001.
18. J. Bernardino, P. Furtado, and H. Madeira, “Approximate Query Answering Using Data Warehouse Striping”, 3rd Int. Conf. on Data Warehousing and Knowledge Discovery, Dawak'01, Munich, Germany, 2001.
19. Matteo Golfarelli, Dario Maio, Stefano Rizzi, “Applying Vertical Fragmentation Techniques in Logical Design of Multidimensional Databases”, 2nd International Conference on Data Warehousing and Knowledge Discovery, Dawak'00, Greenwich, United Kingdom, September 2000.
20. L. Cabibbo, R. Torlone: “The Design and Development of a Logical System for OLAP”. DaWaK 2000: 1-10