Material and local buckling response of ferritic stainless steel sections
Bock Ma, Gardner Lb and Real Ea a
Department of Construction Engineering, Universitat Politècnica de Catalunya, UPC C/ JordiGirona, 1-3. 08034 Barcelona, Spain
b
Department of Civil and Environmental Engineering, Imperial College London, SW7 2AZ, UK
* Corresponding author: Tel: +0034 934054156, Fax: +0034 934054135, e-mail: [email protected]
Abstract
An investigation into the material response and local buckling behaviour of ferritic stainless steel structural cross-sections is presented in this paper. Particular attention is given to the strain hardening characteristics and ductility since these differ most markedly from the more common austenitic and duplex stainless steel grades. Based on collated stress-strain data on ferritic stainless steel, key aspects of the material model given in Annex C of EN 1993-1-4 [1] were evaluated and found to require adjustment. Proposed modifications are presented herein.
The local buckling behaviour of ferritic stainless steel sections in compression and bending was examined numerically, using the finite element (FE) package ABAQUS. The studied section types were cold-formed square hollow sections (SHS), rectangular hollow sections (RHS) and channels, as well as welded I-sections. The models were first validated against experimental data collected from the literature, after which parametric studies were performed to generate data over a wide range of section geometries and slendernesses. The obtained numerical results, together with existing experimental data from the literature were used to assess the applicability of the slenderness limits and effective width formulae set out in EN 1993-1-4 [1] to ferritic stainless steel sections.
The comparisons of the generated FE results for ferritic stainless steel with the design provisions of EN 1993-1-4 [1], highlighted, in line with other stainless steel grades, the inherent conservatism associated with the use of the 0.2% proof stress as the limiting design stress. To overcome this, the continuous strength method (CSM) was developed as an alternative design approach to exploit the deformation capacity and strain hardening potential of stocky cross-sections. An extension of the method to ferritic stainless steels, including the specification of a revised strain hardening slope for the CSM material model, is proposed herein. Comparisons with test and FE data showed that the CSM predictions are more accurate and consistent than existing provisions thus leading to significant material savings and hence more efficient structural design.
Keywords
Continuous strength method, Cross-section classification, Ferritic stainless steel, Finite element modelling, Slenderness limits, Stress-strain model.
1. Introduction
Stainless steels fall into five main categories, depending on their microstructure: ferritic, austenitic, martensitic, duplex and precipitation hardening. To date, the austenitic and duplex grades have been the most widely used in construction and have received the most attention from structural engineering researchers. Ferritic stainless steels differ from the austenitic and duplex grades in that they contain no nickel, hence their cost is lower and more stable. The key alloying element remains chromium which gives the material the ability to resist corrosion. In terms of mechanical properties, ferritic stainless steels have higher mechanical strengths than the austenitics in the annealed condition, and display a less rounded stress-strain response with lower ultimate-to-yield strength ratios. In general, ferritic stainless steels possess many of the advantages that the austenitics have over carbon steel but at a lower material cost, making them a more economic and sustainable alternative for a number of structural applications.
Despite the fact that the European structural design guidance for stainless steels, EN 1993-1-4 [1], includes three ferritic grades (1.4003, 1.4016 and 1.4512) the applicability of all aspects of the code to ferritic stainless steels is yet to be fully validated. With the benefit of a far greater pool of experimental data [2-11] than was available when EN 1993-1-4 [1] was published, and through the use of carefully validated finite element models, the applicability of the code to ferritic stainless steel is examined herein. In particular, focus is given to the material model given in Annex C of EN 1993-1-4 [1] and the slenderness limits and effective width formulations used for cross-section design. For the latter, the revised slenderness limits and effective width formulae proposed by Gardner and Theofanous [12] are also assessed. Finally, the continuous strength method, which is a deformation-based design approach that allows for the beneficial influence of strain hardening, is extended to cover ferritic stainless steel.
2. Material response 2.1 Material modelling
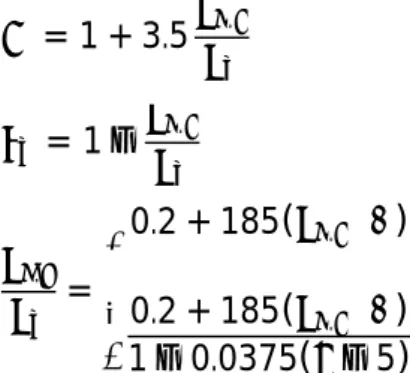
The nonlinear stress-strain response of metallic materials such as stainless steel and aluminum has traditionally been represented by Hill’s [13] modified version of the Ramberg-Osgood material model [14]. During recent years, structural applications of these materials have increased and therefore, so has the need to provide practising engineers and researchers with more accurate models to replicate their material response. The current material model presented in Annex C of EN 1993-1-4 [1] is based on Rasmussen’s modification [15] of the two-stage Ramberg-Osgood model presented by Mirambell and Real [16] and described in Eq. (1), where E is the Young’s modulus, E0.2 is the tangent modulus at the 0.2% proof stress 0.2, 0.2 is the total strain at the 0.2% proof stress, u is the ultimate tensile stress with its corresponding ultimate strain u and n and m are strain hardening exponents. Rasmussen [15] also proposed predictive expressions for some components of the model, reducing the number of required input parameters from six [16] to three. These predictive expressions, for m, uand u, are given by Eqs. (2)-(4), respectively.
= + 0.002 . . . + . . + . for . (1) for > .
= 1 + 3.5 . (2) = 1 . (3) . = 0.2 + 185( . ) 0.2 + 185( . ) 1 0.0375( 5)
for austenitic and duplex alloys
(4) for all alloys
Rasmussen [15] noted that the accuracy of the predictive model for u (Eq. (3)) may require further assessment because “it was not clear if the ultimate strain quoted in the references were the uniform elongation at the ultimate tensile strength, as was assumed, or the total strain after fracture including local elongation in the area of necking”. A reassessment of Eq. (3) was carried out in [7], where the accuracy of the predictive expression was confirmed for austenitic and duplex stainless steel, but the predictions were found to be less accurate for ferritic stainless steel. A proposed revision to Eq. (3) was made in [5] based on test data on ferritic stainless steel sheet material. In light of further available experimental data on a broader range of products, a revised expression is proposed herein.
2.2 Collection of experimental data
The results from a total of 135 material tests on ferritic stainless steel [2-9], where the strain at the ultimate tensile stress u was recorded, have been gathered. Additionally, 128 material tests conducted on austenitic stainless steel [5, 7, 17-22], 20 on duplex [5, 7, 20, 23] and 20 on lean duplex [7, 24] have also been considered for comparison purposes. A summary of the sources of the test data, the number of results, the product types and the material grades is provided in Table 1. Note that the collected experimental data includes results on sheet material as well as material extracted from the flat and corner regions of SHS, RHS, CHS (circular hollow sections) and I-sections.
Table 1. Summary of the available stainless steel material data Source Austenitic Ferritic Duplex Lean duplex
[2] - 60 sheets -
-[3] 2 flat parts (SHS)
1 flat part (RHS) -
-[4] - 4 sheets -
-[5] 14 sheets 14 sheets 14 sheets
-[6] - 9 sheets - -[7] 10 flat parts (SHS) 4 flat parts (RHS) 10 corners (SHS) 4 corners (RHS) 5 welds (SHS) 2 welds (RHS) 7 flat parts (SHS) 2 flat parts (RHS) 4 welds (SHS) 1 welds (RHS) 2 CHS 2 flat parts (SHS) 1 weld (SHS) 2 corners (SHS) [8] -8 flat parts (SHS) 8 flat parts (RHS) 2 corners (SHS) 2 corners (RHS) - -[9] - 6 CHS 5 welded I-sections - -28 flat parts (SHS)
Source Austenitic Ferritic Duplex Lean duplex 3 corners (SHS) 2 corners (RHS) [18] 2 flat parts (SHS) 1 CHS 1 corner (SHS) - - -[19] 2 flat parts (SHS) 4 flat parts (RHS) - - -[20] 2 sheets - 1 sheet -[21] 1 flat parts (SHS) 1 flat part (RHS) - - -[22] 6 sheet - - -[23] - - 3 sheet -[24] - - - 11 flat parts (SHS) 4 flat parts (RHS) Total 128 135 20 20
2.3 Assessment of the predictive expression for u
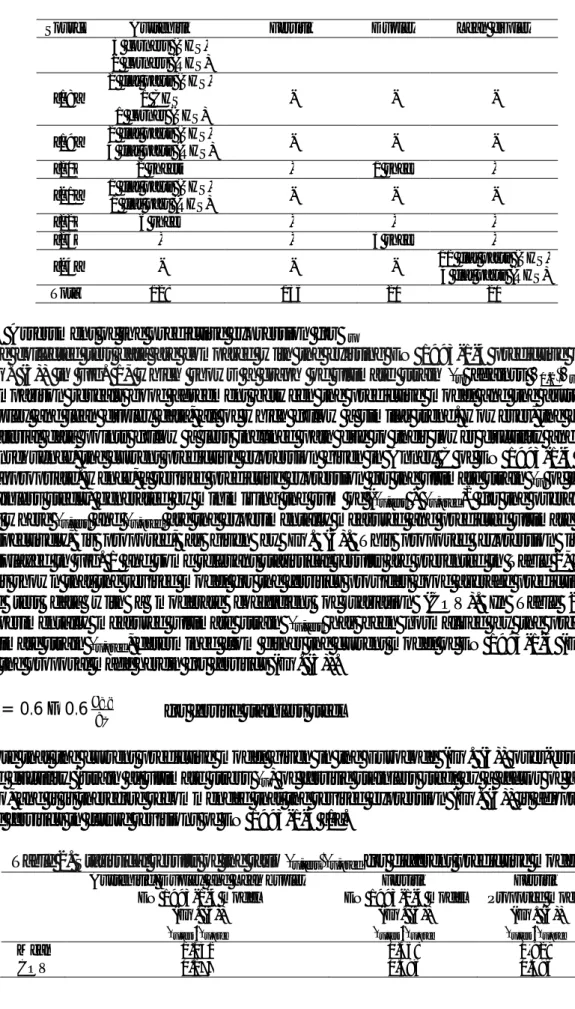
The collected test data are compared with the existing EN 1993-1-4 predictive model
(Eq. (3)) in Fig. 1, which shows a graph of ultimate strain u against 0.2 u. The
comparison reveals good agreement between the predictive model and the austenitic, duplex and lean duplex data, all of which follow a similar trend. However, the ferritic material data points follow a less inclined path due to their lower ductility and, as a consequence, the current predictive expression given in Annex C of EN 1993-1-4 [1] is inappropriate. Hence, a revised predictive expression for the ultimate strain u of ferritic stainless steels, generated by minimizing the sum of ( u,test - u,pred)2 for the overall data set where u,test and u,pred are the experimentally measured and predicted ultimate strain respectively, is proposed, as given by Eq. (5). This proposed expression is also displayed in Fig. 1 and some relevant statistical results are presented in Table 2, where it is shown that the revised model for the ferritics provides good average predictions of the test data with a moderate coefficient of variation (COV). In Table 2, the experimentally measured ultimate strain u,test has been normalized by the predicted ultimate strain u,pred, determined from either the current model of EN 1993-1-4 (Eq.(3)) or the proposal made herein for ferritics (Eq. (5)).
= 0.6 0.6 .
for ferritic stainless steel (5)
Note that the current predictive model given in the Eurocode (Eq. (3)) over-estimates the ductility (strain at ultimate stress u) of ferritic stainless steel by a factor of around two, and it is therefore recommended that the revised expression (Eq. (5)) is adopted for the ferritics in future revisions of EN 1993-1-4 [1].
Table 2. Statistical results of the ratio u,test u,predfor different predictive models
Austenitic, Duplex and Lean duplex EN 1993-1-4 model (Eq. (3)) Ferritic EN 1993-1-4 model (Eq. (3)) Ferritic Proposed model (Eq. (5))
u,test/ u,pred u,test/ u,pred u,test/ u,pred
Mean 1.041 0.558 0.929
Fig. 1 Comparison between ultimate strain u from material tests and predictive
expressions given in EN 1993-1-4 and proposed herein for ferritics in Eq. (5) 3. Numerical modelling of ferritic stainless steel cross-section behaviour 3.1 Introduction
In this section, the local buckling behaviour of ferritic stainless steel cross-sections is examined. In particular, the applicability of the slenderness limits and effective width formulae for slender cross-sections given in EN 1993-1-4 [1], as well as those proposed by Gardner and Theofanous [12], is assessed.
Numerical analyses were performed using the finite element programme ABAQUS. Stub column and 4–point bending models were firstly validated against existing experimental results [8, 9, 11, 17, 25, 26], and were subsequently used for parametric studies to expand the numerical data over a wider range of section geometries and slendernesses. The study covers compressed internal elements and outstand flanges in SHS, RHS, channels, and I-sections.
3.2 FE model
Owing to the thin-walled nature of the modelled cross-sections, and based on previous
studies concerning numerical analyses of metallic structures [27-31], the
general-purpose shell element S4R was used to discretise the models. Following the
recommendations of [32] concerning the minimum number of elements to employ in such buckling based problems, mesh convergence studies were conducted to determine an appropriate mesh density to achieve suitably accurate results while minimizing computational time. Hence, an element size equal to one twentieth of the largest plate width that makes up the cross-section was used for the flat parts, while the curved geometry of the corner regions of the cold-formed sections was approximated by 2 or 3 elements. Sharp corners were specified in the case of the I-sections.
Regarding the stub column models, all degrees of freedom were restrained at the end of cross-sections except vertical displacement at the loaded end, where a vertical deformation was applied to represent the loading. For the beam models, which featured SHS, RHS and I-sections, the cross-sections at the supports were defined as rigid bodies
0.0 0.2 0.4 0.6 0.8 1.0 0.0 0.2 0.4 0.6 0.8 1.0 u 0.2 u Austenitic Duplex Lean duplex Ferritic EN 1993-1-4 (Eq. (3))
rotation to simulate simple support conditions. The loads were evenly applied at third
points to simulate 4–point bending; the cross-sections at the load points were also
defined as rigid bodies to avoid web crippling.
The nonlinear material behaviour of stainless steel was introduced into ABAQUS by defining a multi-linear stress-strain curve based on the compound two-stage Ramberg-Osgood model [15, 16] included in Annex C of EN 1993-1-4 [1], specified in terms of true stresses true and logarithmic plastic strains pl,true as given by Eq. (6) where E is the Young’s modulus, and nom and nom are the engineering stress and strain, respectively.
= (1 + )
(6)
, = (1 + )
Initial geometric imperfections were incorporated into the FE models in the form of the lowest elastic eigenmode, with an amplitude w0 derived from the predictive expression of Eq. (7) [27, 33], where t is the plate thickness, 0.2 is the material 0.2% proof stress and cr is the elastic buckling stress of the cross-section plate elements assuming simply supported conditions. The influence of other imperfection amplitudes on the structural response of the generated models was studied in [34]. The geometrically and materially nonlinear analyses employed the modified Riks algorithm to trace the pre- and post-ultimate equilibrium response of the models.
= 0.023 . (7)
Residual stresses were not explicitly incorporated into the FE models due to their inherent partial (i.e. bending residual stresses) presence in the material properties extracted from manufactured profiles in the case of cold-formed sections [18, 35-37] and their limited influence on the behaviour of similar studied sections [25, 36, 38, 39]. For simplicity, and with little influence when the results are considered on a normalised basis, corner strength enhancements [40-43] were also omitted from the models.
3.3 Validation of the FE model
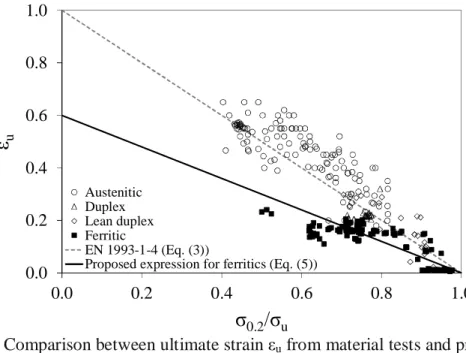
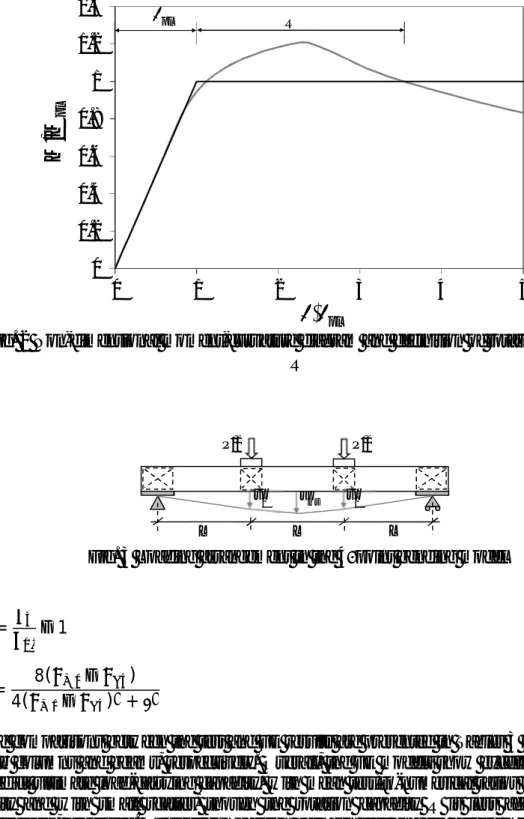
The ability of the FE model to replicate observed physical behaviour was assessed by comparison with existing experimental results on different stainless steel grades. The ultimate reported axial load Nu,test from the previous stub column tests [8, 9, 11, 17, 25, 26] as well as the ultimate experimental bending moment Mu,test and rotation capacity Ru,test from existing 4–point bending tests [8, 25] were compared with the equivalent numerical values Nu,num, Mu,num and Ru,num predicted by the FE model. The rotation capacity was defined by Eq. (8) where is the sectional curvature at the point at which the falling branch of the moment–curvature curve falls below the plastic moment resistance of the cross-section Mpl, and pl=Mpl/EI is the elastic portion of the total curvature corresponding to the plastic moment Mpl, as illustrated in Fig. 2. The curvature was determined [8, 18] from the central uniform moment region of the 4– point bending models through Eq. (9), where ums is the deflection at mid-span, uav is the average of the two vertical displacements at third points (uav=(u1+u2)/2), and L is the distance between those points, as shown in Fig. 3.
Fig. 2 Non-dimensional moment-curvature diagram and definition of rotation capacity R
Fig. 3 Loading arrangement in the 4 point bending model
= 1 (8)
=4(8( ) +) (9)
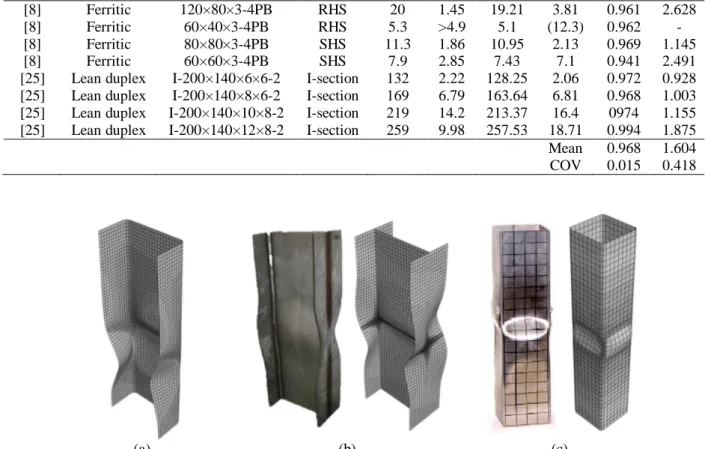
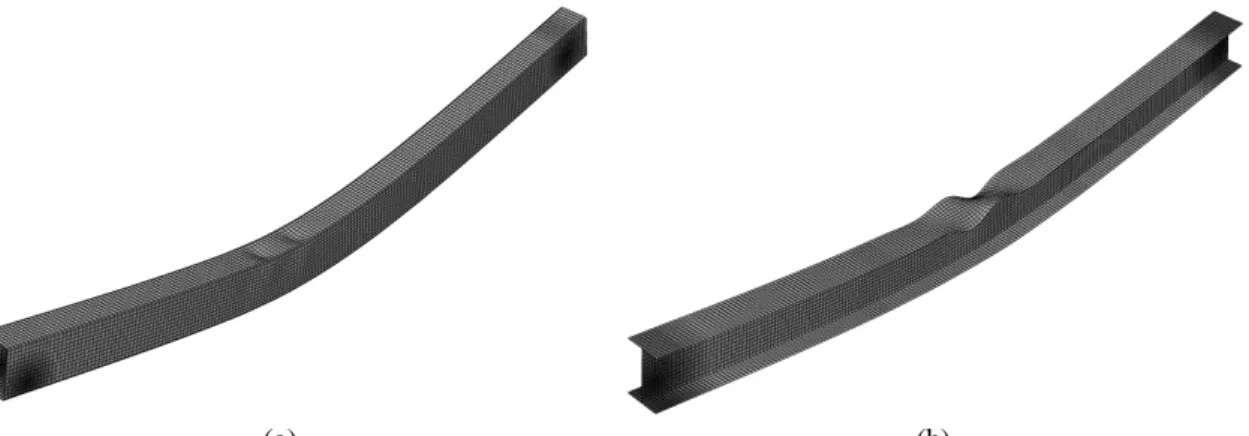
The comparisons between the test and FE results are presented in Tables 3 and 4 for the stub columns and beams, respectively. Overall, the FE models show excellent ability to predict ultimate load-carrying capacity, with mean test-to-numerical ratios very close to unity and with small scatter, though the rotation capacity R is less accurately, but acceptably, predicted. Typical comparison between test and FE failure modes for stub columns are shown in Fig. 4 where the observed test failure modes can be seen to be accurately captured by the FE models. FE failure models for the beams are shown in Fig. 5, which also mirror those observed in the corresponding tests [8, 25]. Hence, it is concluded that the FE models are appropriate to perform parametric studies.
0 0.2 0.4 0.6 0.8 1 1.2 1.4 0 1 2 3 4 5
M
/M
p l pl pl R ums L L L u1 u2 P/2 P/2Table 3. Comparison between numerical and experimental results for the stub column models
Source Stainless steel Reference Cross-section Nu,test (kN) Nu,num (kN) Nu,num/ Nu,test [17] Austenitic RHS100×50×2-SC2 RHS 181 175 0.967 [17] Austenitic SHS100×100×4-SC2 SHS 774 761 0.983 [8] Ferritic 80×80×3-1 SHS 392 381 0.972 [8] Ferritic 60×60×3-1 SHS 376 372 0.989 [8] Ferritic 120×80×3-1 RHS 449 468 1.042 [8] Ferritic 60×40×3-1 RHS 278 268 0.964
[25] Lean duplex I-200×140×6×6 I-section 1473 1464 0.994 [25] Lean duplex I-200×140×8×6 I-section 1849 1807 0.977 [25] Lean duplex I-200×140×10×8 I-section 2540 2495 0.982 [25] Lean duplex I-200×140×12×8 I-section 2978 2859 0.960 [9] Ferritic ISC140×80 I-section 680 695 1.022 [11] Austenitic I-160×160-SC I-section 1440 1510 1.049 [26] Austenitic SC-2C2 Channel 134 127 0.948 [26] Austenitic SC-2C4 Channel 156 166 1.064 [26] Austenitic SC-4C1 Channel 186 173 0.930 [26] Austenitic SC-4C3 Channel 234 219 0.936 Mean 0.986 COV 0.038
Table 4. Comparison between numerical and experimental results for the 4 point bending models Source Stainless steel Reference Cross-section Mu,test (kNm) Rtest Mu,num (kNm) Rnum Mu,num/ Mu,test Rnum/ Rtest [8] Ferritic 120×80×3-4PB RHS 20 1.45 19.21 3.81 0.961 2.628 [8] Ferritic 60×40×3-4PB RHS 5.3 >4.9 5.1 (12.3) 0.962 -[8] Ferritic 80×80×3-4PB SHS 11.3 1.86 10.95 2.13 0.969 1.145 [8] Ferritic 60×60×3-4PB SHS 7.9 2.85 7.43 7.1 0.941 2.491 [25] Lean duplex I-200×140×6×6-2 I-section 132 2.22 128.25 2.06 0.972 0.928 [25] Lean duplex I-200×140×8×6-2 I-section 169 6.79 163.64 6.81 0.968 1.003 [25] Lean duplex I-200×140×10×8-2 I-section 219 14.2 213.37 16.4 0974 1.155 [25] Lean duplex I-200×140×12×8-2 I-section 259 9.98 257.53 18.71 0.994 1.875 Mean 0.968 1.604 COV 0.015 0.418
(a) (b) (c)
Fig. 4 Typical deformed shapes from FE models for (a) a channel, (b) an I-section [25] and (c) an SHS [17] under compression (stub column models), including comparisons,
(a) (b)
Fig. 5 Typical deformed shapes of (a) an RHS and (b) an I-section under bending (4 point bending models)
3.4 Parametric studies
Having validated the FE models, further numerical analyses were conducted to generate results over a wider range of geometries and local slendernesses to assess the applicability of the slenderness limits and effective width formulae for the treatment of local buckling of compressed internal elements and outstand flanges given in EN 1993-1-4 [1], as well as those proposed by Gardner and Theofanous [12], to ferritic stainless steel. The parametric study included 320 stub column models and 108 4–point bending models. For the stub column models, the overall length of all the specimens was set equal to three times the largest cross-section dimension whereas for the 4–point bending models, the span remained constant at 1000 mm. The cross-section geometries were chosen, as detailed below, to cover all four cross-section classes.
A total of 21 different SHS and 12 RHS were modelled. The height of the SHS ranged from 40 to 140 mm, whereas for the RHS, cross-section aspect ratios from 1.3 to 2 were considered by varying the width from 60 to 80 mm and the height between 80 and 120 mm. For both types of cross-sections (SHS and RHS), the thickness was varied between 1.5 and 3 mm, giving internal element width-to-thickness ratios c/t ranging from 8.8 to 77.9 where =[(235/ 0.2)(E/210000)]0.5. The range of channel section geometries was generated by varying the height from 37 to 155 mm, the flange width from 28.5 to 80 mm and the thickness from 1 to 5 mm. For the I-sections, the web height ranged from 40 to 100 mm, the flange width was varied from 70 and 100 mm, and the considered thicknesses ranged from 3 to 4 mm and from 0.95 to 6 mm for the web and the flange, respectively. A total of 46 outstand flange width-to-thickness ratios c/t were covered with values ranging from 7.8 to 45.7.
The material properties adopted in the FE models to simulate the behaviour of ferritic stainless steel sections were based on the average material properties given in EN 1993-1-4 [1] with the following values: Young’s modulus E=200GPa, 0.2% proof stress 0.2=250MPa, strain hardening parameters n=10 and m=3 and finally, in order to study the influence of material strain hardening, four different ultimate stresses u were considered ( u=275, 300, 350 and 450MPa) which provided u 0.2 ratios ranging from 1.1, which is the lower limit of the ductility requirement in [44], up to 1.8. Discussion of the numerical results is presented in the following section.
4. Analysis of cross-section resistance results 4.1 General
In the following sub-sections, the obtained numerical results, combined with existing experimental data on ferritic stainless steels [8-10], are analysed and used to assess the applicability of the slenderness limits and effective width formula (i.e. local buckling reduction factor ) provided in EN 1993-1-4 [1] to ferritic stainless steel internal elements and outstand flanges. In addition, the revised slenderness limits and effective width formula proposed by Gardner and Theofanous [12] are also considered (labelled as G&T in Figs 6-14). The reported weighted average material properties were used in the analysis of the existing experimental results.
4.2 Class 3 slenderness limit and effective width formulation
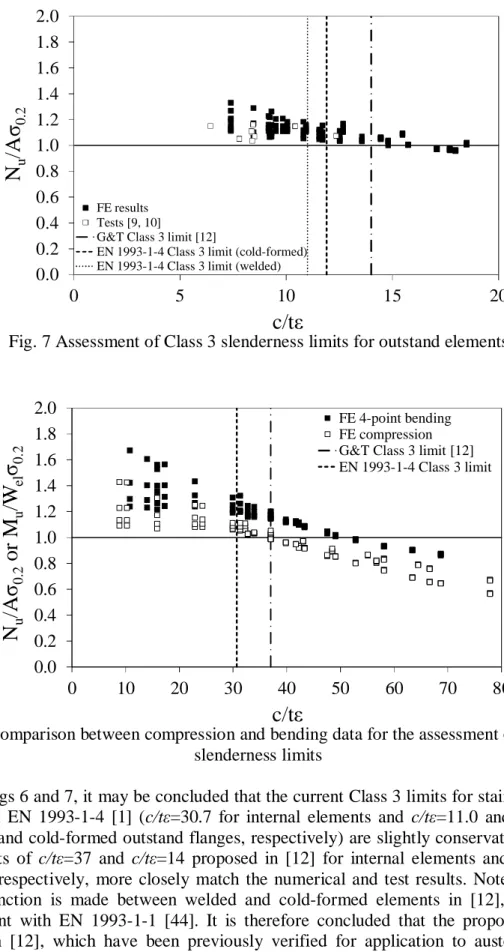
The obtained numerical results from the stub column models and existing tests [8-10] are used in this sub-section to assess the Class 3 limits and effective width formulae given in [1, 12] for application to ferritic stainless steel elements. Figs 6 and 7 show the relevant response characteristic Nu/A 0.2 for internal and outstand elements respectively, where Nu is the ultimate load achieved in the FE models or tests, A is the gross cross-sectional area and 0.2 is the 0.2% proof strength, plotted against the slenderness of the most slender constituent element of the cross-section, expressed by the parameter c/t where c is the compressed flat element width, t is the element thickness and is the material factor =[(235/ 0.2)(E/210000)]0.5 given in EN 1993-1-4 [1]. The corresponding Class 3 limits given in EN 1993-1-4 [1] and [12] are also shown. Note that a cross-section is deemed to be Class 3 (or better) if Nu exceeds A 0.2. Results from the 4–point bending models could also have been used for the assessment of the Class 3 limits where the relevant response characteristic is the ultimate bending moment Mu normalised by the elastic moment capacity Mel, defined as the product of the elastic section modulus Wel and the 0.2% proof strength 0.2. A value of Mu/Wel 0.2 greater than unity would indicate a Class 3 (or lower) section. However, as shown in Fig. 8, assessment based on compression data leads to a stricter Class 3 limit, and this is therefore used in the present study; this approach has also been used in previous investigations [45].
Fig. 6 Assessment of Class 3 slenderness limits for internal elements 0.0 0.2 0.4 0.6 0.8 1.0 1.2 1.4 1.6 1.8 2.0 0 10 20 30 40 50 60 70 80
N
u/A
0 .2c/t
FE results Tests [8-10]G&T Class 3 limit [12] EN 1993-1-4 Class 3 limit
Fig. 7 Assessment of Class 3 slenderness limits for outstand elements
Fig. 8 Comparison between compression and bending data for the assessment of Class 3 slenderness limits
From Figs 6 and 7, it may be concluded that the current Class 3 limits for stainless steel given in EN 1993-1-4 [1] (c/t =30.7 for internal elements and c/t =11.0 and 11.9 for welded and cold-formed outstand flanges, respectively) are slightly conservative, while the limits of c/t =37 and c/t =14 proposed in [12] for internal elements and outstand flanges respectively, more closely match the numerical and test results. Note also that no distinction is made between welded and cold-formed elements in [12], which is consistent with EN 1993-1-1 [44]. It is therefore concluded that the proposed limits given in [12], which have been previously verified for application to austenitic and duplex stainless steel, may also be applied to ferritic grades.
0.0 0.2 0.4 0.6 0.8 1.0 1.2 1.4 1.6 1.8 2.0 0 5 10 15 20
N
u/A
0 .2c/t
FE results Tests [9, 10]G&T Class 3 limit [12]
EN 1993-1-4 Class 3 limit (cold-formed) EN 1993-1-4 Class 3 limit (welded)
0.0 0.2 0.4 0.6 0.8 1.0 1.2 1.4 1.6 1.8 2.0 0 10 20 30 40 50 60 70 80
N
u/A
0 .2o
r
M
u/W
el 0 .2c/t
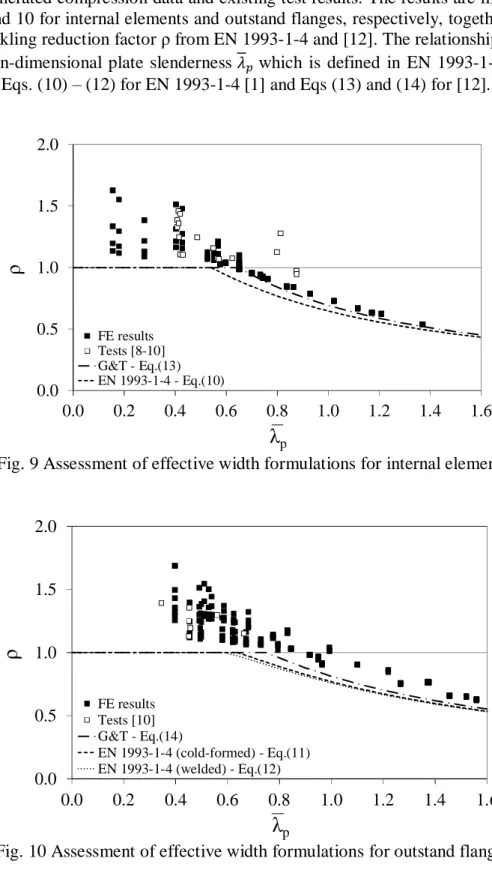
FE 4-point bending FE compression G&T Class 3 limit [12] EN 1993-1-4 Class 3 limitThe effective width formulae given in EN 1993-1-4 [1] and [12] to allow for local buckling prior to the attainment of the 0.2% proof stress are also evaluated on the basis of the generated compression data and existing test results. The results are illustrated in Figs 9 and 10 for internal elements and outstand flanges, respectively, together with the local buckling reduction factor from EN 1993-1-4 and [12]. The relationships between and non-dimensional plate slenderness which is defined in EN 1993-1-5 [46], are given by Eqs. (10) (12) for EN 1993-1-4 [1] and Eqs (13) and (14) for [12].
Fig. 9 Assessment of effective width formulations for internal elements
Fig. 10 Assessment of effective width formulations for outstand flanges
From Figs 9 and 10, it can be concluded that both sets of effective width formulations [1, 12] are adequate for ferritic stainless steels, though those proposed in [12] (Eqs. (13) and (14)) enable more efficient structural design.
0.0 0.5 1.0 1.5 2.0 0.0 0.2 0.4 0.6 0.8 1.0 1.2 1.4 1.6 p FE results Tests [8-10] G&T - Eq.(13) EN 1993-1-4 - Eq.(10) 0.0 0.5 1.0 1.5 2.0 0.0 0.2 0.4 0.6 0.8 1.0 1.2 1.4 1.6 p FE results Tests [10] G&T - Eq.(14) EN 1993-1-4 (cold-formed) - Eq.(11) EN 1993-1-4 (welded) - Eq.(12)
= . . 1 for internal elements with 0.541[1] (10)
= . 1 for cold-formed outstand flanges with 0.637 [1] (11)
= . 1 for welded outstand flanges with 0.589 [1] (12)
= . . 1 for internal elements with 0.651 [12] (13)
= . 1 for outstand flanges with 0.748 [12] (14)
4.3 Class 2 and Class 1 slenderness limits
The obtained numerical ultimate capacities from the 4–point bending models, together with previous [8] bending test results, have been used to assess the applicability of the Class 2 slenderness limits specified in EN 1993-1-4 [1] and those proposed in [12] to ferritic stainless steel. The ultimate bending moment Mu achieved in the FE models and tests has been normalized by the plastic moment capacity Mpl, defined as the plastic section modulus Wpl multiplied by the material 0.2% proof stress 0.2 and plotted against the slenderness parameterc/t of the compression flange of the beams in Figs 11 and 12 for internal elements and outstand flanges, respectively. From Fig. 11, the EN 1993-1-4 [1] Class 2 limit for internal elements (c/t =26.7) is observed to be safe, but the proposed slenderness limit in [12] (c/t =35) may be more appropriate. For outstand flanges (Fig. 12), the EN 1993-1-4 Class 2 limits of c/t =9.4 (welded) and 10.4 (cold-formed) and the single proposed limit [12] ofc/t =10 are very similar, and both provide a good representation of the ferritic stainless steel data.
Fig. 11 Assessment of Class 2 slenderness limits for internal elements 0.0 0.2 0.4 0.6 0.8 1.0 1.2 1.4 1.6 1.8 2.0 0 10 20 30 40 50 60 70 80
M
u/W
p l 0 .2c/t
FE results Tests [8]G&T Class 2 limit [12] EN 1993-1-4 Class 2 limit
Fig. 12 Assessment of Class 2 slenderness limits for outstand flanges
For the appraisal of the Class 1 slenderness limits, the rotation capacity R, defined by Eq. (8), obtained from the FE models and tests is plotted against the c/t ratio of the compression flange of the beams, as shown in Figs 13 and 14 for internal elements and outstand flanges, respectively. The rotation capacity requirement for plastic design of carbon steel structures of R=3 [47] is also shown in the figures, and assumed to apply to stainless steel structures, though it should be noted that EN 1993-1-4 [1] does not currently permit plastic design. One of the key controlling parameters of the rotation capacity response is the ultimate-to-yield strength ratio u 0.2 of the material [47]; this point is emphasized in Fig. 13, where the trends of the FE results for varying u 0.2 ratios are shown. From the figure, it can be observed that the proposed Class 1 limit in [12] (c/t =33) is appropriate for ferritic stainless steel exhibiting higher u 0.2 ratios but optimistic when u 0.2 1.2. In the latter case, the EN 1993-1-4 [1] limit ofc/t =25.7) may be more appropriate. For outstand flanges (Fig. 14), both the EN 1993-1-4 [1] Class 1 limits of c/t =9 (welded) and 10 (cold-formed) and the proposed limit [12] of c/t =9 are suitable for ferritic stainless steel.
Fig. 13 Assessment of Class 1 slenderness limits for internal elements 0.0 0.2 0.4 0.6 0.8 1.0 1.2 1.4 1.6 1.8 2.0 0 5 10 15
M
u/W
p l 0 .2c/t
FE resultsG&T Class 2 limit [12]
EN 1993-1-4 Class 2 limit (cold-formed) EN 1993-1-4 Class 2 limit (welded)
0 3 6 9 12 0 10 20 30 40 50
R
c/t
FE results Tests [8] FE =1.8 FE =1.4 FE =1.2 FE =1.1 G&T Class 1 limit [12] EN 1993-1-4 Class 1 limitu 0.2
u 0.2
u 0.2
Fig. 14 Assessment of Class 1 slenderness limits for outstand flanges
5. The Continuous Strength Method 5.1 General
The current European design rules for stainless steel given in EN 1993-1-4 [1] assume elastic, perfectly plastic material behavior with the maximum attainable stress limited to the 0.2% proof stress; this idealized material model clearly deviates substantially from the actual material response of stainless steel. As a consequence, the concept of cross-section classification which is underpinned by the elastic, perfectly plastic material behaviour is not ideally suited for application to nonlinear materials and can lead to significant underestimates of ultimate capacity, particularly for stocky cross-sections, which are able to attain stresses far beyond the 0.2% proof stress 0.2.
The continuous strength method (CSM) has been developed as an alternative design approach [48-51] that enables material strain hardening properties to be exploited. The key features of the CSM are (1) the base curve, which defines the limiting CSM strain csm that a cross-section can endure and (2) the strain hardening material model. These two components have been developed for austenitic and duplex stainless steels [51], for which the method is included in the AISC Design Guide 30 [52], but not yet verified for ferritic stainless steel.
5.2 CSM base curve
The CSM base curve, given by Eq. (15), provides a continuous relationship between the normalized cross-section deformation capacity csm y, where y 0.2/E is the material yield strain, and the cross-section slenderness, , given by Eq. (16) where cr is the elastic buckling stress of either the full cross-section or its most slender constituent plate element. The elastic buckling stress may be determined by numerical methods [53] or approximate analytical methods [54] for the full cross-section or by the classical analytical expression for individual plates [1, 46]. The two former procedures, which are used in the direct strength method (DSM) [55], allow for interaction between the elements within the cross-section whereas the latter assumes simple support conditions at the plate edges resulting in a lower-bound (conservative) prediction of cr. Clearly more favourable results will be achieved by considering element interaction, and this is
0 3 6 9 12 15 18 21 24 27 30 0 2 4 6 8 10 12 14
R
c/t
FE resultsG&T Class 1 limit [12]
EN 1993-1-4 Class 1 limit (cold-formed) EN 1993-1-4 Class 1 limit (welded)
= .. but 15,0.1 for austenitic and duplex grades (15)
= . (16)
The base curve (Eq. (15)) is illustrated in Fig. 15 and applies when 0.68, which is the boundary between slender and non-slender sections [51]. The CSM normalised deformation capacity csm y is limited to the minimum of either 15, which is related to the material ductility requirement according to EN 1993-1-1 [44] and prevents excessive strains, or 0.1 u y, where u is the strain at the ultimate stress of the material. This latter boundary relates to the adopted bilinear material model and was set to avoid over-predictions of CSM material strength for austenitic and duplex stainless steel [51]. A revised value may be required for ferritic stainless steels, as discussed later. The collected experimental data shown in Fig. 15 represents maximum strains achieved in stub column and bending tests on a variety of materials. The comparisons show that the base curve provides good predictions of cross-section deformation capacities for all the considered materials, including ferritic stainless steel.
Fig. 15 Current design base curve for the CSM
5.3 CSM material model
The CSM elastic, linear hardening stress-strain model has been previously verified for austenitic and duplex stainless steels [51]. Below 0.2, elastic behaviour is assumed, though note that the influence of material nonlinearity has been accounted for by deducting 0.2% strain from test cross-section deformation capacity for the development of the base curve. Above 0.2, the linear hardening behaviour defined by Eq. (17) applies, where Esh is the material strain hardening slope given, for austenitic and duplex stainless steels, by Eq. (18).
= . + 1 (17)
= .
. for austenitic and duplex stainless steel (18)
0 5 10 15 20 0.0 0.2 0.4 0.6 0.8 1.0 1.2 c sm
/
yCSM base curve (Eq. (15)) Carbon steel Austenitic Duplex Lean duplex Ferritic p
The determination of the material strain hardening slope within the CSM utilises two definition points: the yield stress point ( y, 0.2) and a maximum stress point ( max, max), as shown in Fig. 16. The maximum stress is taken as the ultimate tensile stress u, while the maximum strain is taken, for austenitic and duplex stainless steel as 16% of the ultimate tensile strain u. Note that max is not simply taken as u since, for the adopted linear hardening material model, this would result in a significant under-estimation of the strain hardening slope for the strain levels of interest in the design of structural elements such as beams and columns. However, due to the lower ductility and the different characteristic shape of the stress-strain curve (see Fig. 1), the previously determined value for max (=0.16 u) was found to be unsuitable for ferritic stainless steels. Thus, a revised value for max upon which to base the determination of the strain hardening slope Esh for the ferritic grades was sought. This was achieved through a process of least squares regression based on the available material test data, which was summarised in Table 1. Note that the linear hardening slope was initially fitted through the points ( y+0.002, 0.2) and ( max+0.002, u) and then translated by 0.002 to give the final CSM material model, as shown in Fig. 16. Recall that a revised predictive model for the ultimate strain for ferritic stainless steel (Eq. (5)) was developed in Section 2.3; this is also utilised here. The resulting expression for Esh is given by Eq. (19) on the basis of max=0.45 u, with a cut-off of 0.4 u, applied to avoid over-prediction of the material strength, and included in the base curve – Eq. (20).
= .
. if < 0.45, else = 0 for ferritic stainless steel (19)
=0.25. but 15,0.4 for ferritic stainless steel (20)
Fig. 16 CSM elastic, linearly hardening material model for ferritic stainless steel
5.4 CSM resistance functions
The CSM characteristic resistance functions for I-shaped and SHS/RHS cross-sections under pure compression Ncsm,Rk and pure bending (My,csm,Rk for major axis bending and Mz,csm,Rkfor minor axis bending) are given by Eqs. (21) – (23), respectively [50, 51]. In
S
tr
es
s
Strain
Stress-strain curve CSM model Fitted model u 0.2 y 0.4 u 0.45 u max+0.002) 0.002 Esh E y+0.002, 0.2) y, 0.2) max, max), = (21) , , = , . 1 + , , 1 1 , , (22) , , = , . 1 + , , 1 1 , , (23)
In the following sub-section, the predictions from the CSM resistance functions, together with the revised strain hardening slope Esh, are compared with test and FE data on ferritic stainless steel cross-sections.
5.5 Comparison with design rules
The predictions of the CSM with the revised strain hardening slope Esh for application to ferritic stainless steel are compared with both existing test results [8-10] and the numerical results generated in the present study. Capacity predictions according to EN 1993-1-4 [1] are also determined. All comparisons utilise the measured geometric and material properties with all partial safety factors set to unity, while Nu,pred and Mu,pred represent the predicted axial and bending resistances from the two design methods. The comparisons are presented in Figs. 17 and 18 for compression and bending, respectively, where the CSM may be seen to provide an improved mean prediction and a reduced scatter compared to EN 1993-1-4 [1]. Key statistical values concerning mean predictions and coefficient of variation (COV) of the CSM and EN 1993-1-4 [1] relative to the tests [8, 9] and numerical results are given in Tables 5 and 6 for compression and bending, respectively. The reliability of the CSM for ferritic stainless steel is assessed in the following sub-section.
Table 5. Key statistical values of the comparison for stub columns Tests [8-10] FE models
EN 1993-1-4 CSM EN 1993-1-4 CSM
Nu,test/Nu,pred Nu,test/Nu,pred Nu,FE/Nu,pred Nu,FE/Nu,pred
Mean 1.125 1.079 1.141 1.090
COV 0.045 0.037 0.064 0.059
Fig. 17 Comparison of predicted resistances by CSM and EN 1993-1-4 for stub columns 0.0 0.2 0.4 0.6 0.8 1.0 1.2 1.4 1.6 0.0 0.2 0.4 0.6 0.8
N
u/N
u ,p re d p Tests [8-10]-to-EN 1993-1-4 FE models-to-EN 1993-1-4 Tests [8-10]-to-CSM FE models-to-CSMTable 6. Key statistical values of the comparison for beams Tests [8] FE models
EN 1993-1-4 CSM EN 1993-1-4 CSM
Mu,test/Mu,pred Mu,test/Mu,pred Mu,FE/Mu,pred Mu,FE/Mu,pred
Mean 1.372 1.141 1.296 1.112
COV 0.074 0.040 0.092 0.062
Fig. 18 Comparison of predicted resistances by CSM and EN 1993-1-4 for beams
5.6 Reliability analysis
A statistical analysis was conducted according to EN 1990 Annex D [56] to assess the reliability of the CSM proposals for ferritic stainless steels. Tables 7 and 8 summarise the key statistical parameters for the CSM comparisons with experimental and FE results, respectively, including the number of tests and FE simulations, the design (ultimate limit state) fractile factor kd,n, the average ratio of test (or FE)-to-model resistance based on a least squares fit to all the data b, the coefficient of variation of the tests and FE simulations relative to the resistance model V , the combined coefficient of variation incorporating both model and basic variable uncertainties Vr, and the partial safety factor M0. The material overstrength was taken as 1.2 for the ferritic material with a COV of material strength 0.045, in accordance with [57]. Variation in geometric properties also followed the recommendation in [57]. The analysis showed that the required partial factors are all less than the currently adopted value of M0=1.1 used in
EN 1993-1-4 [1]. This partial factor may therefore be safely applied.
Table 7. Summary of CSM reliability analysis based on ferritic stainless steel experimental results
Specimens No. of tests kd,n b V Vr M0
Stub columns 13 4.078 1.079 0.036 0.080 1.00
Beams 8 5.076 1.137 0.043 0.083 0.99
Table 8. Summary of CSM reliability analysis based on ferritic stainless steel FE simulations
Specimens No. of FE simulations kd,n b V Vr M0
0.0 0.2 0.4 0.6 0.8 1.0 1.2 1.4 1.6 1.8 0.0 0.2 0.4 0.6 0.8
M
u/M
u ,p re d p Tests [8]-to-EN 1993-1-4 FE models-to-EN 1993-1-4 Tests [8]-to-CSM FE models-to-CSM6. Conclusions
An investigation into the material response and structural performance of ferritic stainless steel structural elements has been conducted. Collected material data on ferritic stainless steel [2-9] has been analysed and used to assess the predictive expression given in Annex C of EN 1993-1-4 [1] for ultimate strain u. The results show that the current predictive model is inappropriate for ferritics and yields unconservative results. A revised expression suitable for ferritic stainless steels has been proposed.
The structural response of cold-formed ferritic stainless steel cross-sections has also been examined and the applicability of the current slenderness limits and effective width formulae of EN 1993-1-4 [1] and those proposed by Gardner and Theofanous [12] to ferritic stainless steel has been assessed. To this end, a finite element model was developed in ABAQUS, validated against existing test results from the literature [8, 9, 11, 17, 25, 26] and subsequently used to perform parametric studies. The assessments were made on the basis of both existing experimental data on ferritic stainless steels [8-10] and the FE results generated herein. It was shown that the Class 2 and Class 3 slenderness limits and the effective width formulae of EN 1993-1-4 [1] are adequate for application to ferritic stainless steel internal elements and outstand flanges, though those proposed in [12] more closely represent the numerical and test results enabling more efficient design. For the Class 1 slenderness limit, it was observed that the proposed value in [12] is satisfactory for ferritic stainless steel sections when u 0.2 > 1.2, but the stricter EN 1993-1-4 [1] Class 1 slenderness limit may be more appropriate when u 0.2 1.2. Table 9 summarises the slenderness limits given in EN 1993-1-4 [1], those revised by Gardner and Theofanous [12] and the recommendations given herein for ferritic stainless steel internal elements and outstand flanges in compression.
Table 9. Summary of the slenderness limits based on the c/t values for compressed elements
Type of element EN 1993-1-4 [1]
Revised limits by Gardner and Theofanous [12]
Recommended value for ferritics Class 1 Class 2 Class 3 Class 1 Class 2 Class 3 Class 1 Class 2 Class 3 Internal elements u 0.2>1.2 25.7 26.7 30.7 33 35 37 33 35 37 u 0.2 1.2 25.7 26.7 30.7 33 35 37 25.7 35 37 Outstand flanges Welded 9 9.4 11 9 10 14 9 10 14 Cold-formed 10 10.4 11.9 9 10 14 9 10 14
The results from the above assessment highlighted the conservatism associated with the usage of an elastic, perfectly plastic material model, limited to the 0.2% proof stress, which is assumed in EN 1993-1-4 [1]. The continuous strength method (CSM), which is a deformation-based design approach that allows for the beneficial influence of strain hardening beyond the 0.2% proof strength, and was extended herein to ferritic stainless steel. The available material data on ferritic stainless steel was used to determine new values for the slope Esh of the linear hardening material model adopted in the CSM, suitable for this type of material. A reliability analysis was also conducted to statistically verify the applicability of the method. Ultimate capacity predictions by EN 1993-1-4 [1] and the CSM of existing test results [8-10] and the numerical results generated in the present study showed that the latter achieves more precise predictions enabling a more efficient design.
Acknowledgements
The research leading to these results has received funding from the European Community’s Research Fund for Coal and Steel (RFCS) under Grant Agreement No. RFSR-CT-2010-00026, Structural Applications for Ferritic Stainless Steels, from Ministerio de Ciencia e Innovación to the Project BIA2010-11876-E “Acciones complementarias” and from Ministerio de Economía y Competitividad to the Project BIA 2012-36373 “Estudio del comportamiento de estructuras de acero inoxidable ferrítico”. The first author would like to acknowledge the financial support provided by the Secretaria d’Universitats i de Recerca del Departament d’Economia i Coneixement de la Generalitat de Catalunya i del Fons Social Europeu. Special thanks are given to Petr Hradil from VTT Technical Research Centre of Finland who has contributed in the FE modelling.
References
[1] EN 1993-1-4. Eurocode 3: Design of steel structures – Part 1–4: General rules – Supplementary rules for stainless steels. Brussels: European Committee for Standardization (CEN); 2006.
[2] Manninen T, Säynäjäkangas J. Work package 1: Characterization of the stress-strain behavior. Report to the RFCS Project - Structural applications of ferritic stainless steel (SAFSS). Contract no. RFSR-CT-2010-00026. Finland: Outokumpu Stainless Oy, Tornio Research Centre; 2012.
[3] Talja A, Hradil P. Work package 2: Model calibration tests - Test Report. Report to the RFCS Project - Structural applications of ferritic stainless steel (SAFSS). Contract no. RFSR-CT-2010-00026. Finland: VTT Technical Research Centre of Finland; 2011. [4] Real E, Arrayago I, Mirambell E, Marimon F, Ferrer M. Work package 3: Decking tests in the construction stage. Report to the RFCS Project - Structural applications of ferritic stainless steel (SAFSS). Contract no. RFSR-CT-2010-00026. Spain: Universitat Politècnica de Catalunya (UPC); 2013.
[5] Arrayago I, Real E, Mirambell E. Constitutive equations for stainless steels: Experimental tests and new proposal. Proceedings of the 5th international conference on structural engineering, mechanics and computation (SEMC 2013); 2013 Sep 2-4; Cape Town, South Africa: CRC Press; 2013. p. 1435-40.
[6] Rossi B. Mechanical behavior of ferritic grade 3Cr12 stainless steel – Part 1: Experimental investigations. Thin-Walled Structures 2010;48:553-60.
[7] Afshan S, Rossi B, Gardner L. Strength enhancements in cold-formed structural sections – Part I: Material testing. Journal of Constructional Steel Research 2013;83:177-88.
[8] Afshan S, Gardner L. Experimental study of cold-formed ferritic stainless steel hollow sections. Journal of Structural Engineering (ASCE) 2013;139:717-728.
[9] Stangenberg H. Work package 6: Ferritic stainless steel. Report to the ECSC Project - Development of the use of stainless steel in construction. Contract no. 7210 SA/ 842. Germany: Studiengesellschaft Stanhlanwendung; 2000.
[10] Bredenkamp PJ, van den Berg GJ. The strength of stainless steel built-up I-section columns. Journal of Constructional Steel Research 1995;34:131-144.
[11] Stangenberg H. Work package 3: Classification of stainless steel welded I-sections and cold formed sheeting made of stainless steel. Report to the ECSC Project -Development of the use of stainless steel in construction. Contract no. 7210 SA/ 842. Germany: Studiengesellschaft Stanhlanwendung; 2000.
[12] Gardner L, Theofanous M. Discrete and continuous treatment of local buckling in stainless steel elements. Journal of Constructional Steel Research 2008;64:1207-16. [13] Hill HN. Determination of stress–strain relations from offset yield strength values. Technical note No 927. Washington DC: National advisory committee for aeronautics; 1944.
[14] Ramberg W, Osgood WR. Description of stress–strain curves by three parameters, 1943. Technical note No 902, Washington DC: National advisory committee for aeronautics; 1943.
[15] Rasmussen KJR. Full-range stress-strain curves for stainless steel alloys. Journal of Constructional Steel Research 2003;59:47-61.
[16] Mirambell E, Real E. On the calculation of deflections in structural stainless steel beams: an experimental and numerical investigation. Journal of Constructional Steel Research 2000;54:109-33.
[17] Gardner L, Nethercot DA. Experiments on stainless steel hollow sections, Part – 1: Material and cross-sectional behaviour. Journal of Constructional Steel Research 2004;60:1291-318.
[18] Rasmussen KJR, Hancock GJ. Design of cold-formed stainless steel tubular members II: Beams. Journal of Structural Engineering (ASCE) 1993;119:2368-86. [19] Talja A, Salmi P. Design of stainless steel RHS beams, columns and beam-columns. VTT Research Note 1619. Finland: VTT Technical Research Centre of Finland; 1995.
[20] Olsson A. Stainless steel plasticity – material modelling and structural applications [dissertation]. Sweden: Luleå University of Technology; 2001.
[21] Real E. Aportaciones al estudio del comportamiento a flexión de estructuras de acero inoxidable [dissertation]. Spain: Universitat Politècnica de Catalunya (UPC); 2001. Spanish.
[22] Estrada I. Shear design of stainless steel plate girders [dissertation]. Spain: Universitat Politècnica de Catalunya (UPC); 2005.
[23] Burns T, Bezkorovainy P. Buckling of stiffened stainless steel plates [dissertation]. Sydney: University of Sydney; 2001.
[24] Theofanous M, Gardner L. Testing and numerical modelling of lean duplex stainless steel hollow section columns. Engineering Structures 2009;31:3047-58.
[25] Saliba N, Gardner L. Cross-section stability of lean duplex stainless steel welded I-sections. Journal of Constructional Steel Research 2013;80:1-14.
[26] Kuwamura H. Local buckling of thin-walled stainless steel members. Steel Structures 2003;3:191-201.
[27] Gardner L, Nethercot DA. Numerical modeling of stainless steel structural compo-nents – a consistent approach. Journal of Structural Engineering (ASCE) 2004;130:1586-601.
[28] Rasmussen KJR, Burns T, Bezkorovainy P, Bambach MR. Numerical modelling of stainless steel plates in compression. Journal of Constructional Steel Research 2003;59:1345-62.
[29] Ellobody E, Young B. Structural performance of cold-formed high strength stainless steel columns. Journal of Constructional Steel Research 2005;61:1631-49. [30] Rossi B, Jaspart J, Rasmussen KJR. Combined distortional and overall flexural-torsional buckling of cold-formed stainless steel sections: Design. Journal of Structural Engineering (ASCE) 2010;136:361-69.
[31] Ashraf M, Gardner L, Nethercot DA. Finite element modelling of structural stainless steel cross-sections. Thin-Walled Structures 2006;44:1048-62.
[32] Schafer BW, Peköz T. Computational modeling of cold-formed steel: characterizing geometric imperfections and residual stresses. Journal of Constructional Steel Research 1998;47:193-210.
[33] Dawson RG, Walker AC. Post-buckling of geometrically imperfect plates. Journal of the Structural Division (ASCE) 1972;98(ST1):75-94.
[34] Bock M, Real E, Mirambell E. Work package 2: Structural performance of steel members - Report on preliminary FEM study: Local buckling. Report to the RFCS Project - Structural applications of ferritic stainless steel (SAFSS). Contract no. RFSR-CT-2010-00026. Spain: Universitat Politècnica de Catalunya (UPC); 2011.
[35] Jandera M, Gardner L, Machacek J. Residual stresses in cold-rolled stainless steel hollow sections. Journal of Constructional Steel Research 2008;64:1255-63.
[36] Cruise RB, Gardner L. Residual stress analysis of structural stainless steel sections. Journal of Constructional Steel Research 2008;64:352-66.
[38] Young B, Lui WM. Behavior of cold-formed high strength stainless steel sections. Journal of Structural Engineering (ASCE) 2005;131:1738-45.
[39] Theofanous M, Gardner L. Experimental and numerical studies of lean duplex stainless steel beams. Journal of Constructional Steel Research 2010;66:816-825.
[40] Cruise RB, Gardner L. Strength enhancements induced during cold forming of stainless steel sections. Journal of Constructional Steel Research 2008;64:1310-6. [41] Rossi B. Mechanical properties, residual stresses and structural behavior of thin-walled stainless steel profiles [dissertation]. Belgium: University of Liège; 2008.
[42] Ashraf M, Gardner L, Nethercot D. Strength enhancement of the corner regions of stainless steel cross-sections. Journal of Constructional Steel Research 2005;61:37-52. [43] Rossi B, Afshan S, Gardner L. Strength enhancements in cold-formed structural sections – Part II: Predictive models. Journal of Constructional Steel Research 2013;83:189-96.
[44] EN 1993-1-1. Eurocode 3: Design of steel structures – Part 1–1: General rules and rules for building. Brussels: European Committee for Standardization (CEN); 2005. [45] Gardner L, Saari N, Wang F. Comparative experimental study of hot-rolled and cold-formed rectangular hollow sections. Thin-Walled Structures 2010;48:495-507. [46] EN 1993-1-5. Eurocode 3: Design of steel structures – Part 1–5: Plated structural elements. Brussels: European Committee for Standardization (CEN); 2006.
[47] Sedlacek G, Feldmann M. The b/t-ratios controlling the applicability of analysis models in Eurocode 3, Part 1.1. Background Document 5.09 for chapter 5 of Eurocode 3, Part 1.1. Germany: Aachen; 1995.
[48] Gardner L. The continuous strength method. Proceedings of the Institution of Civil Engineers-Structures and Buildings 2008;161:127-33.
[49] Su M, Young B, Gardner L. Continuous beam tests on aluminum alloy SHS and RHS with internal stiffeners. Proceedings of the 5th international conference on structural engineering, mechanics and computation (SEMC 2013); 2013 Sep 2-4; Cape Town, South Africa: CRC Press; 2013. p. 1113-7.
[50] Gardner L, Wang F, Liew A. Influence of strain hardening on the behavior and design of steel structures. International Journal of Structural Stability and Dynamics 2011;11:855-75.
[51] Afshan S, Gardner L. The Continuous Strength Method for structural stainless steel design. Thin-Walled Structures 2013;68:42-49.
[52] AISC Design Guide 30: Structural Stainless Steel. American Institute of Steel Construction; 2012.
[53] Schafer B, Ádány S. Buckling analysis of cold-formed steel members using CUFSM: conventional and constrained finite strip methods. The 18th international specialty conference on cold-formed steel structures; 2006. p. 39-54.
[54] Seif M, Schafer BW. Local buckling of structural steel shapes. Journal of Constructional Steel Research 2010;66:1232-47.
[55] Schafer BW. Review: the direct strength method of cold-formed steel member design. Journal of Constructional Steel Research 2008;64:766-78.
[56] EN 1990. Eurocode – basis of structural design. Brussels: European Committee for Standardization (CEN); 2002.
[57] Afshan S, Francis P, Baddoo NR, Gardner L. Reliability analysis of structural stainless steel design provisions. . Journal of Constructional Steel Research 2015 [submitted for publication].
![Fig. 6 Assessment of Class 3 slenderness limits for internal elements0.00.20.40.60.81.01.21.41.61.82.001020304050607080Nu/A0.2c/tFE resultsTests [8-10]](https://thumb-us.123doks.com/thumbv2/123dok_us/628752.2575724/10.892.199.709.404.1081/fig-assessment-class-slenderness-limits-internal-elements-resultstests.webp)
![Fig. 11 Assessment of Class 2 slenderness limits for internal elements0.00.20.40.60.81.01.21.41.61.82.001020304050607080Mu/Wpl0.2c/tFE resultsTests [8]](https://thumb-us.123doks.com/thumbv2/123dok_us/628752.2575724/13.892.162.687.86.984/fig-assessment-class-slenderness-limits-internal-elements-resultstests.webp)