Green, D
and
Skeoch, S
and
Alexander, MY
and
Kalra, PA
and
Parker, B
(2017)
The Association of Baseline and Longitudinal Change in Endothelial
Microparticle Count with Mortality in Chronic Kidney Disease.
Nephron, 135
(4). pp. 252-260. ISSN 1660-8151
Downloaded from:
http://e-space.mmu.ac.uk/620901/
Version:
Accepted Version
Publisher:
Karger
DOI:
https://doi.org/10.1159/000452344
Please cite the published version
The Association of Baseline and Longitudinal
Change in Endothelial Microparticle Count with
Mortality in Chronic Kidney Disease
Darren Green
a, e
Sarah Skeoch
b
M. Yvonne Alexander
c
Philip A. Kalra
a, e
Ben Parker
b, d
a Institute of Population Health, and b Centre for Musculoskeletal Research, Institute of Inflammation and Repair,
University of Manchester, c Healthcare Science Research Centre, Manchester Metropolitan University, and d NIHR Manchester Musculoskeletal Biomedical Research Unit, Central Manchester University Hospital NHS
Foundation Trust and Manchester Academic Health Science Centre, Manchester , and e Vascular Research Group,
Salford Royal Foundation Trust, Salford , UK
systolic blood pressure 135 ± 18 mm Hg, eGFR 32 ± 16 mL/ min/1.73 m 2 ). The median baseline EMP count was 144/μL
(range 10–714/μL). EMPs were numerically the highest in au-tosomal dominant polycystic kidney disease (253 [41–610]). An increase in urine protein:creatinine ratio was associated with an increase in EMP (co-efficient 0.21, p = 0.02). The ad-justed HR for all-cause mortality for EMP was 8.20 (1.67–40.2,
p = 0.01) and for δEMP was 2.69 (0.04–165, p = 0.64). There was no association between EMP or δEMP and cardiovascu-lar events. Conclusion: Although EMP count was a signifi-cant marker of mortality risk, longitudinal change was not. This may reflect disease-specific EMP behaviour and the lim-itation of EMP as a generalised biomarker in CKD.
© 2017 S. Karger AG, Basel
Introduction
Chronic kidney disease (CKD) is associated with ad-verse cardiovascular outcome. Thirty-eight percent of di-alysis patients have evidence of coronary artery disease [1] , and the life expectancy of a 25-year-old dialysis pa-tient is 12 years compared to 52 years in the general pop-ulation [2] .
Key Words
Chronic kidney disease · Endothelial microparticle · Cardiovascular disease · Survival
Abstract
Background: Chronic kidney disease (CKD) is associated with a unique milieu of vascular pathology, and effective biomarkers of active vascular damage are lacking. A candi-date biomarker is the quantification of circulating endothe-lial microparticles (EMPs). This study observed baseline and longitudinal EMP change (δEMP) and established the asso-ciation of these with all-cause mortality and cardiovascular events in CKD. Method: An observational study in adults with CKD (estimated glomerular filtration rate [eGFR] <60 mL/min/1.73 m 2 ). EMPs were quantified by flow cytometry
of platelet poor plasma in 2 samples 12 months apart and categorised as EMP if AnnexinV+/CD31+/CD42b– EMPs were compared between primary renal diagnoses, and cor-relations between EMP/δEMP and other parameters made. Adjusted hazard ratios (HRs) for time to all-cause mortality and cardiovascular events were calculated for log-trans-formed EMP and δEMP using a Cox proportional hazard model. Results: There were 123 patients (age 63 ± 11 years,
It is generally agreed that this increased morbidity and mortality burden is not by way of “traditional” cardiovas-cular risk factors such as hyperlipidaemia and smoking. As a result, biomarkers of cardiovascular disease activity or prognosis in CKD are often different to those seen in the general population. For example, lipid-lowering ther-apy is less efficacious in CKD than the general population [3] , and low serum lipids are more often a marker of mal-nutrition than of effective therapy in advanced CKD [4] . Non-atheromatous pathways to cardiovascular dis-ease include chronic inflammation, hyperparathyroid-ism, and endothelial dysfunction [5–8] . CKD is associ-ated with high circulating biomarkers of chronic inflam-mation, such as C-reactive protein (CRP) and interleukin-6 [9] . However, these are not specific to vascular dysfunc-tion. What may prove to be of greater clinical utility are emerging biomarkers of pathological vascular endothe-lial activity [10–12] .
One potential candidate is a group of circulating vesi-cles known as endothelial micropartivesi-cles (EMP). EMPs are membrane-bound anuclear vesicles shed by the vas-cular endothelium in response to a number of potential triggers such as shear stress or inflammation [13] . EMPs carry a number of activation and functional proteins, such as the angiogenic vascular endothelial growth factor and the vascular cell adhesion molecule (VCAM), which often reflect the underlying trigger that led to micropar-ticle release [14] . Elevated EMPs have been associated with subclinical vascular damage including increased aortic pulse wave velocity (PWV), increased common ca-rotid media thickness and endothelial dysfunction [15] . Elevated numbers of these particles have been reported in association with a number of diseases such as an increased risk of acute coronary syndrome and cardiovascular death [16] , hypertension [17] , pre-eclampsia [18] and metabolic syndrome [19] . EMPs also have prognostic po-tential having been shown to correlate with clinical re-sponse to therapy in systemic lupus erythematosus [20] , and predict adverse events in otherwise stable coronary artery disease [16] . In CKD, higher circulating levels of EMP have been found in haemodialysis patients com-pared to pre-dialysis CKD, peritoneal dialysis and healthy controls [21–23] . In haemodialysis patients, EMPs and other microparticles have been shown to correlate with arterial vascular stiffness measured by PWV and aug-mentation index (AIx) [24] .
No study appears to have longitudinally measured EMPs in CKD, nor correlated changes in EMPs with con-current longitudinal changes in estimated glomerular fil-tration rate (eGFR). Alongside this, variation in levels and
behaviour of EMPs between different primary renal diag-noses causing CKD are not understood. This is a vital consideration given that CKD is a common clinical man-ifestation of multiple disease entities rather than a singu-lar disease state. Understanding any potential role of EMP as a biomarker in CKD may require disease-specif-ic considerations.
The aims of this study, therefore, were to explore differ-ences in EMP count and longitudinal change in EMP (δEMP) between different primary renal diseases, and to observe the association of absolute EMP count and δEMP with (1) absolute and longitudinal changes in eGFR and other possible markers of CKD-associated cardiovascular risk such as hyperparathyroidism, inflammation and anae-mia; (2) vascular stiffness as measured by AIx; and (3) long-term clinical outcome, particularly cardiovascular events.
Method
This was a sub-study of the Salford Kidney Study, a single-cen-tre, longitudinal, observational study of patients with stage 3 to 5 CKD referred to an adult secondary care nephrology outpatient clinic [25, 26] .
Patients
Patients were approached for inclusion in the study if aged >18 years and with eGFR <60 mL/min/1.73 m 2 , and enrolled if written
informed consent was gained. Patients were excluded from this sub-study if they had a history of any previous cardiovascular event including during the time between baseline and repeat EMP sampling (myocardial infarction, stroke, limb or gut ischaemia, coronary or peripheral revascularisation, hospitalisation for heart failure or symptomatic arrhythmia), or if they had a history of smoking. A target of 125 patients was then sought to include 25 patients in each of 5 primary renal disease categories (c-antineu-trophil cytoplasmic antibody [cANCA] vasculitis, IgA nephropa-thy, diabetic nephropanephropa-thy, hypertensive nephrosclerosis, autoso-mal dominant polycystic kidney disease [ADPKD]). These were chosen to cover inflammatory and non-inflammatory renal dis-ease, and proteinuric and non-proteinuric diseases. The diagnoses were histological in cANCA and IgA disease, based on imaging in APKD, and either histological or presumed diagnoses in diabetic and hypertensive disease. In cases diagnosed as being diabetic ne-phropathy without biopsy, we necessitated the presence of pro-teinuria (urine protein:creatinine ratio [uPCR] >100 g/mol) and diabetic retinopathy. A diagnosis of hypertensive disease without biopsy was made on the basis of hypertension, evidence of end-organ damage elsewhere such as left ventricular hypertrophy on echocardiography, and the absence of urinary sediment or evi-dence of an alternative diagnosis. This, we acknowledge, is a less robust approach than using only biopsy-proven cases, but better reflects real-life practice. Patients with cANCA vasculitis or IgA nephropathy were included only if they were on maintenance im-munosuppression and not initiation therapy, and if antibody was negative at the time of consent in the case of cANCA. Twenty-five
consecutive patients with each primary disease who met these in-clusion and exin-clusion criteria were then targeted for inin-clusion in this analysis.
Clinical Parameters
At the time of enrollment, patients were assessed for blood pres-sure (BP), demographic data, Karnofsky Performance Score, past medical history, prescribed medication, pulse wave analysis (PWA) and standard biochemical laboratory profile including MDRD cal-culated eGFR. An additional platelet poor plasma (PPP) citrate sample was collected and frozen at –80 ° C for EMP quantification
in batches. All laboratory samples, including PPP, were repeated at a second visit after 12 months. Patients were followed up for a min-imum of 12 months after second visit and outcome data was col-lected by way of mortality data, including cause of death, sourced from the United Kingdom Office of National Statistics.
Pulse Wave Analysis
PWA was assessed by applanation tonometry using a Spygmo-Cor ® (AtCor Medical, West Ryde, NSW, Australia). The primary measure of aortic vascular stiffness in this study was AIx corrected for ejection duration and heart rate. Patients underwent assessment after they had been recumbent for a 5 min period of rest in the same position. Readings were recorded from the non-dominant arm.
PPP Preparation
PPP was generated by 2 step centrifuge, first at 1,700 g for 10 min before harvesting of plasma and at 20,000 g for 20 min to harvest PPP. The frozen samples were thawed at room tempera-ture for 20 min before use.
Flow Cytometry
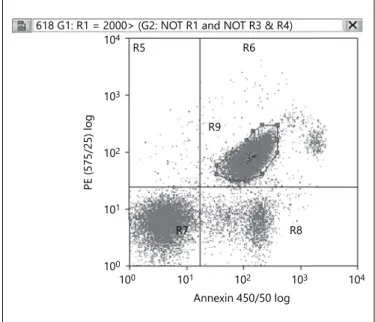
EMP quantification was performed by flow cytometry, the de-tailed methodology having been described previously [20] . In short, PPP was incubated with phycoerythrin-conjugated antihu-man CD31 (BD Pharminogen 55546, BD Biosciences, New Jersey, USA), allophycocyanin-conjugated antihuman CD42b (BD Phar-minogen 551061, BD Biosciences, New Jersey, USA) and efluor450 Annexin-V marker (Annexin V Apoptosis Detection Kit eBiosci-ence, UK), with the addition of 10 μm diameter counting beads (Flow-Count TM Fluorospheres; Beckman Coulter, UK). Flow
cy-tometry was performed using the Beckman Coulter Cyan ADP flowcytometer and analysed using Summit version 4.3 software, with gates set to exclude artefact and beads. EMPs were considered microparticles (MPs) that were positive for CD31 and Annexin V but negative for CD42b (CD31+/AnnexinV+/CD42b– EMPs) and quantified as MPs per microlitres. A sample output of EMPs in the Summit software is found in Figure 1 .
Statistical Method
Descriptive statistics is presented as mean ± one SD for normally distributed continuous variables or otherwise median (range). Between-group differences in EMP count and patient characteristics between primary renal diseases were analysed using one-way analy-sis of variance or Kruskal–Wallis test for these parametric and non-parametric tests respectively. The study was not specifically powered to explain this analysis given that it has not previously been described. The relationship between baseline parameters (age, BP, bio-chemistry and AIx) and EMP count (baseline EMP and δEMP) was analysed using Spearman’s correlation coefficient.
Survival analyses were performed for time to (1) all-cause mor-tality, (2) major cardiovascular event or death, and (3) renal re-placement therapy (dialysis or transplantation) for the study pop-ulation as a whole. Follow-up time was from the date of collection of the second EMP sample. Cardiovascular events were defined as stroke, myocardial infarction, coronary artery intervention in-cluding bypass graft, non-coronary revascularisation, limb ampu-tation for ischaemic injury, or hospitalisation for heart failure. Analyses used a multivariate Cox proportional hazard model. EMP values were log transformed and δEMP values underwent af-fine and log transformation due to the high number of negative values. The model included EMP, δEMP, and any other parameter noted to be significant on univariate analysis including demo-graphics, co-morbidities, laboratory parameters and AIx. The haz-ard ratios (HRs) given for EMP and δEMP are for unit change in log value. For this and all other analyses, statistical significance was set at p < 0.05.
Results
Baseline Characteristics
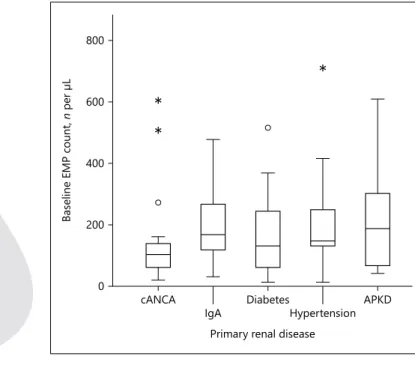
There were 123 patients. The mean age was 63 ± 11 years, systolic BP 135 ± 18 mm Hg and eGFR 32 ± 16 mL/ min/1.73 m 2 . The diagnoses were cANCA vasculitis ( n = 21), IgA nephropathy ( n = 25), diabetic nephropathy ( n = 25) hypertension ( n = 26), and ADPKD ( n = 26). The over-all median EMP count was 144/μL (range 10–714/μL). There was a numerical but not statistical difference in EMP count between CKD diagnoses ( Table 1 ; Fig. 2 ), with ADPKD being the highest (253 [41–610]) and cANCA vasculitis being the lowest (107 [21–610], p = 0.06). There
100 100 101 101 102 102 103 103 104 104 PE (575/25) log Annexin 450/50 log R8 R7 R9 R5 R6
618 G1: R1 = 2000> (G2: NOT R1 and NOT R3 & R4)
were statistical differences in baseline age, eGFR and Kar-nofsky performance score between CKD groups. These are summarised in Table 1 .
Correlation of Microparticle Count with Other Parameters
In the entire CKD group, there was no statistically sig-nificant correlation between baseline EMP count and any of eGFR (correlation co-efficient –0.10, p = 0.41) age (0.14, p = 0.12), CRP (–0.11, p = 0.34), systolic BP (0.02,
p = 0.81), serum phosphate (0.09, p = 0.35), serum total corrected calcium (–0.02, p = 0.80), parathyroid hor-mone (PTH; 0.09, p = 0.32), haemoglobin (–0.12, p = 0.20), serum albumin (0.06, p = 0.49), total cholersterol (–0.16, p = 0.08), CRP (–0.16, p = 0.88; uPCR, 0.01, p = 0.91), or aortic pulse wave AIx (0.01, p = 0.98). There was a significant inverse correlation between EMP and δEMP (–0.559, p < 0.01).
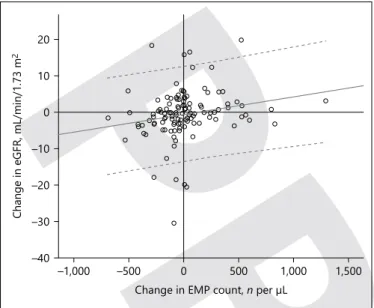
The mean time between EMP measurements was 391 ± 70 days, during which there was a median δEMP of +25/μL (range –689 to +1,295/μL). During follow-up, the mean change in eGFR (δeGFR) was +1 ± 6 mL/min/1.73 m 2 . The correlation between δeGFR and δEMP was
mod-erate but statistically significant (coefficient 0.20, p = 0.03). There was also a significant relationship between change in urine protein and δEMP with an increase in uPCR being associated with an increase in EMPs
(coef-Table 1.
Baseline endothelial microparticle count and patient characteristics
Diagnosis n EMP, n /μL δEMP, n /μL Age, years Systolic BP, mm Hg eGFR, mL/ min/1.73 m 2 Karnofsky score CRP, mg/L AIx, % All CKD patients 123 144 (10–714) 25 (–689 to 1,295) 65±11 135±18 32±16 94±7 3 (0–63) 23±9 cANCA vasculitis 21 107 (21–610) 28 (–507 to 796) 66±10 135±18 39±19 87±9 4 (0–18) 23±8 IgA nephropathy 25 138 (31–477) 3 (–267 to 830) 62±11 138±18 33±19 92±8 2 (0–14) 20±10 Diabetic nephropathy 25 131 (10–558) 0 (–492 to 601) 71±8 131±21 26±9 96±5 6 (0–63) 24±8 Hypertension 26 177 (13–714) –89 (–689 to 236) 58±11 133±20 31±14 98±7 4 (1–53) 23±12 ADPKD 26 253 (41–610) –115 (–534 to 1,295) 71±10 138±16 29±12 95±5 1 (0–37) 25±9 Significance – 0.06 0.15 <0.01 0.17 0.03 <0.01 0.08 0.65
EMP, endothelial microparticles; δEMP, longitudinal change in EMP; eGFR, estimated glomerular filtration rate; CRP, C-reactive
protein; cANCA,
c-antineut-rophil cytoplasmic antibody; ADPKD, autosomal dominant polycystic kidney disease; AIx, augmentation index.
EMP count is given as median (range), other data is presented as mean ± 1 SD.
0 200 400 600 800
Baseline EMP count,
n
per μL
cANCA
IgA DiabetesHypertension APKD Primary renal disease
* *
*
Fig. 2. Comparison of baseline EMP count between diagnoses. ADPKD, autosomal dominant polycystic kidney disease.
ficient 0.21, p = 0.02). The correlation between δeGFR and δEMP retained its significance after adjustment for change in uPCR ( Fig. 3 ). There was no other significant correlation between longitudinal change in EMP count and change in any other measured laboratory parameter or AIx.
Disease-Specific Correlations
The relationship between change in EMP from base-line to follow-up and change in eGFR appeared to differ between diagnoses. For vasculitis and ADPKD, there were large positive correlations between δEMP and δeGFR. The respective correlation coefficients for these diagnoses were 0.40 ( p = 0.06) and 0.49 ( p < 0.01). For diabetic nephropathy and IgA nephropathy, there were negative correlations: –0.32 ( p = 0.12) and –0.24 ( p = 0.29), respectively. The coefficient in hypertension was 0.08 ( p = 0.71).
The correlation between EMP and eGFR was not sig-nificant when analysed by each individual primary re-nal disease. There were very few disease-specific sig-nificant correlations between EMP and any baseline laboratory parameters or AIx, and between δEMP and longitudinal change in any parameter. Patients with IgA nephropathy demonstrated a significant correla-tion between δEMP and δuPCR (coefficient 0.557, p < 0.01). Patients with hypertension demonstrated a cor-relation between EMP and age (0.525, p < 0.01) and uPCR (0.509, p < 0.01). Patients with hypertension also
demonstrated a negative correlation between δEMP and both δphosphate (–0.398, p = 0.04) and δPTH (–0.520, p = 0.02).
Survival Analysis 1: All-Cause Mortality
The mean follow-up period after the second EMP measurement was 3.9 ± 2.2 years. During this time, there were 32 deaths (26% of CKD patients). The leading causes of death were coronary artery disease ( n = 11, 34% of deaths) and pneumonia ( n = 7, 22%). End-stage kidney disease, heart failure and malignancy were each respon-sible for 3 deaths (9% each). On univariate analysis of all-cause mortality, EMP was statistically associated with in-creased risk of death. The HR, for all-cause mortality with each unit increase in log EMP was 3.31 (95% CI 1.12– 9.76, p = 0.03). δEMP was not significantly associated (HR 0.64 [0.21–1.94], p = 0.43). Other parameters that were positive on univariate analysis were age, diabetes, Karnofsky score, eGFR, PTH, CRP, and haemoglobin. The results for AIx were not significant (HR 1.02 [0.97– 1.07]). Full results of the univariate analyses are found in Table 2 . In the multivariate Cox regression analysis of all-cause mortality, EMP retained its significance (HR 8.20 [1.67–40.2]), as did age and eGFR. In this model, δEMP showed a numerical association with mortality, but this did not reach significance (HR 2.69 [0.04–165], p = 0.64). The full results of the multivariate model are found in Table 3 , alongside goodness of fit results for the multi-variate model.
Because of the strong inverse correlation between EMP and δEMP noted above (i.e., those patients with the highest baseline EMPs saw the greatest numerical fall in EMPs), δEMP was also analysed as a percentage change from baseline to follow-up sampling. In univariate analy-sis, the affine log-transformed percentage δEMP also failed to reach statistical significance (HR 0.81 [0.41– 1.58], p = 0.53).
Survival Analysis 2: Cardiovascular Events
There were 22 major cardiovascular events (18%) in-cluding 9 cardiovascular deaths (28% of deaths, 7% of pa-tients). Age was the only parameter that demonstrated an association with cardiovascular outcome on univariate analysis (HR 1.05 [1.00–1.09], p = 0.03). The complete univariate model is found in Table 2 . Neither EMP nor δEMP were significant. In the multivariate survival anal-ysis, no parameters demonstrated statistical significance. Indeed, the goodness-of-fit analysis itself was non-signif-icant in this model. The results of the multivariate analy-sis are found in Table 3 .
–40 –30 –20 –10 0 10 20
Change in eGFR, mL/min/1.73 m
2
–1,000 –500 0 500 1,000 1,500
Change in EMP count, n per μL
Fig. 3. Correlation between longitudinal change in eGFR and con-current change in EMP count.
Table 2. Univariate association of all measured parameters with each of all-cause mortality, major cardiovascular events, and progression to renal replacement therapy
All-cause mortality Cardiovascular event RRT
HR (95% CI) p value HR (95% CI) p value HR (95% CI) p value
Age, years 1.11 (1.07–1.16) <0.01 1.05 (1.00–1.09) 0.03 0.99 (0.96–1.02) 0.49
Systolic BP, mm Hg 1.00 (0.98–1.02) 0.93 1.00 (0.98–1.02) 0.97 1.00 (0.98–1.02) 0.71
Body mass index, kg/m2 1.04 (0.97–1.12) 0.26 1.06 (0.98–1.14) 0.16 1.01 (0.94–1.08) 0.85
Diabetes 2.44 (1.17–5.07) 0.02 2.15 (0.91–5.10) 0.08 1.21 (0.54–2.71) 0.65 Heart failure 1.57 (0.21–11.56) 0.66 0.05 (0.00–3519) 0.59 0.05 (0.00–459) 0.51 Male gender 0.72 (0.34–1.49) 0.37 1.23 (0.50–3.06) 0.65 0.69 (0.34–1.40) 0.30 Karnofsky score 0.95 (0.91–0.99) 0.03 0.96 (0.91–1.01) 0.12 0.99 (0.93–1.04) 0.63 EMP count 3.31 (1.12–9.76) 0.03 0.55 (0.19–1.64) 0.28 0.97(0.38–2.46) 0.95 δEMP 0.64 (0.21–1.94) 0.43 6.04 (0.41–89.93) 0.19 0.42 (0.12–1.45) 0.17 AIx, % 1.02 (0.97–1.07) 0.41 0.98 (0.93–1.04) 0.49 0.99 (0.95–1.03) 0.62 eGFR, mL/min/1.73 m2 0.95 (0.92–0.98) <0.01 0.97 (0.93–1.00) 0.07 0.94 (0.91–0.97) <0.01 Phosphate, mmol/L 1.95 (0.50–7.64) 0.33 2.11 (0.41–10.76) 0.37 6.05 (1.38–26.4) 0.02
Corrected calcium, mmol/L 1.94 (0.12–31.74) 0.64 0.42 (0.01–15.73) 0.64 0.53 (0.03–10.1) 0.67
PTH, pmol/L 1.00 (1.00–1.01) 0.02 1.00 (0.99–1.01) 0.90 1.01 (1.00–1.01) <0.01 Albumin, g/L 0.98 (0.90–1.06) 0.57 0.99 (0.89–1.11) 0.91 0.89 (0.83–0.96) <0.01 Cholesterol, mmol/L 0.67 (0.44–1.02) 0.06 1.19 (0.77–1.83) 0.44 1.00 (0.70–1.42) 0.99 CRP mg/L 1.03 (1.00–1.06) 0.05 1.03 (0.99–1.06) 0.11 1.01 (0.98–1.05) 0.54 uPCR g/mol 1.00 (1.00–1.00) 0.66 1.00 (1.00–1.00) 0.90 1.01 (1.00–1.02) <0.01 Haemoglobin g/L 0.97 (0.95–0.99) 0.01 0.99 (0.97–1.02) 0.52 0.96 (0.94–0.98) <0.01
HR, hazard ratio; RRT, real replacement therapy; BP, blood pressure; EMP, endothelial microparticle; δEMP, longitudinal change in EMP; AIx, augmentation index; PTH, parathyroid hormone; CRP, C-reactive protein; uPCR, urine protein:creatinine ratio; eGFR, estimated glomerular filtration rate.
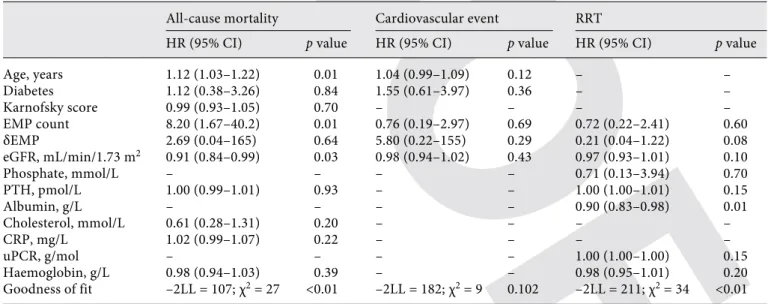
Table 3. Multivariate models demonstrating the independent association of parameters with each of all-cause mortality, major cardiovascular events, and progression to renal replacement therapy
All-cause mortality Cardiovascular event RRT
HR (95% CI) p value HR (95% CI) p value HR (95% CI) p value
Age, years 1.12 (1.03–1.22) 0.01 1.04 (0.99–1.09) 0.12 – – Diabetes 1.12 (0.38–3.26) 0.84 1.55 (0.61–3.97) 0.36 – – Karnofsky score 0.99 (0.93–1.05) 0.70 – – – – EMP count 8.20 (1.67–40.2) 0.01 0.76 (0.19–2.97) 0.69 0.72 (0.22–2.41) 0.60 δEMP 2.69 (0.04–165) 0.64 5.80 (0.22–155) 0.29 0.21 (0.04–1.22) 0.08 eGFR, mL/min/1.73 m2 0.91 (0.84–0.99) 0.03 0.98 (0.94–1.02) 0.43 0.97 (0.93–1.01) 0.10 Phosphate, mmol/L – – – – 0.71 (0.13–3.94) 0.70 PTH, pmol/L 1.00 (0.99–1.01) 0.93 – – 1.00 (1.00–1.01) 0.15 Albumin, g/L – – – – 0.90 (0.83–0.98) 0.01 Cholesterol, mmol/L 0.61 (0.28–1.31) 0.20 – – – – CRP, mg/L 1.02 (0.99–1.07) 0.22 – – – – uPCR, g/mol – – – – 1.00 (1.00–1.00) 0.15 Haemoglobin, g/L 0.98 (0.94–1.03) 0.39 – – 0.98 (0.95–1.01) 0.20 Goodness of fit –2LL = 107; χ2 = 27 <0.01 –2LL = 182; χ2 = 9 0.102 –2LL = 211; χ2 = 34 <0.01
HR, hazard ratio; RRT, real replacement therapy; EMP, endothelial microparticle; δEMP, longitudinal change in EMP; AIx, augmentation index; PTH, parathyroid hormone; CRP, C-reactive protein; uPCR, urine protein:creatinine ratio; –2LL, –2 log like-lihood; χ2, chi-square.
Survival Analysis 3: Renal Replacement Therapy
Thirty-one patients required renal replacement therapy during the follow-up period (25%). EMP and δEMP were not significant on either univariate or multivariate analysis. The results of these analyses are found in Tables 2 and 3 , respectively. The only independent predictor of disease progression to real replacement therapy in the multivariate model was serum albumin (HR 0.90 [0.83–0.98], p = 0.01).
Discussion
EMP in Different Renal Diseases
In this study of patients with CKD but no prior cardio-vascular or smoking history, there was a difference in base-line EMP count for different primary renal diagnoses with a p value of = 0.06. Of note, the 2 diseases with the highest median EMP count were ADPKD and hypertension. Al-though EMPs may be associated with an inflammatory state, shear stress is a key trigger to EMP release. In turn, hypertension will lead to intra-vascular shear stress. The lower eGFR in ADPKD compared to other primary dis-eases may also have been contributory, although there was no significant correlation between eGFR and EMP in this analysis. Furthermore, EMPs behave differently in differ-ent disease states and so their absolute values may be dif-ficult to interpret in the context of renal function alone. For example, EMPs have been noted to be elevated in type 1 diabetes compared to controls but not in type 2 diabetes compared to controls in the same study [27] . EMPs have also been found in high levels in severe hypertension in patients without CKD compared to normal controls, as well as in acute coronary syndrome [16] . In these settings, their formation may be a response to, rather than a precur-sor of, vascular damage. This is supported by in vitro find-ings of EMPs promoting angiogenesis and thrombosis.
Correlation of δEMP
The positive correlation between δEMP and δeGFR (i.e., that EMP levels increased where eGFR improved over time) may seem surprising. However, this is not a unique finding. A previous study has shown higher serum levels of the vascular endothelial activation markers sol-uble intercellular adhesion molecule 1 (sICAM-1), sVCAM-1 and sE-selectin in both patients with pre-dial-ysis CKD and on dialpre-dial-ysis when compared to normal eGFR controls but without a difference in level between CKD and dialysis groups [23] .
There has also been no adjustment made for pre-scribed medication in our study. One may hypothesise
that therapeutic interventions will affect EMP count in-dependent of eGFR, and thereby possibly account for the increase in EMPs as eGFR improves. This is important given that different primary renal diagnoses will neces-sitate different therapeutic approaches.
The positive correlation between proteinuria and δEMP is likely to reflect that proteinuria is associated with disease activity in many causes of CKD, such as diabetic nephropathy, IgA nephropathy, vasculitis and also hy-pertension. In the disease-specific correlation analyses, the most significant correlations between proteinuria and EMPs were in IgA nephropathy and hypertension. Proteinuria is also associated with increased cardiovascu-lar risk in CKD, and the proposed mechanisms include its role as a potential marker of inflammation in disease; it is also associated with endothelial dysfunction. These mechanisms, particularly the latter, are also known to be associated with elevated EMPs in non-CKD disease.
The other noteworthy disease-specific correlation that was found was between δEMP and both δphosphate and δPTH (–0.520, p = 0.02). These relationships were nega-tive, indicating that a rise in PTH and phosphate would be found with a concurrent fall in EMPs. Phosphate and PTH are markers of CKD mineral bone disorder and would be expected to be associated with vascular damage rather than a fall in EMPs. It may be that these findings represent a type 1 error in view of the large number of correlation analyses performed.
The Association of EMP with AIx
We found no correlation between baseline or longitu-dinal change in EMP and AIx. Contrary to this, a previ-ous study of 44 maintenance haemodialysis patients found a significant association between cross-sectional measurements (r = 0.46, p < 0.01) [15] . The fact that our study was in non-dialysis CKD may provide understand-ing of this, as clinically significant vascular stiffness becomes more pronounced with falling eGFR. Dursun et al. [24] did find a relationship between EMP and vas-cular stiffness in a cohort of CKD patients of which some were not on dialysis. However, these were paediatric pa-tients and the assessment was by way of PWV. PWV is thought to be a better indicator than AIx of the diffuse medial calcification noted in vascular stiffness associated with CKD.
Survival Analysis
We found a significant independent association of baseline EMP with mortality in this CKD population. However, despite EMP being a marker of vascular
dys-function, the significant association did not extend to cardiovascular events. Such an association is noted else-where, such as in predicting cardiovascular events and death in patients with established coronary artery dis-ease, and also in patients on dialysis. In a study of 81 maintenance haemodialysis patients, each log increase in baseline EMP was associated with a 22-fold increased risk of all-cause and 20-fold increased risk of cardiovas-cular death [28] . Our study included patients with bet-ter preserved eGFR in whom vascular risk would be ex-pected to be lower, and this may account for the differ-ence in HR for all-cause mortality, and the non-significance in our analysis of cardiovascular death.
Our results demonstrate a striking variability in both baseline and longitudinal changes in EMP despite select-ing patients with apparently stable renal disease. We ob-served potential differences in expected EMP count be-tween renal diseases, as well as differences bebe-tween dis-eases in the association of EMP and δEMP with other factors such as proteinuria and eFGR. This is reflected in the very wide CIs for δEMP in the multivariate survival analyses and the lack of statistical significance despite en-couraging numerical HR for all-cause mortality and car-diovascular events, which reflect the finding of other studies. Evidently, a far larger study would be required to be adequately powered to provide conclusive answers to whether EMPs are a useful marker of cardiovascular risk in early CKD and whether its utility will differ between causes of renal failure.
Conclusions
EMP are elevated in CKD, but this appears to differ be-tween renal diseases. The broad range of baseline EMP counts and δEMP create large CIs for determining what is “normal” EMP activity in CKD. These factors will inhibit the generalised utility of EMP as a biomarker of disease ac-tivity and vascular risk in CKD. Greater evaluation of EMP activity in different renal diseases during the different phas-es of the disease and at different stagphas-es of CKD is required.
Acknowledgements
We would like to thank the patients of Salford Royal Founda-tion Trust for their participaFounda-tion in this study.
Disclosure Statement
B.P. is supported by the NIHR Manchester Musculoskeletal Biomedical Research Unit and the NIHR Manchester Clinical Research Facility. This report includes independent research sup-ported by (or funded by) the National Institute for Health Research Manchester Musculoskeletal research Unit. The views expressed in this publication are those of the author(s) and not necessarily those of the NHS, the National Institute for Health Research or the Department of Health.
Statement of Ethics
Ethical approval was granted by the relevant local ethics com-mittee and the study complied with the Declaration of Helsinki.
References
1 Stack AG, Bloembergen WE: Prevalence and clinical correlates of coronary artery disease among new dialysis patients in the United States: a cross-sectional study. J Am Soc
Nephrol 2001; 12: 1516–1523.
2 Foley RN, Parfrey PS, Sarnak MJ: Epidemiol-ogy of cardiovascular disease in chronic renal
disease. J Am Soc Nephrol 1998; 9(12
suppl):S16–S23.
3 Green D, Ritchie JP, Kalra PA: Meta-analysis of lipid-lowering therapy in maintenance
di-alysis patients. Nephron Clin Pract 2013; 124:
209–217.
4 Green D, Panayotova R, Ritchie JP, O’Riordan E, McDonald J: Lipid-lowering therapy in chronic kidney disease: is there a
role for ezetimibe? J Ren Care 2012; 38: 138–
146.
5 Goodman WG, Goldin J, Kuizon BD, Yoon C, Gales B, Sider D, et al: Coronary-artery calcification in young adults with
end-stage renal disease who are
undergo-ing dialysis. N Engl J Med 2000; 342: 1478–
1483.
6 Yao Q, Pecoits-Filho R, Lindholm B, Sten-vinkel P: Traditional and non-traditional risk factors as contributors to atherosclerot-ic cardiovascular disease in end-stage renal
disease. Scand J Urol Nephrol 2004; 38: 405–
416.
7 Eddington H, Hoefield R, Sinha S, Chryso-chou C, Lane B, Foley RN, Hegarty J, New J, O'Donoghue DJ, Middleton RJ, Kalra PA: Se-rum phosphate and mortality in patients with chronic kidney disease. Clin J Am Soc
Nephrol 2010; 5: 2251–2257.
8 Eddington H, Kalra PA: The association of chronic kidney disease-mineral bone disor-der and cardiovascular risk. J Ren Care 2010; 36(suppl 1):61–67.
9 Lee BT, Ahmed FA, Hamm LL, Teran FJ, Chen CS, Liu Y, Shah K, Rifai N,
Batu-man V, Simon EE, He J, Chen J: Associa-tion of C-reactive protein, tumor necro-sis factor-alpha, and interleukin-6 with chronic kidney disease. BMC Nephrol 2015;
16: 77.
10 Schiro A, Wilkinson FL, Weston R, Smyth JV, Serracino-Inglott F, Alexander MY: Elevated levels of endothelial-derived microparticles, and serum CXCL9 and SCGF-β are associated with unstable asymptomatic carotid plaques.
Sci Rep 2015; 5: 16658.
11 Piťha J, Králová Lesná I, Stávek P, Mahrová A, Racek J, Sekerková A, Teplan V, Štollová M: Effect of exercise on markers of vascular health in renal transplant recipients. Physiol
Res 2015; 64: 945–949.
12 Prochazka M, Procházková J, Lubušký M, Pil-ka R, Úlehlová J, Michalec I, Polák P, Kac-erovský M, Slavik L: Markers of endothelial
activation in preeclampsia. Clin Lab 2015; 61:
13 Heathfield SK, Parker B, Zeef LA, Bruce IN, Alexander MY: Certolizumab pegol attenu-ates the pro-inflammatory state in endothelial cells in a manner that is atheroprotective. Clin
Exp Rheumatol 2013; 31: 225–233.
14 Schiro A, Wilkinson FL, Weston R, Smyth JV, Serracino-Inglott F, Alexander MY: Endothe-lial microparticles as conveyors of informa-tion in atherosclerotic disease.
Atherosclero-sis 2014; 234: 295–302.
15 Amabile N, Guérin AP, Leroyer A, Mallat Z, Nguyen C, Boddaert J, London GM, Tedgui A, Boulanger CM: Circulating endothelial mic-roparticles are associated with vascular dys-function in patients with end-stage renal
fail-ure. J Am Soc Nephrol 2005; 16: 3381–3388.
16 Sinning JM, Losch J, Walenta K, et al: Circu-lating CD31+/Annexin V+ microparticles correlate with cardiovascular outcomes. Eur
Heart J 2011; 32: 2034–2041.
17 Preston RA, Jy W, Jimenez JJ, Mauro LM, Horstman LL, Valle M, Aime G, Ahn YS: Ef-fects of severe hypertension on endothelial and platelet microparticles. Hypertension
2003; 41: 211–217.
18 González-Quintero VH, Jiménez JJ, Jy W, Mauro LM, Hortman L, O’Sullivan MJ, Ahn Y: Elevated plasma endothelial microparticles in preeclampsia. Am J Obstet Gynecol 2003;
189: 589–593.
19 Agouni A, Lagrue-Lak-Hal AH, Ducluzeau PH, MostefaI HA, Draunet-Busson C, Lefthe-riotis G, Heymes C, Martinez MC, Andrian-tsitohaina R: Endothelial dysfunction caused by circulating microparticles from patients with metabolic syndrome. Am J Pathol 2008;
173: 1210–1219.
20 Parker B, Al-Husain A, Pemberton P, Yates AP, Ho P, Gorodkin R, Teh LS, Alexander MY, Bruce IN: Suppression of inflammation reduces endothelial microparticles in active systemic lupus erythematosus. Ann Rheum
Dis 2014; 73: 1144–1150.
21 Faure V, Dou L, Sabatier F, Cerini C, Sampol J, Berland Y, Brunet P, Dignat-George F: El-evation of circulating endothelial micropar-ticles in patients with chronic renal failure. J
Thromb Haemost 2006; 4: 566–573.
22 Mezzano D, Tagle R, Pais E, Panes O, Pérez M, Downey P, Muñoz B, Aranda E, Barja P, Thambo S, González F, Mezzano S, Pereira J: Endothelial cell markers in chronic uremia: relationship with hemostatic defects and
se-verity of renal failure. Thromb Res 1997; 88:
465–472.
23 Bonomini M, Reale M, Santarelli P, Stuard S, Settefrati N, Albertazzi A: Serum levels of sol-uble adhesion molecules in chronic renal
fail-ure and dialysis patients. Nephron 1998; 79:
399–407.
24 Dursun I, Poyrazoglu HM, Gunduz Z, et al: The relationship between circulating endo-thelial microparticles and arterial stiffness and atherosclerosis in children with chronic kidney disease. Nephrol Dial Transplant
2009; 24: 2511–2518.
25 Hoefield RA, Kalra PA, Baker P, et al: Factors associated with kidney disease pro-gression and mortality in a referred CKD
population. Am J Kidney Dis 2010; 56: 1072–
1081.
26 Alderson HV, Ritchie JP, Middleton R, et al: FGF-23 and Osteoprotegerin but not Fetuin-A are associated with death and enhance risk prediction in non-dialysis chronic kidney dis-ease stages 3–5. Nephrology (Carlton) 2016;
21: 566–573.
27 Sabatier F, Darmon P, Hugel B, Combes V, Sanmarco M, Velut JG, Arnoux D, Charpiot P, Freyssinet JM, Oliver C, Sampol J, Dignat-George F: Type 1 and type 2 diabet-ic patients display different patterns of
cel-lular microparticles. Diabetes 2002; 51:
2840–2845.
28 Amabile N, Guérin AP, Tedgui A, Boulanger CM, London GM: Predictive value of circulat-ing endothelial microparticles for cardiovas-cular mortality in end-stage renal failure: a
pilot study. Nephrol Dial Transplant 2012; 27: