Anita V Staneva and G. Reza Arabsheibani
Is there an informal employment wage
premium? Evidence from Tajikistan
Article (Accepted version)
(Refereed)
Original citation:
Staneva, Anita V and Arabsheibani, G. Reza (2014) Is there an informal employment wage
premium? Evidence from Tajikistan. IZA Journal of Labor & Development, 3 (1). p. 1. ISSN
2193-9020
DOI: 10.1186/2193-9020-3-1
Reuse of this item is permitted through licensing under the Creative Commons:
© 2014 Springer
CC BY
This version available at: http://eprints.lse.ac.uk/90508/
Available in LSE Research Online: October 2018
LSE has developed LSE Research Online so that users may access research output of the
School. Copyright © and Moral Rights for the papers on this site are retained by the individual
authors and/or other copyright owners. You may freely distribute the URL
O R I G I N A L A R T I C L E
Open Access
Is there an informal employment wage
premium? Evidence from Tajikistan
Anita V Staneva
*and G Reza Arabsheibani
*Correspondence: a.v.staneva@swansea.ac.uk School of Management, Swansea University, Singleton Park, Richard Price Building, SA28PP, Swansea, UK
Abstract
This paper defines informal sector employment and decomposes the difference in earnings between formal and informal sector employees in Tajikistan for 2007. Using quantile regression decomposition technique proposed by JAE, 20:445-465, 2005 and considering self-selection of individuals into different employment types, we find a significant informal employment wage premium across the whole earnings distribution. Taking advantage of RES, 90:290-299, 2008 matching approach and considering the possibility of misleading results due to different observed characteristics of formal and informal workers, we still find a wage gap in favour of informal sector workers. JEL codes: J21; J23; J24; J31
Keywords: Formal/informal employment; Quantile regression decomposition; Matching; Endogeneity
1 Introduction
The size of informal sector, cited as the central factor underlying wage inequality, poverty and labour market inefficiency, has always attracted attention in all transition and devel-oping countries and Tajikistan is not an exception. The National Human Development Report (2010) for Tajikistan shows that during 2008–2009 over 47% of employment in the country was in the informal sector. The number of people employed in this sector was estimated to be over 1 million.
It is generally assumed, and empirically supported by much of the literature, that work-ers in the informal sector are paid less than their formal sector counterparts. Empirically and theoretically it is not clear why this should be the case. There are a number of explana-tions offered, most of which are based on a segmented view of the labour market (Badaoui et al. (2008)). The presence of barriers to entry into the formal sector could be a possi-ble cause (Fields (1975); Mazumdar (1975)). A wage penalty for informal workers might be due to sorting, where those with lower human capital are more likely to work in the informal sector (Tokman (1982)). Marcouiller et al. (1997) show a significant wage pre-mium in the informal sector in Mexico, while in El Salvador and Peru formal workers have a higher wage premium. However, evidence in favour of the existence of a wage pre-mium for formal worker depends on the category of informal job (e.g. self-employed are, in general, better paid than salaried workers). Using the Russian Longitudinal Monitoring Survey, Braithwaite (1995) and Kolev (1998) find higher wage premium in secondary jobs, compared to the main job, which are the main locus of the informal economic activities. © Staneva and Arabsheibani; licensee Springer. This is an Open Access article distributed under the terms of the Creative Commons Attribution License (http://creativecommons.org/licenses/by/2.0), which permits unrestricted use, distribution, and reproduction in any medium, provided the original work is properly cited.
Lehmann and Zaiceva (2013) show a wage penalty in the lower part of the distribution and no statistically significant difference between informal and formal wages in the upper half of the distribution for salaried workers in Russia. In contrast, by including informal self-employed and entrepreneurs the authors find significantly positive in the upper part of the distribution, pointing to a segmented informal sector with a lower free entry tier and an upper rationed tier. Carneiro and Henley (2001) indicate that differences in earn-ings are strongly explained by the non-observable characteristics of workers who decide to join each sector. Wu and Li (2006) show that about 90 percent of the observed formal-informal monthly income differential in urban China can be explained by differences in observed characteristics.
One of the major difficulties in being able to identify and understand the informal sec-tor employment has been the lack of consensus on how to define and measure informal sector activities. Whilst there is a large literature on the informal economy, very few stud-ies have applied it so far to the transition economstud-ies. An improved understanding of the formal/informal pay differential is crucial for addressing country’s welfare, equity and poverty consequences. In this regard the present study complement the existing litera-ture by capturing the diversity of informal sector employment in Tajikistan and estimating earnings differential along several dimensions. First, we try to distinguish and define informal sector employment in Tajikistan a country that has received little attention in the literature and provides rich evidence for a large and heterogeneous labour market. Household survey data available for Tajikistan contains detailed information on individual household member economic status and permits some comparison of alternative infor-mality definitions. It cannot be assumed that different definitions are broadly consistent and therefore, any particular choice of definition measurement is important.
Second, earnings gap is commonly used to test for the existence of segmented ver-sus competitive labour markets. Large differentials are often viewed as an evidence for institutional rigidities in the labour markets and thus suggesting need for a policy action considering equity and efficiency purposes. To provide a more detailed insight into the formal-informal pay differential, the current study looks across the entire conditional earnings distribution by extending Machado-Mata procedure (2005), where for the non-discriminatory wage structure we follow Neumark (1988) and Oaxaca and Ransom (1994) procedure. The methodology employed decomposes the earnings gap into differences in endowments of skills and differences in returns to these skills. Disentangling the formal/informal pay gap along various quantiles of the earnings distribution enables a multidimensional array of policy implications. In this fashion, one can also address the issue of heterogeneity within formal and informal sectors which is often an important issue in such earnings analyses.
Third, the main challenge in earnings gap analysis is to control for a possible sam-ple selection bias which may result from either self-selection of individuals into different employment types (formal/informal). The importance of controlling for endogeneity lies in the fact that it allows us also to discuss the role that changes in the distribution of unob-served ability might play in the obunob-served changes of the earnings distribution. Finally, we consider that possible differences in the distribution of observed characteristics of the formal and informal workers may lead to biases for the estimates in the preceding section. Following Ñopo (2008), we use matching, as an alternative to the linear specifi-cation approach, to identify workers in the formal sector that display the same observable
characteristics as informal sector, and compare their wages across the distribution. The method does not require estimating earnings equation for formal and informal sector workers, and thus it is not necessary to assume that the linear estimators of the earnings equations are valid out of the supports of individual characteristics for which they were estimated (Ñopo (2008)). The purpose of implemented matching approach is to balance the unobservables by adjusting for pre-treatment observable differences between sectors. There are a number of econometric issues involved in the decomposition meth-ods applied. Obviously, matching has advantage over the traditional linear regressions, recognizing importance of differences in the support and being less computationally demanding. It is possible also to obtain a distribution of the formal-informal pay differ-ences. The considered method has also an advantage in the estimation of the gap, because it is based on the matching between observable individuals and as a result, does not need to account for selection bias such as in other decomposition methods. However, we should mention the curse of dimensionality - the use of many matching characteristics for a single matching discrete variable may reduce the chances of obtaining adequate number of matched observations (Ñopo (2008)).
The remainder of the paper is structured as followed. In section 2, we provide a brief discussion of the Tajikistan’s labour market. A discussion of the existing literature on measuring informal sector employment and our propose measure is given in Section 3. Section 4 discusses the data, and section 5 presents the econometric methodology. Finally, sections 6 and 7 discuss the main results and conclusions.
2 Tajikistan’s labour market
Tajikistan has one of the lowest per capita GDP among the 15 former Soviet republics and was among the worst affected by transition experiencing hyperinflation and the collapse of industrial production aggravated by a five-year civil war (1992 to 1997) (Falkingham (2000)). The financial crisis in Russia in August 1998 additionally altered the economic environment in the country.
Tajikistan’s economic transition from a centrally planned system towards a more market-oriented economy began around 1997 and most of the ensuing period has been a story of recovery from war rather than transition. While steady economic growth since 1997, nearly two-thirds of the population continue to live in poverty. In 2003, 68% of Tajiks lived below the national poverty line (Kohl et al. (2008)). Because of a lack of employ-ment opportunities in Tajikistan, nearly half of the labour force works abroad, primarily in Russia and Kazakhstan, supporting their families in Tajikistan through remittances (National Human Development Report (2010)). Unemployment was a major push factor of migration. Olimova and Bosc (2003) find that 14.5% of all interviewed migrants had not worked before leaving the country, indicating poor labour prospects. The increase in the working-age population affected the informal sector, where employment grew by almost 300% over the period 1991 to 2005 (National Human Development Report (2010)).
Employment challenges in Tajikistan were multidimensional, and ranged from high unemployment rates to diverse forms of under-employment and a lack of skilled labour to respond to enterprises needs. While a member of the Soviet Union, the country had an essentially formal labour market, where the state was responsible for ensuring that everyone had a job. Since independence in 1991 decrease in production and the closure of state-owned companies has led to massive job losses (Kröger and Meier (2011)). Due to
the privatisation policy pursued in the period 1991–2007, the share of workers employed in the private sector increased and the share of workers employed in the state-owned sec-tor decreased (Table 1). The state secsec-tor shrunk mainly due to the transition and also due to the overall economic collapse brought about by the decline of the Soviet economy.
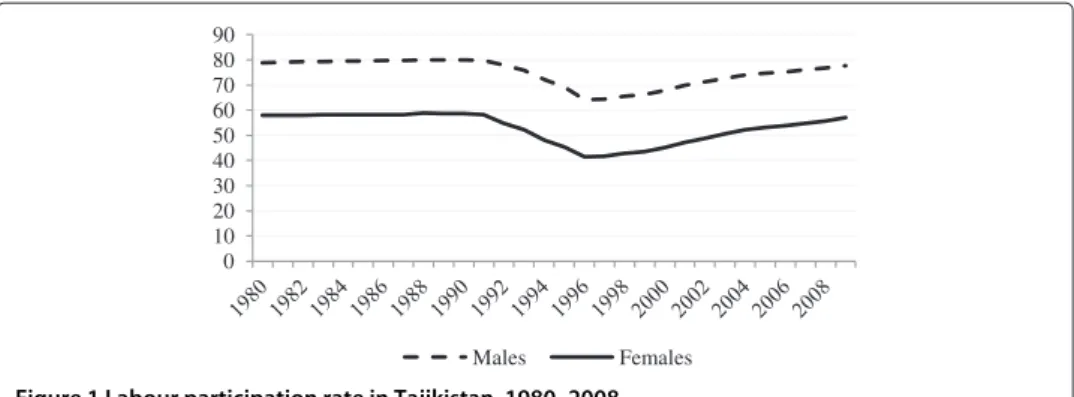
According to official statistics, in the period 1991–2007, employment distribution by economic sector changed dramatically. The proportion of the workforce employed in industry declined and the proportion employed in agriculture increased more than 1.6 times. In 2008, 67.2% of the labour force participation was in agriculture, 7.5% in industry, and 25.3% in services. Figure 1, which plots the labour force participation rate in Tajikistan since 1980, indicates that under the Soviet rule, participation rates were relatively high with almost 80% of men and 60% of women being employed. After the collapse of the Soviet Union and the civil war between 1992 and 1997, participation rate of both men and women decreased significantly. An analysis of the outcomes of various surveys shows a decline of unemployment rate for the period 1999–2004. According to the Tajikistan Living Standards Measurement Survey (LSMS) conducted in 1999, the unemployment rate was 16% but it declined to 11.4% in 2002 based on the Poverty Reduction Monitoring Survey Table 2.
The increase in informal activities over the post-Soviet period has been related to the outflow of workers from the formal sector, the slow growth of private formal employment and the growth of open unemployment. The informal sector has acted as a large labour reserve during the transition processes the one Tajikistan has been experiencing, and as a shorter-term shock-absorber that expands in times of economic recession and shrinks during periods of economic recovery.
3 Defining informality
It is particularly important, given recent developments in the debate on measuring informality, to carefully distinguish between informal and formal sector employment. Informal employment, sometimes known as undeclared, hidden or grey employment, can be broadly described as employment engaged in producing legal goods and ser-vices where one or more of the legal requirements associated with employment are not complied with OECD (2008). The informal economy is traditionally viewed as the disad-vantaged sector employing unskilled, less educated, urban migrants or ethnic minorities
Table 1 Employment by ownership and economic sector in Tajikistan, 1991–2007
1991 1998 2000 2002 2004 2005 2006 2007
Total employment (million) 1,971 1,796 1,745 1,857 2,090 2,112 2,137 2,150
Ownership (%) State−owned 59.4 42.7 32 27.8 26.5 25.7 25.1 24.2 Private1 19.1 33.1 43.1 44 50 51.2 50.7 51.8 Collective2 20.4 23.2 23.8 27.5 22.6 22.2 23.2 22.9 Economic sector (%) Industry 13 8.2 6.9 6.6 5.6 5.7 5.5 5.5 Construction 7.5 2.9 2.1 1.8 1.6 3.3 2.9 3 Agriculture 44.7 60.7 65 66.6 67.6 66.6 67.5 67 Note:
1Personal subsidiary plots and farms, individual labour activities, private enterprises. 2Collective farms, cooperatives, public associations.
0 10 20 30 40 50 60 70 80 90 Males Females
Figure 1 Labour participation rate in Tajikistan, 1980–2008.
(Mazumdar (1983)). Thus, it plays a negative role in the economy by decreasing official output, reducing government tax revenue and constraining the growth of the private sec-tor (Johnson et al. (1997); Lacko (2000)). The informal employees lack social security coverage and some or all of the protections provided by labour contracts.
Although the term has been very widely used, its meaning is not clear. There is no pre-cise definition and consensus over what constitutes informal sector employment and how to measure it. In many cases researchers choice of definition is determined by the avail-ability of data. Thus, the informal sector has been referred to as street vendors, domestic workers or unregistered small-scale activities in developing countries, and drug traf-ficking and prostitution in western countries. Some authors argue that all self-employed workers should be included in the informal sector, while others include only those who are not paying social security contributions and are outside any employment protection. Legalistic definition of informality refers to the avoidance of formal registration, taxation and the lack of social security protection. Merrick (1976) defines informal sector workers by their lack of social security status. International Labour Offices (ILO) (2003) defini-tion is based on employees in small establishment size of fewer than 5–10 employees (depending on the country). Pradhan and van Soest (1995) use a definition of fewer than 6 employees for Bolivia and Mexico; Funkhouser (1997) uses fewer than 5 employees for an analysis of five Central American countries. Under the guidelines of the statistical def-inition of informal employment established by the International Conference of Labour Statisticians in 2003, informal employment includes casual jobs or jobs with limited short duration; jobs with hours of work or wages below a specified threshold; employ-ment of persons in households; jobs where the employee’s place of work is outside the premises of the employer’s enterprise; or jobs for which labour regulations are not applied (Daza (2005)).
Henley et al. (2009) indicate three definitions of informality - first, according to the employment contract status, second, according to the social security protection and
Table 2 Changes in general unemployment in Tajikistan (%), 1991–2004
1991 1999 2000 2002 2003 2004
Unemployment rate - 16 9.3 11.4 12 7.4
Labour force participation rate 76.5 69.1 63.2 - 64.2 66.5
Source:1991, official statistics; 1999, Tajikistan Living Standards Measurement Survey; 2000, Census; 2002 Poverty Reduction Monitoring Survey; 2003 Tajikistan Living Standards Survey; 2004 LFS.
finally according to the nature of the employment and the characteristics of the employer. More specifically, the way of defining informality in developing countries does matters and the conditional impact of particular factors on the likelihood of informality varies considerably from one definition to another. Where information on contract status is not available, the alternative definition of informal employment is by the lack of social protec-tion. For instance, Portes et al. (1989), Marcouiller et al. (1997) and Maloney (1999) define workers as informal employees by the criterion of no social protection and security. Bern-abe (2002) applies the typology of informal employment in Georgia by using proxies for household enterprises and non-regular employment. A study by Gasparini and Tornarolli (2009) defines as informal employees who are engaged in low-productive jobs, often family-based activities. There are a group of researchers who view the informal labour market in line with the survival-oriented informal activities. Johnson et al. (1997) identify six types of survival strategies used in Russia, which they refer to as informal activities: having a second job; using land to grow food; working as a private taxi driver; renting out ones apartment; business trips abroad for resale and renting out ones garage. A recent study by Abdulloev et al. (2012) use discrepancy between reported household expendi-ture and reported household income in Tajikistan as an indication of informal/unreported activity. Their approach does not need detailed information about the working environ-ment (firm characteristics or worker protection) to assign individuals to informal sector activity.
The informal employment literature is moving away from a traditional view of informal-ity as evidence for labour market segmentation. Rather than seeing informal employment as a survival mechanism for low-productivity workers who are queuing until they find a better paid job opportunity, recent empirical studies argue that some informal workers ‘choose’ informal employment. They do so because informal employment offers them a better financial return on their skills or experience (OECD (2008)). Additionally, infor-mal sector offers flexibility in hours, place of work, and allows sinfor-mall businesses with entrepreneur ability to become successful. Maloney (1999) suggests that the informal sec-tor in developing countries may be a desirable choice. Individuals working in the informal sector benefit from flexibility in terms of working hours, and in some cases choice of work location. This aspect may be especially valued by women with children. At the same time, because wages of the ‘unofficially employed’ are not subject to taxation, salaries in the informal sector may be significantly higher compared to post tax salaries in the formal sector. This suggests that workers may face an improved wage offer in the informal sector compared to the formal sector (Henley et al. (2009)).
3.1 Defining informal employment in Tajikistan
In the process of transition to market economy, the structure and character of informal employment in Tajikistan has changed. Informal employment has reached a consid-erable scale contributing approximately 35 percent to Gross National Product (OECD (2007)). Some commentators argue that the country seems to have entered into a pro-cess that has already taken hold in other countries Latin America, sub-Saharan Africa and many Asian countries, where there is a tendency towards informalisation of the formal sector (Wallenborn (1982)). According to the Tajikistan Labour Force Survey (LFS) in 2004 the share of employment in the informal sector of the country was 53.3%. The National Human Development Report (2007) survey on the informal economy in
Tajikistan shows that the main reason why some firms prefer to use informal methods, are the overcomplicated and burdensome formal procedures and the low quality of civil servants, which seem to encourage firms to try avoiding them by resorting to informal methods in an effort to minimize costs of operation.
On the question what is the main reason to accept a job without social security benefits, 26% of respondents from the 2007 Tajikistan survey indicated that social security bene-fits are not important and 20% answered that they could have received more money by working in the informal sector. About 57% of the respondents working without a signed contract reported that they were satisfied with their current job conditions. However, not all people in the informal sector are there by choice. Many individuals may be displaced involuntarily into this sector because this is their only chance of securing an income. Around 44% of the respondents in the 2007 survey stated that they actually have no other choice and therefore would accept a job without social security benefits.
In line with Henley et al. (2009), we adopt three different definitions of informality for Tajikistan1. Table 3 presents proportions of workers, who report wages and who are classified as informal under each of the following:
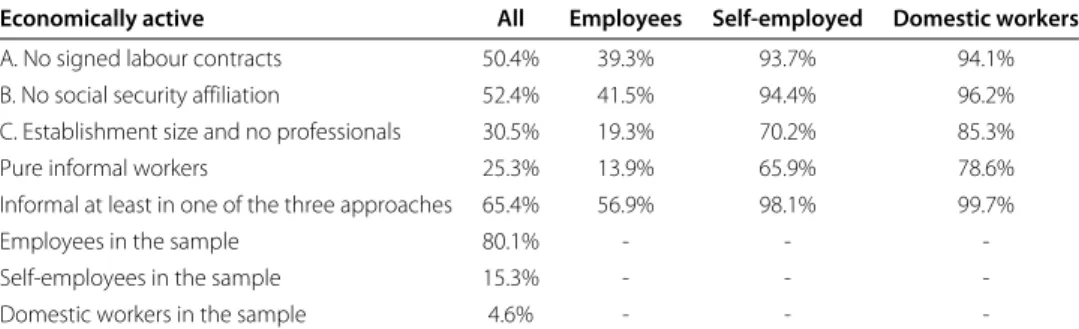
Definition A contract status: there is a widespread belief that employment relations should be legitimized in a written employment contract. A person is classified as an infor-mal worker if he/she works without a signed labour contract. The data indicates that 50.4% of all economically active in the sample are employed without any written contract. Overall, 39.3% of employees, 93.7% of self-employees, and 94.1% of domestic workers work without any written contract (see Table 3).
Definition B social security affiliation status: a person is defined as an informal employee if he/she has no affiliation to the social security scheme. Based on this definition 52.4% of all workers who report wages have no social security affiliation.
Definition C establishment size: a person is defined as informal if he/she is employed in an establishment of less than five employees. However, including only enterprises with less than five employees results in possible inclusion of some professionals and managerial workers (2.3%) who could have relatively high incomes and who are considered to be in the formal sector. Therefore, we exclude professional group from definition C. This mea-sure provides the smallest estimates at around 31% of all economically active workers as being informal. Around 19% of economically active employees and 70% of self-employed are covered by this definition (see Table 3).
Table 3 Proportion of informal employees by main employment status, Tajikistan 2007
Economically active All Employees Self-employed Domestic workers
A. No signed labour contracts 50.4% 39.3% 93.7% 94.1% B. No social security affiliation 52.4% 41.5% 94.4% 96.2% C. Establishment size and no professionals 30.5% 19.3% 70.2% 85.3% Pure informal workers 25.3% 13.9% 65.9% 78.6% Informal at least in one of the three approaches 65.4% 56.9% 98.1% 99.7%
Employees in the sample 80.1% - -
-Self-employees in the sample 15.3% - -
-Domestic workers in the sample 4.6% - -
-Notes:The proportions are based on a sample of workers that report wages. Source: Authors calculations from Tajikistan 2007 LSMS.
About 25% of the workforce can be classified as informal by all three measures and around 40% of workers are classified as informal on the basis of having no signed labour contract and no social security coverage. The percentage of workers classed as informal under measure A and measure B, but not under measure C is 14.4%. Around 27% of the economically active are classified as informal workers on the basis of having no social security membership and working in the small establishment size.
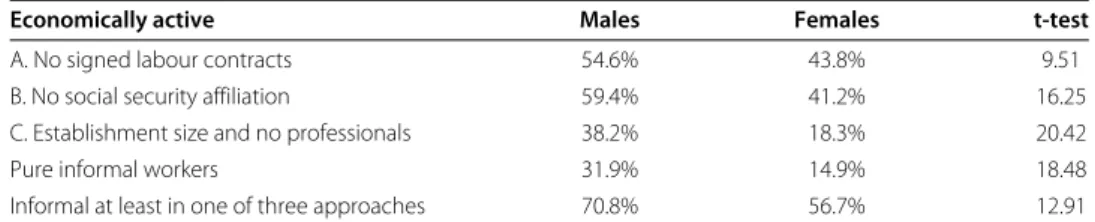
Table 4 reveals the different proportions of males and females for these three definitions of informality. Informal employment amongst males is highest when measured by no social security affiliation and lowest when measured by establishment size. Female infor-mality is highest when measured by contract status. Around 44% of females work without any written contract. Overall, female informality is much lower. Defining informality by all three approaches indicates that 31.9% of males and 14.9% of females in Tajikistan work as informal.
Different definitions of informality are capturing different groups of workers. Each indi-cator on its own has conceptual and statistical shortcomings as a proxy for informal employment but taken together they may provide a robust approximation. Lehman and Zaiceva (2013) find that the incidence of informal employment varies widely across defini-tions. Kapeliushnikov (2012) also confirms that depending on its definition, the incidence of informal employment can vary between 10% to 25% and that the social and demo-graphic profile of informal workers changes when using different definitions. The current paper considers as informal all individuals who operate without social security affiliation, who are employed in small enterprises and who work without any written contract. At the same time, we place in the formal sector those workers who are not classified as informal under any of the three measures.
4 The data
The data used in this paper is from the 2007 Tajikistan Living Standard Measure-ment Survey (LSMS), which provides comprehensive information on education, health, employment, housing, migration and income. Table 5 reports the means and standard deviations of the chosen variables broken down into those working in the formal and those employed in the informal sector, defined as above. Samples are tested to see whether the data sets support separation. The reported t-statistics in the descriptive table indicate that almost all variables are significantly different from each other. After dropping obser-vations with missing values for the variables used in the estimation we were left with a total number of 8,123 individuals. Of these observations 25% were for individuals who fall into all three informal definitions. Hourly net earnings are defined as reported monthly
Table 4 Proportion of informal employees by gender, Tajikistan 2007
Economically active Males Females t-test
A. No signed labour contracts 54.6% 43.8% 9.51
B. No social security affiliation 59.4% 41.2% 16.25 C. Establishment size and no professionals 38.2% 18.3% 20.42
Pure informal workers 31.9% 14.9% 18.48
Informal at least in one of three approaches 70.8% 56.7% 12.91
Notes:The proportions are based on a sample of workers that report wages; t-test for difference between women and men. Source: Authors calculations from Tajikistan 2007 LSMS.
Table 5 Summary statistics, 2007 Tajikistan
Formal Informal
Variables Mean Std. Dev. Mean Std. Dev. t-stat
lhwage Log of hourly wage 1.09 1.20 1.91 1.04 -27.83 school Years in education 10.47 3.06 9.34 2.22 15.35
age Age 36.16 13.00 34.80 12.01 4.18
agesq Age squared 1476.62 1001.95 1355.30 885.15 4.88 tenure1 1 if less than 7 months 0.12 0.32 0.16 0.37 -5.67 tenure2 1 if 1 if 7–12 months 0.09 0.28 0.12 0.33 -4.91 tenure3 1 if 1–2 years 0.17 0.38 0.23 0.42 -5.86 tenure4 1 if 3–5 years 0.22 0.42 0.25 0.43 -2.20 tenure5 1 if 6–10 years 0.12 0.32 0.11 0.32 0.61
married 1 if married 0.62 0.49 0.68 0.47 -4.59
ethnicity 1 if Tajik ethnicity 0.74 0.44 0.78 0.42 -3.50
female 1 if Female 0.44 0.50 0.23 0.42 17.42
private 1 if in Private sector 0.44 0.50 0.65 0.48 -17.32 occupat1 1 if Administrative 0.02 0.13 0.00 0.03 5.78 occupat2 1 if Skilled &Trade 0.06 0.24 0.31 0.46 -31.54 occupat3 1 if Service 0.31 0.46 0.11 0.31 18.25
occupat4 1 if Sales 0.12 0.32 0.31 0.46 -20.70
occupat5 1 if Machines &oper 0.04 0.20 0.12 0.33 -13.10 occupat6 1 if Elementary 0.10 0.30 0.15 0.36 -6.45
rural 1 if Rural 0.64 0.50 0.56 0.50 6.88
region1 1 if Dushanbe region 0.19 0.39 0.23 0.42 -4.46 region2 1 if Sogd region 0.17 0.37 0.27 0.45 -10.71 region3 1 if Khatlon region 0.39 0.49 0.20 0.40 15.51 region4 1 if Rrp region 0.16 0.37 0.24 0.43 -8.33 region5 1 if Gbao region 0.10 0.30 0.05 0.22 6.71
N 6065 2058
earnings divided by 4.33 and then divided by reported weekly hours of work. The con-trol variables used in the analysis include education (total number of years of schooling), age (linear and quadratic terms), variables for individuals years of tenure with the current firm, controls for marital status, Tajik ethnicity, private sector employment, occupations, rural settlement, and a set of regional variables to pick up regional effects.
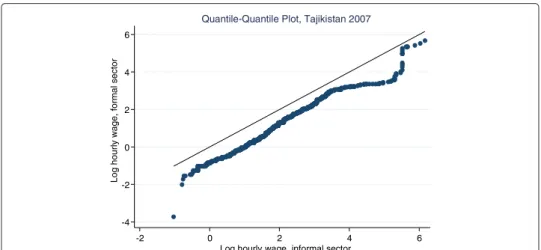
The descriptive statistics highlight some interesting patterns. The logarithm of hourly net earnings in the informal sector is higher than those found in the formal sector. The kernel density, which plots both densities, shows that the informal wage curve is situated to the right of the formal sector one. Empirical evidence suggests that higher minimum wages are associated with lower formal sector employment, at least in countries where the minimum wage is binding in the formal sector (e.g. Carneiro (2001)). Examining the earnings distribution of formal and informal employees provides an indication of whether the minimum wage is binding for formal employees, a key determinant of whether min-imum wage has an impact on informality. The vertical line in Figure 2 represents the minimum wage. Very few formal employees and even a smaller proportion of informal employees earn less than the minimum wage. Based on this evidence, it seems unlikely that the minimum wage is a particular important cause of informality in Tajikistan.
The quantile-quantile (Q-Q) plot shows that all observations are below the diago-nal line, implying that wages for informal workers are higher than their formal workers
0.345 Somoni1 0.1 0.2 0.3 0.4 0.5 0.0 De nsit y -4 -2 0 2 4 6
Log hourly wages Informal Formal
Figure 2 Kernel density estimates of log hourly wage in formal and informal sector.Source: Tajikistan 2007 LSMS.12007 Minimum salary per hour (0.345 Tajik Somoni=Log value of−1.0635). The somoni (Tajik:COMH ¯N) is the currency of Tajikistan.
counterparts. Income inequality is also stronger for higher earners (see Figure 3). This preliminary evidence illustrates significant discrepancy between formal and informal workers in Tajikistan.
In addition, descriptive statistics show that the informal sector is strongly male dom-inated. Around 77% of informal workers are males. The average age of the workers in informal sector is lower than the age of individuals in the formal sector. There are marked differences between sectors in terms of education. The total number of years in schooling is higher for formal workers. Around 65% of those working in the private sector and only 2% of public sector workers are informally employed. Informal employment is more rural than urban with around 56% of pure defined informal workers in rural areas. Although most studies write specifically about the informal sector in the urban areas, it is surely not possible to deny the existence of similar enterprises in rural areas as in our case. Finally, comparing wages across the formal and informal sectors might suggest that at least some of the differences in wages may be due to the different distributions of occupations across the two sectors. Around 31% of pure informal workers are employed in trade and sales,
-4 -2 0 2 4 6 -2 0 2 4 6
Log hourly wage, informal sector Quantile-Quantile Plot, Tajikistan 2007
Log hourly wage, formal sector
Figure 3 Comparing formal and informal wage distributions in Tajikistan, Q-Q plot.Source: Tajikistan 2007 LSMS.
and around 15% are in elementary occupational jobs (unskilled workers, street vendors, cleaners). Some regions have higher shares of informal employment. In particular the informal employment is highest in Sogd region.
5 Econometric methodology
5.1 Machado and Mata decomposition based on Oaxaca-Ransom (1994) approach
A common feature of much of the literature is that the sectoral analysis is conducted at the mean of the earnings distribution, with no attention paid to how wage differential may vary across the distribution. Therefore, to decompose the differential in the formal and informal log wages into a component due to differences in labour market charac-teristics between sectors and a component due to difference in the rewards formal and informal workers receive for those labour market characteristics, we utilise Machado and Mata’s (2005) technique which allows for calculation of the differential across the whole distribution. Based on Koenker-Basset (1978), Machado and Mata (2005) pro-pose a method to extend the traditional Oaxaca-Blinder decomposition method. Their main methodological procedure is to simulate a conditional marginal wage distribution estimated through quantile regression. We modify that approach by introducing a mea-sure of non-discriminating earnings structure and taking into account the index number problem suggested in Neumark (1988) and Oaxaca and Ransom (1994). Neumark (1988) shows that the non-discriminatory wage structure can be estimated from an earnings equation estimated over the pooled sample of both groups. This is the non-discrimination equation, which is the benchmark in the estimation of the Oaxaca and Ransom decompo-sition. The question we address by the proposed decomposition framework is how much would the formal-informal wage differential change across the distribution if both formal and informal sector workers were paid according to a common wage structure, but their work related attributes remain unchanged.
In order to undertake a decomposition analysis the earnings equation is estimated for quantiles across the distribution for both formal and informal sector workers and the counterfactual density distribution is generated following the extended Machado and Mata (2005) methodology. Specifically, the marginal earnings distributions can be briefly described as follows:
Step 1 : Generate a random sample of sizem from a uniform distribution
U[0, 1]u1. . ..,um. This will give a series of numbers telling us which percentiles
are to be estimated.
Step 2 : Estimate for each percentile derived in the first step, regression coefficients for formal, informal and the pooled sample:βˆuformi (θ ),βˆuin
i(θ ),βˆ
∗
ui(θ ),i=1. . ..N,
whereβˆuformi (θ )areuthi quantile regression estimates taken from the log earnings equation for formal employees;βˆuinfi (θ )areuthi quantile regression estimates taken from the log earnings equation for informal employees, andβˆu∗i(θ )areuthi quantile regression estimates taken from the log earnings equation for all workers.
Step 3 : For each percentile, characteristics of a randomly drawn sample of 10,000 formal and informal employees (with replacement) are used to predict wages by using the estimated coefficient vectorsβˆuformi (θ ),βˆ
inf
ui (θ )andβˆu∗i(θ ). This process generates sets of predicted wages covering the whole distribution and enables us
to calculate the wage distribution for formal informal and for both formal and informal employees together. The vectors of characteristics for formal{ ˜Xiform}Ni=1 and informal{ ˜Xiinf}Ni=1are then used to predict (log) hourly earnings for formal { ˜wuformi = ˜X
form i βˆ
form
ui }Ni=1and informal sector workers{ ˜w
inf ui = ˜X inf i βˆ inf ui }Ni=1.
These predicted wages are equivalent to a random sample of sizeN drawn from the marginal wage distributions for formal(wform)and informal(winf)sector workers. Counterfactual densities for the formal and informal sector employees being rewarded equally are found as{ ˜wcformi = ˜Xiformβˆui∗}Ni=1and{ ˜wcinfi = ˜Xinfi βˆui∗}Ni=1 which are the densities that would arise if formal and informal workers retained their own labour market characteristics but were paid like a randomly chosen individual from the entire sample.
Step 4 : Differences inθthpercentiles of the estimated marginal wage distribution are then used to decompose the formal-informal sector wage gap into an effect due to characteristics in the formal and informal sector being rewarded differently (coefficient effect) and an effect due to differences in the distribution of worker characteristics in the two sectors (characteristic effect).
Thus, the contribution of any characteristics in accounting for differences in earnings between formal and informal employees at theθthpercentile is given by:
Qθ(w˜ form| ˆβform)−Qθ(w˜inf| ˆβinf)=
=Qθ[(w˜ form| ˆβform)−Qθ(w˜cform| ˆβ∗)+Qθ(w˜cinf| ˆβ∗)−Qθ(w˜inf| ˆβinf)]
+Qθ[(w˜cform| ˆβ∗)−Qθ(w˜cinf| ˆβ∗)]+residuals
where Qθ is theθth percentile of the earnings distribution andw˜i| ˆβj is the estimated marginal earnings distribution for theithindividual based on thejthquantile regression
estimates.
The first two terms of the equation identifies the part of any wage difference explained by differences in the returns that formal and informal workers receive for a given set of characteristics (the coefficient effect)2. The coefficient component is considered to con-tain the effects of both unobservable workers differences in characteristics that the labour market rewards and the discrimination in the labour market. The third term identifies the part of the hourly wage difference at the quantile, explained by differences in the char-acteristics of formal and informal workers (the charchar-acteristics effect). This is the portion of the wage differential that may be attributed to differences in the characteristics pos-sessed by formal and informal workers. The difference between quantile of the marginal wage densities between formal and informal employment distributions weighted by the characteristics of workers randomly chosen in the economy does contain an additional component, which we treat as a residual. The residual term is typically of second order of importance and tends to became smaller with a larger number of simulations. Standard errors for the reported components of the decomposition were obtained using a standard bootstrapping method3.
5.2 Correcting for endogenous sector choice
Given that there is a choice being made by workers whether to work in the formal or informal sector, there is a potential for the sample selection bias. This bias is due to
the possibility that sorting of employees between sectors is not random and occurs on the basis of unobserved productivity-related characteristics. The present analysis for-mulates and estimates a model of sectoral attachment of individuals (the binary choice model between the informal(D= 1)and formal sector work(D= 0)is considered). A worker will be employed in a particular sector, if the offered wage exceeds the reservation wage. We follow Buchinskys (1998) approach for the selection correction in a quantile regression model by using the power series expansion of the inverse Mills ratio of the normalized estimated index.
There are two issues that need to be addressed. First, there is the identification of the selection effect and the crucial assumption is the presence of instrument and the exclusion of this instrument from the outcome equation Melly (2006). We determine individuals type of employment based on a land ownership, to the extent that infor-mal activities require access to land. Second, Buchinsky (1998) correction of sample selection in the context of quantile regression requires higher order selection terms be included in the model. There is however, the added complication that the con-stant term in the quantile wage regression is not identified in this instance, as it is conflated with the constant term of the higher order power series used to control for sample selection. The problem is one of distinguishing between the intercept and the first term in the power series approximation to the selection correction term. Buchinsky (2002) provides a detailed discussion of ways to identify the constant along the lines suggested by Andrews and Schafgans (1998). In our study an assessment of the impor-tance of the selectivity of the sector choice is made following Buchinsky (1998) based on Andrews and Schafgans (1998) idea of identification at infinity. The intuition is as follows: if we choose a sub-sample of workers with labour market characteristics such that the probability of being in a given sector is arbitrary close to 1, we can use this sub-sample to estimate the intercept in the earnings equation, without adjusting for selection.
In order to analyse the formal-informal wage differential accounting for endogenous sector choice, the Machado and Mata decomposition algorithm is modified. Following Badel and Peña (2010), we calculate the selection effect as the difference between the dis-tributions of observed and the potential wages of formal and informal sector workers. We generate random samples of formal and informal sector workers using the formal and informal sample selection adjusted coefficients combined with the labour market char-acteristics of all workers not just those who work in the formal sector. The two selection effects are given as:
Qθ(w˜ form)−Qθ(w˜cform)- selection effect for formal sector workers and
Qθ(w˜inf)−Qθ(w˜cinf)- selection effect for informal sector workers
˜
wcformi = ˜Xi∗βˆuformi +ectf andw˜cinfi = ˜X∗iβˆuinfi +ectf withQθ(ectf)=0
where w˜form and w˜inf are the observed distributions of formal and informal sector workers;w˜cform andw˜cinf are simulated counterfactual distributions for the formal and
informal sector workers using formal and informal sector selection adjusted coefficients and being sampled from the whole population of workers.
The endogeneity corrected differential or the differential that we would observe if the employees sorted randomly between sectors conditional on their characteristics is decomposed as follows: Qθ(w˜form)−Qθ(w˜cform) −Qθ(w˜in)−Qθ(w˜cinf)
Further, the selection effect can be decomposed into a portion due to observable labour market characteristics and a portion due to unobservable characteristics by modifying the Machado and Mata algorithm. This produces another two distributions: the distribu-tion of formal sectors wages (respectively the distribudistribu-tion of informal sectors wages) that would have prevailed if prices accounted for selection, and workers had the distribution of labour market characteristics of formal (informal) sector workers not of all workers.
Qθ(w˜form)−Qθ(w˜cform)= Qθ(w˜form)−Qθ(w˜sform) −Qθ(w˜cform)−Qθ(w˜sform)
where w˜sformi = ˜Xformi βˆuformi +esformwithQθ(esform)=0
Note that in this exerciseβˆuformi (θ )needs to be estimated controlling for sample selection
bias. The first term in the brackets is interpreted as the effect of unobservable, while the second term is interpreted as the effect of observables. Specifically, the difference between formal sector workers adjusting for selection counterfactual and the potential distribution tells us how much of the selection effect can be explained by differences in the distribution of characteristics between those who are in the formal sector and those who are not. The selection effect for the informal sector is given in a similar way:
Qθ(w˜inf)−Qθ(w˜cinf)= Qθ(w˜in)−Qθ(w˜sinf) −Qθ(w˜cinf)−Qθ(w˜sinf)
where w˜sinfi = ˜Xiinfβˆuinfi +e
sinf withQ
θ(esinf)=0
The endogeneity corrected differential due to the unobservable characteristics is given as the difference between the effect of unobservables for formal and informal sector workers: Qθ(w˜form)−Qθ(w˜sform) −Qθ(w˜inf)−Qθ(w˜sinf)
Finally, the endogeneity corrected differential due to the observable characteristics is given as the difference between the observable components for formal and informal sector workers: Qθ(w˜cform)−Qθ(w˜sform) −Qθ(w˜cinf)−Qθ(w˜sinf) 5.3 Matching approach
Another potential problem revealed in the literature associated with the decomposition approach is misspecification due to differences in the supports of the empirical dis-tribution of individual characteristics for formal and informal workers. There maybe a combination of individual characteristics for which it is possible to find formal, but not informal sector workers. With such combination of characteristics one cannot compare earnings between formal and informal workers Ñopo (2008). While parametric methods
may give biased estimates as they use observations outside the common support of indi-vidual characteristics, the matching provides the wage outcomes of formal and informal workers only with comparable characteristics Heckman et al. (1998). We can estimate how much formal sector workers would earn if they had the same distribution of human capital characteristics as informal sector workers. The current paper applies Ñopo (2008) non-parametric technique to decompose the gap in terms of explained and unexplained components, considering the problem of differences in the supports. The method applied decomposes the wage differential into four additive components, three of which can be attributed to the differences in individual characteristics and the fourth to the existence of a combination of differences in unobservable characteristics and discrimination (see Ñopo (2008) for more details). In that sense, the wage gap can be expressed as following and can be interpreted as it is traditionally done in the linear decomposition setup, with two components, one that can be explained by differences in observable characteristics and one that cannot.
=(M+X+F)+0
Where:0corresponds to the unexplained part of the gap. It is the share of the wage gap that cannot be attributed to differences in characteristics of the individuals and is typically attributed to a combination of both unobservable characteristics and discrimination;F
is the part of the gap that can be explained by the differences in characteristics between two groups of informal sector individuals, that are in and out of the common support of the variables defined by match-variables;Xis the part of the gap that can be explained
by differences in the distribution of characteristics of formal and informal sector workers over the common support;Mis the part of the gap that can be explained by differences between two groups of formal sector workers - those who have characteristics that can be matched to the informal sector workers and those who do not;
6 Empirical results
6.1 Decomposition results
The results from the decomposition analysis are reported in Table 6. In the second col-umn, we present the raw wage gap estimates, calculated as the difference in log hourly wages between formal and informal sector employees at certain points of the wage dis-tribution. In the next columns, we give the predicted wage gaps and contribution of the coefficients and the covariates to the difference between the quantile of the formal sec-tor wage distribution and quantile of the informal secsec-tor wage distribution, together with the percentage of the gap that is attributable to the coefficient and covariate effects, and residual terms due to the differences between the empirical and simulated densities. The interesting part is the differences in rewards (the coefficient effect). If the two sectors reward the same characteristic differently, it might be an indication of different wage setting mechanisms in the two sectors. The bootstrapped standard errors for these con-tributions are given in parentheses. Estimates at the 10th, 20th, 30th, 40th, 50th, 60th, 70th, 80th, and 90th percentiles are reported. The results over the whole distribution are best viewed graphically. Figure 4 plots the estimated coefficient effects along the earnings distribution.
The estimates show that the raw wage differential is negative but diminishes and is con-siderably narrower at the top of the earnings distribution compared to the bottom of the
Table 6 Decomposition of changes in parameters of the distribution, Tajikistan 2007
Percentiles Raw gap Predicted gap Due to coefficients Due to covariates Residuals
10th -1.050 -1.047 -0.443 [42%] -0.604 [58%] -0.003 [0%] (0.0234) (0.0352) (0.0247) 20th -1.058 -1.012 -0.390 [37%] -0.622 [59%] -0.047 [4%] (0.0185) (0.0292) (0.022) 30th -1.022 -0.974 -0.370 [36%] -0.604 [59%] -0.048 [5%] (0.0184) (0.0274) (0.0199) 40th -0.916 -0.892 -0.343 [37%] -0.549 [60%] -0.024 [3%] (0.0174) (0.0273) (0.0206) 50th -0.783 -0.792 -0.306 [39%] -0.486 [62%] 0.009 [-1%] (0.018) (0.0265) (0.0193) 60th -0.758 -0.715 -0.268 [35%] -0.447 [59%] -0.042 [6%] (0.0174) (0.0263) (0.0191) 70th -0.664 -0.669 -0.239 [36%] -0.429 [65%] 0.004 [-1%] (0.0184) (0.0269) (0.0201) 80th -0.632 -0.639 -0.221 [35%] -0.418 [66%] 0.008 [-1%] (0.0218) (0.0314) (0.0228) 90th -0.652 -0.633 -0.216 [33%] -0.418 [64%] -0.019 [3%] (0.0266) (0.038) (0.0267)
Notes:Machado and Mata Oaxaca-Ransom decomposition. The bootstrapped standard errors in parenthesis. Bootstrap estimates are based on 800 replications. The differential is calculated by every 5th percentile. The main percentile levels are presented. The specification controls for total number years of education, potential experience, marital status, job tenure, Tajik ethnicity, dummies for female, being in a private sector, rural settlement and occupational dummies.
distribution. The raw wage gap is sizeable, especially at the lower end of the distribu-tion. Both coefficients and covariates contribute to the actual wage gap and their effect is significantly different from zero. The largest fraction of the formal-informal wage gap is attributable to the differences in characteristics. Overall, the model works fairly well, as the residuals account for a relatively small portion of the total wage gap.
The unexplained component of the inter-sectoral wage differential (coefficient effect) works in favour of the informal sector (see Table 6). The coefficient effect is negative across the whole earnings distribution. The penalty faced by formal sector workers is
-0.2 0.0 0.2 -0.4 -0.6 0 .1 .2 .3 .4 .5 .6 .7 .8 .9 Quantile
Coefficients QR 95% confidence intervals
Formal/informal wage differential
Formal vs. informal wage gap
especially large at the lower end of the distribution where the informal sector employees earn substantially higher wage premium. The wage penalty for formal workers ranges between 42% of the relevant gap at the bottom of the earnings distribution to around 33% at the top of the distribution. Overall, at the top of the distribution, informal workers face a lower wage premium. This might be due to the fact that at the top of the earnings distribution formal workers tend to be in larger firms which pay higher wages and we might expect higher incentives to be registered. The large informal earnings found here are in line with Marcouiller et al. (1997) who find a wage premium associated with work in informal sector in Mexico which they explain with different benefit systems in the two sectors.
Note also that our sample is strongly male dominated and this might affect the results4. However, a detailed examination of formal versus informal wage differential among males indicates that identical male workers still earned more in the informal sector than in the formal one. Interestingly, the covariate effect is negative across the whole earnings distribution, indicating that informal workers strongly dominate with their endowment component. Moreover, at the top end of the earnings distribution, the large proportion of the raw gap about 64% appears to be the result of characteristics effect. We find the high-est fraction of the gap is attributable to differences in characteristics. However as higher education seems to be associated with the formal employment, we might indicate that factors other than human capital endowments explain the wage disparities in the country generally attributed to labour market imperfections.
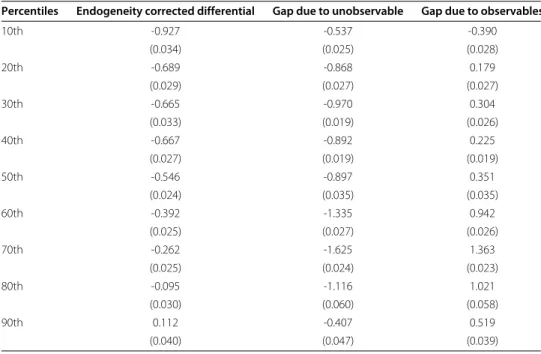
6.2 Endogeneity corrected sector wage differential
The simulated differential corrected for endogenous sector choice, presented in Table 7 is the differential that we observe if the employees were sorted randomly between sec-tors conditionally on their labour market characteristics. Further, we present the gap that remains due to the unobservable characteristics and gap due to observable characteris-tics. The bootstrapped standard errors for these contributions are given in parenthesis. Bootstrap estimates are based on 800 replications.
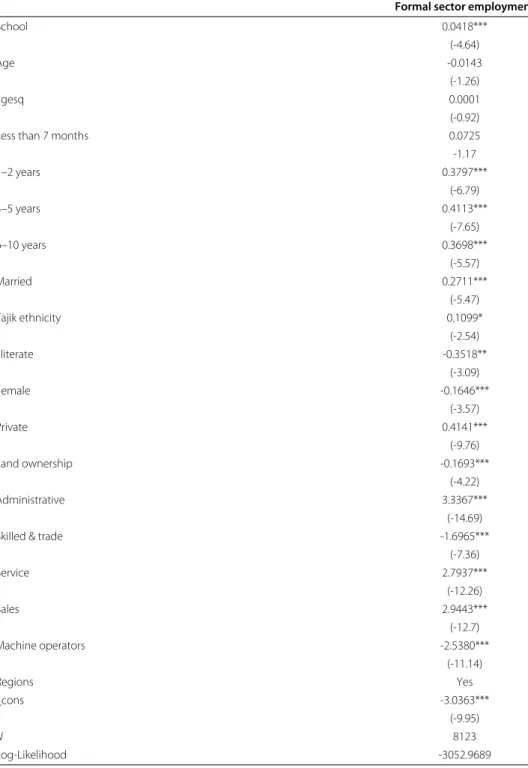
Before presenting the results concerning the formal-informal wage differential, one may be interested in individual characteristics correlated with formality status in Tajikistan. In order to model the selection between the formal and informal sectors, the probability of employment in the formal sector is estimated and significance of the land ownership as a valid instrument is discussed. Table 8 presents the probit estimates for determi-nants of the formality status. It can be seen that the number of years in education is significant and increases the probability of being in formal sector. The probability of being a formal employee is higher for those with 3–5 years job tenure, but lower for those with 6–10 years. The probability of formal employment declines with age. Females in Tajikistan are less likely to be in the formal sector. Being married and belonging to Tajik ethnic group have a strong, positive and significant effect. Illiteracy in Tajikistan is negatively associated with formal sector activity which suggests that workers with-out any basic educational skills are less likely to be in the formal sector. The variable measuring land ownership has a significant and negative effect on the probability of being in formal sector, which is not surprising given that agricultural activities in rural areas are closely related with informal sector employment. The occupational variables are statistically significant. The largest positive quantitative impact on the probability
Table 7 Decomposition of formal-informal wage differential correcting for endogeneity, Tajikistan 2007
Percentiles Endogeneity corrected differential Gap due to unobservable Gap due to observables
10th -0.927 -0.537 -0.390 (0.034) (0.025) (0.028) 20th -0.689 -0.868 0.179 (0.029) (0.027) (0.027) 30th -0.665 -0.970 0.304 (0.033) (0.019) (0.026) 40th -0.667 -0.892 0.225 (0.027) (0.019) (0.019) 50th -0.546 -0.897 0.351 (0.024) (0.035) (0.035) 60th -0.392 -1.335 0.942 (0.025) (0.027) (0.026) 70th -0.262 -1.625 1.363 (0.025) (0.024) (0.023) 80th -0.095 -1.116 1.021 (0.030) (0.060) (0.058) 90th 0.112 -0.407 0.519 (0.040) (0.047) (0.039)
Notes:Machado and Mata Oaxaca-Ransom decomposition correcting for endogenous sector choice. The bootstrapped standard errors in parenthesis. Bootstrap estimates are based on 800 replications. The differential is calculated by every 5th percentile. The main percentile levels are presented. The specification controls for total number years of education, potential experience, marital status, job tenure, Tajik ethnicity, dummies for female, being in a private sector, rural settlement and occupational dummies.
of informal employment arises in trade, sales and machine operations occupational categories
The endogeneity corrected estimates reported in Table 7 clearly indicate that non-random sector selection is important issue in the calculation of the formal-informal wage differential. The inclusion of the selectivity corrected power series terms in the com-putation of the sector wage gap seems to produce different estimates compared to the uncorrected wage gap estimates5. We find that endogeneity corrected differential tends to be lower as compared to the predicted gap without considering endogeneity. The pre-mium for the formal sector workers decreases throughout the wage distribution and again the estimated differential is negative across the whole earnings distribution. Only at the top of the distribution, there is a sort of positive discrimination, in the sense that for-mal sector workers with higher skills have better returns than inforfor-mal sector workers with similar skills. The distributional methodology applied, allows us to decompose the selection effect into a portion due to observable labour market characteristics, and the remainder due to unobservable. Selection is due both to differences in the labour market characteristics between formal and informal sector workers and to unobserved charac-teristics. In contrast to the previous estimates, the effect of the observable is found to be positive across suggesting that those who select themselves into formal sector employ-ment actually have more favourable characteristics than do their informal counterparts. Only at the bottom of the distribution, the characteristics effect is found to be negative.
6.3 Matching approach
Finally, taking advantage of matching approach, which allows us to compare similarly-skilled formal and informal sector workers, we consider differences in the distribution
Table 8 Probit model of formal sector employment
Formal sector employment
School 0.0418*** (-4.64) Age -0.0143 (-1.26) agesq 0.0001 (-0.92)
Less than 7 months 0.0725
-1.17 1–2 years 0.3797*** (-6.79) 3–5 years 0.4113*** (-7.65) 6–10 years 0.3698*** (-5.57) Married 0.2711*** (-5.47) Tajik ethnicity 0.1099* (-2.54) Illiterate -0.3518** (-3.09) Female -0.1646*** (-3.57) Private 0.4141*** (-9.76) Land ownership -0.1693*** (-4.22) Administrative 3.3367*** (-14.69)
Skilled & trade -1.6965***
(-7.36) Service 2.7937*** (-12.26) Sales 2.9443*** (-12.7) Machine operators -2.5380*** (-11.14) Regions Yes _cons -3.0363*** (-9.95) N 8123 Log-Likelihood -3052.9689 * p<0.10, ** p<0.05, *** p<0.01.
of their observed characteristics. Table 9 reports the descriptive statistics of the formal and informal sector workers after the matching and Table 10 shows delta method results and distributional estimates recognizing the existence of differences in the supports and considering differences in the distributions on the common support. The characteris-tics for the matched formal workers gets closer to the informal sector workers, however the gap in their earnings is still evident. As can be seen, there is little difference in the average years of education in the two sectors. In contrast, there are some notable
Table 9 Descriptive statistics of the sample after matching
Formal Informal
Variables Mean Std. Dev. Mean Std. Dev.
Log of hourly wage 0.961 1.257 1.990 1.108
Years in education 9.468 1.920 9.351 1.630
Age 32.457 11.310 33.479 11.499
Age squared 1181.318 798.112 1252.933 822.073
1 if less than 7 months 0.108 0.311 0.160 0.367
1 if 1 if 7–12 months 0.071 0.257 0.101 0.302 1 if 1–2 years 0.217 0.413 0.233 0.423 1 if 3–5 years 0.295 0.456 0.262 0.440 1 if 6–10 years 0.099 0.298 0.088 0.283 1 if married 0.666 0.472 0.692 0.462 1 if Tajik ethnicity 0.720 0.449 0.742 0.438 1 if Female 0.421 0.494 0.199 0.400 1 if in Private sector 0.658 0.475 0.635 0.482 1 if Administrative 0.016 0.127 0.002 0.043 1 if Skilled &Trade 0.049 0.215 0.252 0.434 1 if Service 0.501 0.500 0.145 0.352 1 if Sales 0.125 0.330 0.299 0.458 1 if Machines &oper 0.035 0.184 0.130 0.336 1 if Elementary 0.105 0.307 0.172 0.378 1 if Rural 0.812 0.390 0.715 0.452 1 if Dushanbe region 0.086 0.280 0.142 0.349 1 if Sogd region 0.166 0.372 0.325 0.468 1 if Khatlon region 0.535 0.499 0.237 0.425 1 if Rrp region 0.156 0.363 0.248 0.432 1 if Gbao region 0.057 0.232 0.049 0.215 1887 1069
differences in industry distribution across sectors. For example, a much larger propor-tion of the workforce in the formal sector is employed in service sector. It is found that informal sector worker earns on average 32 percentage more than a typical for-mal worker. We focus mainly on the analysis of the quantile distribution of unexplained differences in pay, which have been taken as the difference between the wage distribu-tions at the respective percentiles after matching. As before, we find that informal sector workers are overpaid and the premium decreases along the wage distribution. Restrict-ing the analysis to those individuals with comparable characteristics in both sectors, still the more qualified formal sector workers do face a wage penalty across the entire earn-ings distribution. After matching on age, marital status, years of education, job tenure, private sector and rural settlement, the decomposition reveals that differences in the distributions of individual characteristics on the common support accounts for a large share of the gap (X = −8.5%). The most important component of the gap is due
to the unexplained part of the gap (0). The comparative question is to what extent do the results obtained by matching differ from those obtained by MM decomposition approach. We empirically show that there are not substantial differences in the overall trend, however accounting for sector differences in the supports changes the unexplained differences in earnings from a negative coefficient of 0.443 at the 10th percentile to a negative 1.05.
Table 10 Decomposion of the formal-informal sector gap, matching approach
Total gap F 0 X M Unexplained Explained perc F perc I
-0.430 0.013 -0.319 -0.085 -0.038 -0.319 -0.110 28.5% 53.0% (0.015)
Wage gap for different percentiles of the wage distribution
10th 20th 30th 40th 50th 60th 70th 80th 90th
On the support
-1.050 -1.088 -1.062 -0.944 -0.734 -0.660 -0.531 -0.490 -0.322 Out-of-support
-1.050 -0.998 -0.981 -0.875 -0.808 -0.726 -0.644 -0.688 -0.614
Notes:The variables included in the specification are age, marital status, years of education, job tenure, private sector, rural settlement; perc F is the percentage of the formal sector individuals that are in the common support of the matching variables; perc I is the percentage of the informal sector individuals that are in the common support.
Comparing the decomposition based on quantile regressions with the decomposition based on matching, we find no substantial differences. The estimated differential is found to be in favour of informal sector workers. Clearly, the MM approach adopts a non-discriminatory wage structure as a benchmark, whereas the endogeneity corrected and matching do not use it, hence a comparison between the three approaches is not feasible. However, the methods applied could provide interesting policy relevant results.
7 Conclusion
This paper contributes to the existing literature by defining informal sector employment and decomposing differences in earnings distribution between formal and informal sector employment for Tajikistan, a country whit a limited evidence on informal sector employ-ment. Our objective was to analyse the differential using different econometric techniques taking into account not only the explained and unexplained components but also consid-ering the problem of differences in the support. The Machado and Mata (2005) method is applied, which is designed to simulate the counterfactual distribution that would arise if formal and informal sector workers retained their own labour market characteristics but were paid like a randomly chosen individual from the entire sample. The decomposi-tion analysis amounts to examine the extent to which the observed earnings differential is attributable to differences in the observable characteristics and differences in returns to these characteristics. The possibility of endogenous sector choice is also accounted for. Finally, the advantage of matching decomposition of the gap is explicitly to account for differences in the supports of the distribution of characteristics. The method provides useful information on the unexplained wage gap not only at the mean, but also on the distribution of the gap over the entire wage distribution.
Our findings report a significant high level of informal employment in Tajikistan and a sizeable gap for all the measures used into the analysis. Around 65% of the 2007 Tajik sample is classified as informal in at least one of the proposed definitions, with males having higher informal employment rates than females. Informal sector workers tend to be less qualified and more likely to be employed in the trade and sales services. Around 65–67% of private sector workers are informally employed.
The uncorrected wage differential estimates indicate a strong wage penalty for formal sector workers throughout the whole earning distribution. The penalty is especially large at the lower end of the distribution, where 48% of the observed wage gap is attributed
to differences in returns. After performing the matching comparisons, the unexplained earnings differential continues to favour informal sector workers. Following Marcouiller et al. (1997) we attribute the informal sector wage premium in Tajikistan on the ground of compensating differentials theory, which would lead one to expect informal sector wages to be higher than formal sector wages. Benefits obviously differ between workers covered by social security and those who are not. The decomposition results reveals that approx-imately 60–70% of the observed uncorrected differential can be ascribed to differences in distribution of characteristics between formal and informal sector workers. At the top end of the conditional earnings distribution, the characteristics effect plays a larger role in explaining the formal sector wage gap. Nonetheless, most of the formal sector wage gap across the distribution continues to be accounted for by differences in how the two sectors are rewarded.
Our findings suggest that the difference between formal and informal labour income are important and it is necessary to continue monitoring the effects of the policies designed to reduce the informal sector employment.
Endnotes
1The current paper focuses on the informal employment using household level data
and does not look at the informal activities at macro-level.
2Specifically, the technique allows the discrimination component to be disaggregated
into overpayment of formal workers (formal sector advantage) and underpayment of informal workers(informal sector disadvantage). We do not attempt in our study to decompose into these two components.
3Bootstrap estimates are based on 800 replications. 477% of the informal employees are males.
5The selection due to the unobservables into the informal sector is not the same at the
lowest and highest quantiles. A brief insight on the informal workers earnings functions, corrected for selectivity bias indicate significant sample selection at the lowest quantile level, which indicates that informal sector workers seem to be drawn from the lower end of the wage distribution and that being part of the informal sector is really a choice of low-income individuals. The results for formal sector counterparts indicate the presence of sample selection bias for individuals at the 25th quantile and not jointly significance for the rest of the earning distribution.
Competing interests
The IZA Journal of Labor & Development is committed to the IZA Guiding Principles of Research Integrity. The authors declare that they have observed these principles.
Acknowledgements
We would like to thank the comments we received from Andrew Henley and Alan Marin throughout the development of this paper. We also would like to thank an anonymous referee for very useful comments.
Responsible editor: Hartmut Lehmann
Received: 14 June 2013 Accepted: 19 November 2013 Published:
References
Abdulloev I, Gang I, Landon-Lane J (2012) Migration as a Substitute for Informal Activities: Evidence from Tajikistan. In: Lehmann H, Tatsiramos K (eds) Informal Employment in Emerging and Transition Economies, Research in Labor Economics, vol 34. Emerald Group Publishing Limited, pp 205–227
Andrews D, Schafgans M (1998) Semiparametric estimation of the intercept of a sample selection model. Rev Econ Stud 65(3): 497–517
Badel A, Peña X (2010) Decomposing the gender wage gap with sample selection adjustment: Evidence from Colombia. Revista de Analisis Economico 25(2): 169–191
Bernabè S (2002) Informal employment in countries in Transition: A conceptual framework. London School of Economics, Centre for Analysis of Social Exclusion, CASE Paper N. 56, p1–64