Phytoplankton functional traits and seston stable isotopes signature:
a functional-based approach in a deep, subalpine lake, Lake Maggiore (N. Italy)
Rossana CARONI,* Gary FREE,1Anna VISCONTI,2and Marina MANCA2European Commission - Joint Research Centre, IES-Rural, Water and Ecosystem Res. Unit, Via E. Fermi 2749, Ispra (VA) I-21027, Italy; 1Environmental Protection Agency, McCumiskey House, Richview, Clonskeagh Road, Dublin 14, Ireland; 2CNR Institute of
Ecosystem Study, Largo V. Tonolli 50, 28922 Verbania, Italy *e-mail corresponding author: rossana.caroni@jrc.ec.europa.eu
ABSTRACT
The seasonal variation of seston stable isotopes signature of carbon (δ13C) in Lake Maggiore during 2008 was related to seasonal variation of the lake phytoplankton community, investigated in terms of phytoplankton taxonomic groups, morpho-functional groups (MBFG), cell size classes and cell shape classes. Three open water stations were selected to reflect truly pelagic, influenced by littoral and riverine carbon sources; phytoplankton samples were collected from two water depths, 0-20 m and 25-50 m. Among stations dif-ferences in δ13C signatures of seston were statistically non significant, confirming that allochthonous input may become important only after exceptional rainfall events. Nonparametric multiplicative regression (NPMR) was utilized to identify among the phytoplankton parameters (taxonomic groups, MBFG, cell shapes, cell sizes) which were the best predictors of the δ13C variation. Bacillariophyceae and two morpho-functional groups, Group 6 (non-flagellated organisms with siliceous exoskeletons) and Group 3 (large filamentous algae with aerotopes) were statistically significant. Non-metric multidimensional scaling (NMS) ordination was used to investigate dif-ferences in phytoplankton samples and their relationship with δ13C variation. When morphological and functional phytoplankton traits were superimposed, the NMS ordination showed that cylinder cells (for cell shape classes), class 500-2000 mm3(for cell size classes) and Group 6 (for MBFG) were the most related to δ13C variation. Our study confirms that the variation in the pelagic δ13C seston most probably reflects changes in phytoplankton carbon isotopic signature, consequent to changes in availability of carbon sources depending on the season and due to different isotopic fractionation of phytoplankton taxonomic groups. Statistical investigations have allowed us to investigate the potential role of phytoplankton morphological and functional traits in the seasonal variation of δ13C and to suggest their importance in the interpretation of natural stable isotopes studies in lake ecosystems.
Key words: stable isotopes, seston, carbon, phytoplankton, functional analysis. Received: October 2011. Accepted: December 2011.
INTRODUCTION
The use of natural stable isotopes signatures of carbon (δ13C) has become an important tool to study food web
relationships and potential sources of organic matter in aquatic ecosystems. Carbon stable isotope signatures in animals are known to reflect quite closely those of their diet, whereas nitrogen stable isotopes signatures in ani-mals often show considerable enrichment compared to their diet (Peterson, and Fry 1987; Michener, and Schell 1994). These basic principles can provide much informa-tion about feeding relainforma-tionships and carbon sources and have been used extensively in lake food web studies.
Phytoplankton represents the autotrophic, primary pro-ducer at the base of the aquatic food web, it is therefore fundamental to identify its isotopic signal when performing a study of the whole-lake food web through stable isotopes. Several variables can influence phytoplankton δ13C in
a lake ecosystem. Primary determinants are the isotopic signatures of assimilated inorganic carbon and phyto-plankton isotopic fractionation during assimilation.
Phy-toplankton δ13C can be affected by the taxonomic
compo-sition of the phytoplankton communities, because differ-ent species fractionate δ13C differently (Falkowski 1991,
Vuorio et al. 2006).
Seasonal changes in phytoplankton δ13C generally occur in lakes (Zohary et al. 1994, Gu, and Schelske 1996, Lehmann et al. 2004). These variations have been related to changes in external loadings, phytoplankton species composition, primary productivity and concentration of dissolved inorganic C and N (DIC and DIN) (Rau et al. 1989, Grey et al. 2001). Differentiated utilization of bi-carbonate (HCO3-) by some phytoplankton species may
also contribute to the seasonal δ13C variation (Takahashi
et al. 1990). Physical variables, such as temperature, are also important determinants of δ13C seasonal changes (Rau et al. 1989). Temperature controls the solubility of CO2and in turn influences the fractionation of carbon
iso-topes during phytoplankton uptake (Rau et al. 1989, 1992). Water column thermal stratification influences cell activity, nutrients assimilation and competition, light
com-petition, rate of CO2and HCO3-diffusion and ultimately
phytoplankton species succession, abundance and com-munity structure. Thus water stratification has, in the end, a strong effect on the phytoplankton δ13C (Zohary et al.
1994).
While it is established that phytoplankton taxonomic composition can influence phytoplankton δ13C, less
rec-ognized and documented is the potential role of cell size, shape and functional traits for phytoplankton δ13C in
nat-ural communities. Several models for marine microalgae have demonstrated that species-specific parameters such as CO2permeability, enzymatic fractionation and cell
sur-face area to volume ratio play a significant role in the vari-ation of plankton δ13C (Rau et al. 1996; Popp et al. 1998;
Burkhardt 1999). Studies on marine phytoplankton cul-tures suggested that cell size and cell geometry can sig-nificantly influence phytoplankton carbon isotopic fractionation (Goericke et al. 1994; Popp et al. 1998). Phytoplankton cell size is a key feature in the ecological relationships, being related to the efficiency of many eco-physiological processes (nutrient assimilation, photosyn-thetic efficiency, respiration, buoyancy), most of which are affected by trophic changes (Litchman et al. 2010).
Phytoplankton trait-based approaches are being in-creasingly used in aquatic ecology (e.g., Reynolds et al. 2002; Salmaso, and Padisak 2007; Litchman, and Klaus-meier 2008; Kruk et al. 2010). Classifications based on morphological and functional proprieties generally group species with common features, indicating that algae be-longing to a specific group have common morphological characteristics and are powerful predictors of optimum dynamic performance (Reynolds, and Irish 1997). In fact, species-specific morphological characteristics are related to ecological strategies of different phytoplankton species. Phytoplankton morphological traits are relatively sim-ple to measure and their relation to physiology is potentially well established. Specific growth rates, resource utilization, light competition, grazer resistance all depend on organism dimensions, volume and shape. A tight link between mor-phology and autecology of species is also suggested by the fact that distribution in time and space is linked to phyto-plankton morphometry (Kruk et al. 2010).
The present study examines the temporal variation of the phytoplankton community and seston (1.2 to≤76 mm) δ13C in Lake Maggiore during 2008. Previous studies
re-port that POC and seston in this lake are mainly of au-tochthonous origin, and that the former is significantly correlated with chlorophyll a (r=0.651, p<0.001, d.f.=134; Bertoni, and Callieri 1993). This study was part of a wider project investigating aquatic food web relationships in Lake Maggiore through the use of stable isotopes analysis (SIA) of carbon and nitrogen. Part of the research ad-dressed the issue of whether seasonality affected changes in the relative positions of zooplankton taxa in the food
web, and in the role of primary and secondary consumers in the transfer of matter and energy along food web path-ways (Visconti, and Manca 2011). Because phytoplankton is a key link in lacustrine trophic webs and in specific they represent a source of food for grazing zoo-plankton, we have examined the nature and thus the composition of the phytoplankton community of the lake. Furthermore, along with taxonomic species and group classification, we have explored the potential use of phytoplankton cell size, cell shape and morpho-functional groups for investigating whether they can be related to carbon isotopic variation in the lake.
MATERIAL AND METHODS Study site and SIA methods
Lake Maggiore (45°57'30”N; 8°32'E) lying at an alti-tude of 193.30 a.s.l., is the second deepest (mean depth 177 m; maximum 370 m) and largest (area=212.5 km2;
volume 37.5 km3) subalpine lake in Italy.
Phosphorus-lim-ited, the lake was brought back to oligotrophy by the mid eighties (total phosphorus concentration at the winter mix-ing ca10 mg L-1), after eutrophication in the 1960s and
the late 1970s.
For almost 30 years, a regular monitoring of the lake has been carried out in an open-water station in the deep-est part of the lake basin (station Ghiffa, latitude 45°58'30”N; longitude 8°39'09”E, depth 370 m), with at least monthly frequency. In 2008, two additional sites were sampled near the Toce River inflow (station Baveno: latitude 45°54'28”N; longitude 8°31'44”E) and in a shal-low basin near the lake littoral (station Lesa: latitude 45°49'70”N; longitude 8°34'70”E, at the southern end of the lake (Fig. 1).
On each sampling date, 0-20 m (epilimnion) and 25-50 m (hypolimnion) integrated water samples were col-lected with a 5 L Niskin bottle, filtered through a 76 mm nylon filter. From each, a sub-sample fixed in Lugol acetic solution was taken for phytoplankton abundance and bio-volume estimates. Chlorophyll-awas also measured on each date (Lorenzen 1967). In the lab, water samples were filtered through GF/C fiber glass filters, to obtain seston material (1.2-76 mm).
The water temperature vertical profile and the Secchi depth water transparency were also measured on each date.
The samples were analyzed by continuous flow iso-tope-ratio mass spectrometry (CF-IRMS) at the G.G. Hatch Stable Isotope Laboratory (University of Ottawa, Canada). The δ13C and percentage of carbon was
deter-mined. The Elemental analyzer (Vario EL III manufac-tured by Elementar, Germany) was interfaced with a Conflo II (manufactured by Thermo, Germany), to an Iso-tope Ratio Mass Spectrometer (IRMS; Delta XP Plus
Ad-vantage, manufactured by Thermo, Germany). Samples and standards were flash combusted at about 1800°C (Dumas combustion) and the resulted gas products carried by helium through columns of oxidizing/reducing chem-icals optimized for CO2. The gases were separated by a
“purge and trap” adsorption column and sent to IRMS in-terface, then to IRMS.
Internal standards were (δ13C in ‰): C-51
Nicoti-namide (0.07, 22.95), C-52 mix of ammonium sulphate + sucrose (16.58, 11.94), C-54 caffeine (-16.61, 34.46), blind standard C-55: glutamic acid (-3.98, 28.53). Data were reported in Delta notation (δ), the units being per mil (‰) and defined as δ=[(RxRstd)/Rstd]×1000 where “R”
is the ratio of the abundance of the heavy to the light iso-tope, “x” denotes sample and “std” is an abbreviation for standard. All δ13C were reported as ‰vs V-PDB (Pee Dee
Belemnite) and normalized to internal standards cali-brated to international standards IAEA-CH-6 (-10.4‰), NBS-22 (-29.91‰), USGS-40 (-26.24‰) and USGS-41 (37.76‰). PDB and V-PDB are identical and interchange-able. Analytical precision based on the laboratory internal standard (C-55, not used for calibration) was better than 0.2‰. Standard deviation for δ13C was 0.05.
Laboratory methods for phytoplankton
The phytoplankton classification and counts were per-formed on samples fixed by acetic Lugol's solution fol-lowing the Utermöhl method (Utermöhl 1958; Lund et al. 1958; Rott 1981). The phytoplankton analysis was done under an inverted microscope; small species were enu-merated under 400× magnification while bigger and colo-nial species under a lower 200× magnification. Cell biovolumes were calculated from recorded abundance and specific biovolumes approximated to simple geometrical solids (Rott 1981). Taxa have been classified according to phytoplankton keys edited by A. Pasher- Suβwasser-flora von Mitteleuropa and by G. Huber-Pestalozzi-Das Phytoplankton des Süβwassers.
In this study the functional classification of phyto-plankton species was carried out according to Kruk et al. (2010); the so-called “morphologically based functional classification” abbreviated to MBFC or morphologically based functional group (MBFG), listed in Fig. 4. Phyto-plankton was classified in five size classes (minimum vis-ible-100 mm3, 100-500 mm3, 500-2000 mm3, 2000-5000
mm3and >5000 mm3) according to species biovolume.
Phytoplankton cell shape classification was carried out according to Hillebrand et al. (1999), listed in Fig. 4. Statistical methods
Non-parametric multiplicative regression (NPMR) was used to model δ13C using taxonomic groups, cell size,
cell shape and morpho-functional groups. NPMR was
ap-plied using the software HyperNiche version 1.46 (Mc-Cune, and Mefford 2004). Non-metric multidimensional scaling (NMS) ordination was used to investigate differ-ences among phytoplankton samples. NMS was applied using the software PC-ORD (McCune, and Mefford 2006).
RESULTS
Differences in seston δ13C among the three monitored
stations (Ghiffa, Baveno, Lesa) were not statistically sig-nificant (nonparametric Kruskal-Wallis test, n=35; P=0.075). Density and biovolume of phytoplankton in the three monitored stations were similar (Fig. 2), with den-sity ranging between 550 and 9000 cells mL-1, excluding
the maximum value at Ghiffa in July with 21,900 cells mL-1. Biovolume ranged between 77 (in autumn) and
1480 (in spring) mm3m-3.
Differences of seston δ13C in the two layers (depth of Fig. 1. Sampling stations from which phytoplankton samples were collected in Lake Maggiore in 2008 (G=Ghiffa, B=Baveno, L=Lesa).
0-20 m and depth of 25-50 m), in all three stations pooled together, were borderline significant (Wilcoxon test; P=0.059; n=24). The difference of phytoplankton total biovolume in the two layers (Fig. 2), in all three stations pooled together, was significant (P=0.0022; n=24). Phy-toplankton biovolume differences were confirmed by chlorophyll a data, with results statistically different in the two depth layers (Wilcoxon test; P=0.008; n=18).
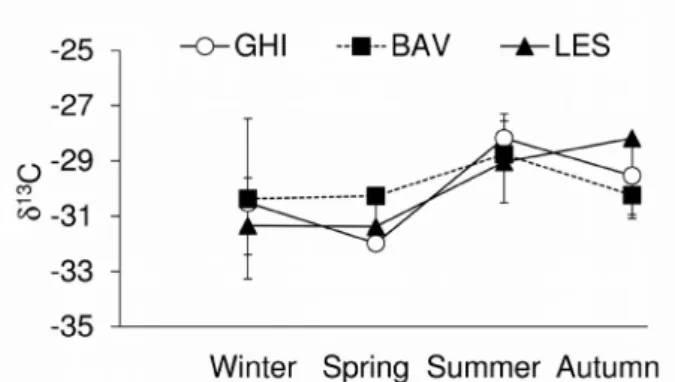
The seston δ13C followed a seasonal trend (Fig. 3) with
depleted values in winter and springtime and enriched val-ues during the summer. Seasonal changes in δ13C (pooled
data from the epilimnion and hypolimnion) were statisti-cally significant (n=23; F=5.67; P=0.006), with higher (less negative) δ13C signatures in summer (-28.13; P=0.01) than in spring (-31.21; P=0.012) and winter (-30.74; P=0.038) (Scheffè post-hoctest).
The phytoplankton assemblage’s structure changed seasonally (Fig. 2). In general, the phytoplankton com-munity of the lake was dominated by Bacillariophyceae during late winter and spring, especially with large pen-nate species like Asterionella formosa, Fragilaria croto-nensis and Tabellaria flocculosa, along with smaller
species like Cyclotellasp. During the summer months there was coexistence of Bacillariophyceae and Cyanobacteria, the latter group mainly represented by colonial species like Aphanotheche clathrata, Snowella lacustris and filamentous species like Planktothrix agardii/rubescensand Geitlerinemasp.
During the summer also the Crysophyceae were an important group with species like Uroglena sp. and Chrisochromulina parva. In the autumn the assemblage was dominated once again by Bacillariophyceae, mostly with Asterionella formosaand Cyclotellaspecies. A com-plete taxonomic list and a detailed description are given in Manca et al. (2009).
In terms of density and biovolume there was, above all in the summer, a decrease of Bacillariophyceae and an increase of Cyanobacteria (Fig. 2). This was particularly evident in the epilimnion (0-20 m), and at the Ghiffa sta-tion where a small bloom of the cyanobacteria species Aphanotheche clathrataoccurred in July.
The phytoplankton community was analyzed accord-ing to different parameters (as described in the Methods), namely cell shapes, cell sizes (biovolume classes) and
Fig. 3. Seasonal trend of phytoplankton δ13C in the three stations (GHI: Ghiffa, BAV: Baveno, LES: Lesa). Data from the two layers
morpho-functional or MBFG groups (Fig. 4).
According to cell shapes, the community was quite di-versified in springtime; during the summer there was a relative increase in density and biovolume of phytoplank-ton species with prolate spheroid shape particularly in the epilimnion (0-20 m) and quite evident at the Ghiffa sta-tion, together with a general decrease of cylinder and box shaped cells in all the three stations.
According to sizes, the community was quite diversi-fied in terms of biovolume with the 500-2000 mm3
gener-ally as the main size class (Fig. 4). In contrast, the dominant class in term of density in both epilimnion and hypolimnion (0-20 m and 25-50 m) was the smallest 0.1-100 mm3, during the whole period and in all the three
sta-tions. In the summer there was a marked increase of such size class (0.1-100 mm3) of small organisms, particularly
in the epilimnion (data not shown).
According to morpho-functional groups the phyto-plankton community, in terms of biovolume, in both lay-ers was generally dominated by Group 6 (non-flagellated organisms with siliceous exoskeletons). In the summer the relative importance of this group to some extent decreased
(Fig. 4). In contrast, in terms of density, the most impor-tant MBFG groups were Group 6, Group 3 (large filamen-tous algae with aerotopes) and Group 1 (small organisms with high surface/volume ratio). However, in the summer Group 7 (large mucilaginous colonies) was the most nu-merous morpho-functional group in both layers (0-20 m
Fig. 3. Seasonal trend of phytoplankton δ13C in the three stations
(GHI: Ghiffa, BAV: Baveno, LES: Lesa). Data from the two lay-ers were pooled.
Fig. 4. Seasonal trends of the phytoplankton for Shapes, Sizes and MBFG groups for the three sites (Ghiffa, Baveno and Lesa). Each bar in the matrix represents percentage biovolume in the sample and was calculated separately for Shapes, Sizes and MBFG.
and 25-50 m) in all the three stations, but particularly at Ghiffa; a correspondent decrease in the relative impor-tance of Group 6 occurred. NPMR was utilized to search all possible phytoplankton descriptors to determine the best predictors of δ13C variation. Through an iterative process NPMR searches all possible multiplicative com-binations of variables to produce a model using the best predictors. Four statistically significant models were found (P≤0.05) through NPMR (Tab. 1). For the different taxonomic groups, Bacillariophyceae (BACILL) had the most important relation with δ13C. For MBFG groups,
Group 6 (non-flagellated organisms with siliceous ex-oskeletons) and Group 3 (large filamentous algae with aerotopes) seemed to be the most related to δ13C.
Analyzing the data through multiple linear regression models between phytoplankton parameters (taxa groups, MBFG, shapes, sizes) and δ13C also revealed significant
(p <0.02) relationships (Tab. 2). There were similarities to the NPMR results with Bacillariophyceae and MBFG
6 being significant predictors of δ13C. NMS analysis
car-ried out using taxonomic composition revealed that sam-ples were mainly separated according to depth (axis 1), with most of the epilimnetic samples (0-20 m) found on the left of the ordination and the hypolimnetic samples (25-50 m) on the right (Fig. 5). Shape, size and morpho-functional classification classes were then superimposed as secondary variables in joint plots, together with δ13C
values, in order to observe patterns as indicated by the di-rection and length of overlain lines (Figs 5A, 5B and 5C). In the NMS ordination of phytoplankton with cell shapes, the δ13C gradient stretched from the center of the
plot towards the bottom (Fig. 5A). Cylinder shapes (a cat-egory which mainly included the diatom Cyclotellasp.) were positioned at the top of the plot, directly opposite to δ13C, probably indicating the light-est (more negative) δ13C signal among the cell shapes classes. Cyclotellasp. density and biovolume in all the three lake stations de-creased considerably during the summer, a pattern that
Tab. 1. NPMR results for prediction of phytoplankton δ13C. Data were expressed as eight types.
Data type Density or Eval xR2 P Average size Variable 1 Tolerance Variable 2 Tolerance Variable 3 Tolerance
biovolume neighbourhood
MBFG density 0.164 0.02 11.9 MBFG3 534
MBFG biovolume 0.131 0.03 12.8 MBFG6 359718
Taxa Groups density 0.129 0.02 13.5 BACILL 453
Taxa Groups biovolume 0.131 0.04 12.8 BACILL 359718
Shapes density 0.207 0.18 12.2 2 half e 1.3 box + 2 162 cylinder 658
Shapes biovolume 0.135 0.21 13.1 box 219332 box + 2 66874
Size density 0.005 0.29 14.8 500-2000 322
Size biovolume 0.007 0.41 13.4 0.1-100 175688 500-2000 360906
Fig. 5. NMS ordination of phytoplankton (square root transformed quantitative data). Parameters that had a correlation with an axis ≥0.1 were overlain for cell shapes (A), MBFG (B), Sizes (C), and δ13C. Stress=8.80936. Samples are coded by station initial (G: Ghiffa,
B: Baveno and L: Lesa) and month initial (A: April, M: May, J: July, N: November). Depth is indicated by closed circles (epilimnion) and open circles (hypolimnion).
further supports the hypothesis of their light δ13C
fraction-ation. Also prolate shape cells were positioned in the upper part of the plot, although with a less extreme posi-tion than cylinder shapes. Cell shapes indicated with box (a shape category which included the diatom Tabellaria sp.) were located in the right part of the plot, where deep samples were usually found, and slightly opposite to in-creasing δ13C.
When cell sizes were overlain (Fig. 5C) the class of 500-2000 mm3appeared in the upper part of the
ordina-tion, likely representing the lightest δ13C signal size class.
The class with the smallest cells, or size class 0.1-100 mm3, was positioned in the upper part of the plot
indicat-ing a relatively light δ13C signal, and toward the left of the
plot which was dominated by epilimnion samples. In the ordination with the MBFG groups, Group 6 (mainly Bacillariophyceae) was positioned in the upper part of the plot, likely representing the lightest δ13C signal
of the function-morphological groups (Fig. 5B). Also Group 1 (small organisms with high S/V ratio) was lo-cated in the upper part of the ordination and toward the left, or towards epilimnion samples. Group 7 (large mu-cilaginous colonies) appeared in the left part of the plot, being more related with axes 1 and thus found mainly in epilimnion samples; its vector appeared the closest to δ13C, potentially indicating a MBFG group with enriched
δ13C.
DISCUSSION
The use of δ13C POM in ecological and environmental
studies in lakes is based on an assumption that POM is a surrogate of phytoplankton. However, this assumption is not always valid because POM samples also include non-living matter derived from in situproduction, external in-puts and from flagellates and ciliates. To date a major problem in studies of plankton isotopes has been the sep-aration of phytoplankton from other microbes and detritus (Jones et al. 1998), an operation that might be very diffi-cult or impossible to finally obtain pure phytoplankton materials without contamination from other coexistent particulates (Gu et al. 2011). As indicated by Gu et al. (2011), several reasons warrant/justify the continued use of stable isotopes of POM in research on biogeochemical processes in lakes. First, biological activities likely dictate the responses of POM to environmental changes although POM is not exclusively composed of phytoplankton. Sec-ond, microbial organisms and grazers that obtain nutrients or energy from phytoplankton may share similar isotope compositions with their sources because isotopic fraction-ation between consumers and their prey is typically small and predictable (Post 2002). Detritus derived from phy-toplankton may also resemble, if it is not identical, to its source.
Furthermore, for Lake Maggiore, a highly significant
correlation between chlorophyll-aand sestonic carbon concentration was found over the long term (Bertoni, and Callieri 1993), suggesting that POM in the lake is mainly of autoctonous origin and likely made up of algal cells and that δ13C signatures of seston in this lake are mainly
related to phytoplankton. As in other deep lakes such as Lake Geneva, phytoplankton largely contributes to seston in Lake Maggiore epilimnion (Morabito et al. 2009).
In this study, overall differences among the three sta-tions in sestonic δ13C signature were statistically
non-sig-nificant, suggesting that the impact of allochthonous material from the River Toce, which was expected in one of the stations (station Baveno; de Bernardi et al. 1988) may only exceptionally become important (i.e., after heavy rainfall events). Phytoplankton density and biomass values were also similar in the three monitored stations. The among-stations close similarity of carbon isotopic signatures may reflect a substantial homogeneity in phy-toplankton abundance and community composition. Al-though a recent study (Morabito et al. 2009) found a gradient in the horizontal distribution of summer phyto-plankton in the lake from north to south, such variability was not evident in our study likely due to differences in the position and number of the stations monitored.
A vertical gradient of phytoplankton density and bio-mass, in the three stations, was observed with generally higher values in the epilimnion than in the hypolimnion, particularly manifest in the summer during thermal strat-ification. This gradient was confirmed by the difference in chlorophyll a concentrations in the two layers.
In this study the pelagic seston δ13C followed a
sea-sonal trend (Fig. 3) with depleted values in winter and springtime, less negative values during the summer and again more depleted values in the autumn. These δ13C
variations corresponded to the water temperature seasonal trend in the Lake Maggiore during 2008 (Manca et al. 2009; Visconti, and Manca 2011). Similar δ13C seasonal
trends have been observed in other deep lakes, such as Lake Geneva (Perga, and Gerdeaux 2006). Also in smaller lakes such as Lake Wauberg (Gu et al. 2006), enriched phytoplankton δ13C values typically occurred in warm months and were generally accompanied by high water temperature, high pH and low DIC concentration.
The variation in the pelagic δ13C seston baseline most
probably reflects changes in phytoplankton carbon iso-topic signature (Zohary et al. 1994), consequent to Tab. 2. Multiple linear regression results for relationship be-tween δ13C and phytoplankton parameters (biovolume).
Data type Variables R2 P
MBFG MBFG 6, MBFG 4 43.6 <0.02
Taxa groups BACILL 24.8 0.01
changes in availability of carbon sources depending on the season, and the degree of fractionation during the up-take of dissolved inorganic carbon (DIC) for the photo-synthetic activity. Plankton collected during periods of high biomass and primary productivity tends to exhibit δ13C enrichment (Degens et al. 1968; Fry, and Wainright 1991; Zohary et al. 1994; France et al. 1997) and heaviest (i.e., less negative) δ13C signatures, due to reduced
iso-topic fractionation at high cell densities or growth rates, or a switch to utilizing HCO3-as CO2concentration is
de-pleted at high cell densities or growth rates (France et al. 1997; Leggett et al. 1999, 2000). Lighter (i.e., more neg-ative) δ13C signatures are again typically observed in the
autumn with the gradual thermal destratification and in-creasing contribution of dissolved carbon from the hy-polimnion, leading to a seasonal minimum during winter mixing (Zohary et al. 1994).
In this study, the phytoplankton community underwent some structural and taxonomic changes during the year. Diatoms represented the main group in the winter and springtime (when δ13C was more negative), and they
de-creased both in density and biovolume in the summer (when δ13C was less negative). This observed trend is
typ-ical of Lake Maggiore in recent years and has been con-firmed for 2008 by a specific monitoring of phytoplankton for the whole year (Morabito et al. 2009). Diverse studies on phytoplankton carbon fractionation (e.g., Hollander, and McKenzie 1991; Zohary et al. 1994; Jones et al. 1998) found that diatoms have lighter isotopic compositions than other algal groups. For instance, values of 32‰ of δ13C for Melosira granulatain winter in Lake Kinnereth
and values of 31.2‰ for large diatoms in Loch Ness were observed.
While δ13C depletion in diatoms, compared to small
phytoplankton, in lakes has been reported [e.g., Lake Kin-nereth by Zohary et al. (1994), Lake Greifen by Hollan-der, and McKenzie (1991) and Loch Ness by Jones et al. (1998)], several studies reported that marine diatoms have more positive δ13C signatures than that of small
phyto-plankton (Gearing et al. 1984; Fry, and Wainright 1991, Gu, and Schelske 1996). One possible explanation for the δ13C depletion in lacustrine diatoms is the lipid stored within the cells which is a 13C-poor bio-chemical
com-pound (Parker 1964; Gu, and Schelske 1996).
In this study, Cyanobacteria, both in density and bio-volume, increased in the lake in the summer (when δ13C
was less negative), particularly in the epilimnion. Cyanobacteria are expected to have a high δ13C due to
their use of HCO3-and their efficient utilization of CO2
generated in the carboxysome (Goericke et al. 1994). Dur-ing the summer months, with thermal stratification con-ditions, pH typically increases in the epilimnion due to the high rate of CO2uptake for increasing primary
pro-duction and algal blooms. In these conditions the carbon
balance might switch from CO2to HCO3-dominance, and
groups like Cyanobacteria, capable of using HCO3-, may
have competition advantages and dominate the phyto-plankton community. Because δ13C of HCO
3-is on
aver-age 8‰ higher than that of CO2(Mook et al. 1974),
phytoplankton are enriched with δ13C when using HCO 3
-as their carbon source (Gu et al. 2006).
Detailed analysis of the phytoplankton community in this study revealed that the increase of Cyanobacteria in the summer at the surface of Ghiffa Station (the pelagic station, maximum depth) was mainly due to the colonial Aphanotheche clathrata. Our findings are in agreement with the ecophysiology of this species and with other studies of deep subalpine lakes (Salmaso 2000; Morabito 2002), where this species may occur at significant abun-dance in the summer. According to Kruk et al. (2010) Aphanotheche clathratabelongs to the morpho-functional Group 7 (components with low surface/volume ratio), which was also the predominant group in our study during the summer. Such relatively low ratio of phytoplankton surface/volume might be related to the general enrichment of δ13C observed in the lake during the summer, being in
agreement with the finding of Popp et al. (1998) on cell shape and surface/volume ratio. This was particularly ev-ident in the Ghiffa Station, where colonies of A. clathrata formed a little bloom and where we found the more en-riched values of δ13C ( 27‰) of the three lake stations.
In our statistical analysis by NPMR, we have investi-gated which, among all phytoplankton parameters, could be the best predictors of phytoplankton δ13C variations
(Tab. 1). Among the taxonomic groups, Bacillariophyceae was the most important in relation with δ13C trend. For
the MBFG groups, Group 3 (large filamentous algae with aerotopes) and Group 6 (non-flagellated organisms with siliceous exoskeletons) seemed to be the most related to δ13C trend. As described earlier, Bacillariophyceae
(in-cluded in MBFG 6) was the dominant taxonomic group in late winter and spring and its importance decreased dur-ing the summer, when Cyanobacteria (included in MBFG 3) were increasing. These two taxonomical groups usually represent the dominant groups in the phytoplankton com-munity of Lake Maggiore (Morabito et al. 2009).
Some multiple linear regression models run with phy-toplankton data and δ13C variation were significant. In
particular, the taxonomic group of Bacillariophyceae was related to δ13C variation, so were cylinder shaped cells
and MBFG 6, both categories including mainly Bacillar-iophyceae. The pattern of δ13C seasonal variations showed
that at less negative values of δ13C found during the
sum-mer, the phytoplankton predictors found above have de-creased, thus indicating to potentially represent phytoplankton groups with light δ13C.
More interconnections among the parameters were re-vealed by the NMS analysis, which primarily showed that
the depth factor was a strong determinant in the ordina-tions. The δ13C gradient seemed to be mainly related to
size class 500-2000 mm3(the most important in the lake
in terms of biovolume and including most of the diatom species), cylindrical shaped cells (including all Cyclotella species and in agreement with the multiple linear regres-sion model), and with the morpho-functional groups MBFG 6 (indicating a light δ13C) and MBFG 7 (indicating
enriched δ13C).
CONCLUSIONS
Statistical investigation of the phytoplankton param-eters that might be predictors of δ13C variation in this
study seems to be mainly related to the Bacillariophyceae taxonomic group and to MBFG 6 (non-flagellated organ-isms with siliceous exoskeletons). More interconnection among the parameters considered emerged from the NMS analysis.
Phytoplankton shape doesn’t seem to be per sea good indicator of δ13C variation. For instance, prolate cells, which were postulated to be a good predictor from direct observations, included diverse taxonomic groups which, from the literature have also different δ13C fractionation.
It included, in fact, Cyanobacteria which are supposed to have enriched δ13C fractionation, and mainly all the Chrysophyta taxa which are supposed, instead, to have depleted δ13C fractionation. The sum of the two groups
probably reduced the differences visible thereby reducing significance in the statistical tests we have applied. The same comment is valid for the group of cylinder colonies, which included both filamentous Cyanobacteria (enriched δ13C fractionation) and filamentous Bacillariophyceae
(depleted δ13C fractionation). However, a better indicator
shape group might be the cylinder shaped cells (including mainly Cyclotellasp.) since they resulted to have a sig-nificant relationship with δ13C in the multiple linear
re-gression and in the NMS analysis.
Phytoplankton size classes were not found to be sta-tistically significant with δ13C variation, both through the
NPMR model and the multiple linear regression model. However, NMS analysis revealed that size class 500-2000 mm3was the best related to δ13C variations. Although the
classification of a phytoplankton assemblage in terms of size spectra could represent a valid instrument in describ-ing the response to environmental gradients (Kamenir, and Morabito 2009) and in developing phytoplankton trophic indices (Phillips et al. 2011), its use in lake iso-topic studies needs further insight and studies to be con-sidered. In particular, future and already existent laboratory studies should be coupled with more investi-gations of carbon isotopes in natural environments.
In this study, the best predictor of δ13C variations seemed to be the phytoplankton taxonomic groups and the morpho-functional groups (MBFG). In particular,
Bacyl-lariophyceae and MBFG 6 were significantly related to δ13C variations in both NPMR model and in the multiple linear regression model and also the NMS analysis re-vealed their potential importance as predictor of δ13C
vari-ations. The importance of morphological and functional traits in shaping phytoplankton assemblages is well rec-ognized and increasingly used in ecology (see the review by Litchman et al. 2010). Already thirty years ago Mar-galef (1978) and Reynolds (1984) suggested that mor-phology and functions of phytoplankton cells are determinant for the role of the organisms in the environ-ment and that a trait-based approach can explain species distribution and auto-ecology. A simple and mechanistic classification of phytoplankton results to be strongly con-nected with the functioning of the community.
Our study suggests that morpho-functional grouping of phytoplankton could be a good predictor for δ13C
vari-ations in lakes, contributing to a better understanding of the factors influencing δ13C signature and variation in aquatic ecosystems. This might represent a supporting and parallel result also in the utilization of phytoplankton functional traits classification in current research for de-veloping models and indices of water ecological quality (Phillips et al. 2011).
Our study confirms that the variation in the pelagic δ13C seston most probably reflects changes in phytoplank-ton carbon isotopic signature, consequent to changes in availability of carbon sources depending on the season and due to different isotopic fractionation of phytoplank-ton taxonomic and morpho-functional groups. Overall, this study shows the value of detailed information on phy-toplankton composition and morpho-functional traits when interpreting isotopic signatures and pathways of or-ganic matter in lake food webs.
ACKNOWLEDGMENTS
This study was funded to M. Manca by the Commis-sione Internazionale per la Protezione delle Acque Italo-Svizzere (CIPAIS), Project on: “Studies on zooplankton and the pelagic food web by means of carbon and nitrogen Stable Isotope Analysis” and by the “Emilia Stella schol-arship” to Anna Visconti. We wish to thank two anony-mous reviewers for critical comments and a peer revision of the manuscript.
REFERENCES
Bertoni R, and Callieri C. 1993. Organic carbon trend during the oligotrophication of Lago Maggiore. Mem. Ist. ital. Idro-biol., 52: 191-205.
Burkhardt S, Riebesell U, and Zondervan I. 1999. Effects of growth rate, CO2concentration, and cell size on the stable
carbon isotope fractionation in marine phytoplankton. Geochim. Cosmochim. Acta, 63: 3729-3741.
evo-lution of Cladocera in Lago Maggiore (N. Italy) as influ-enced by environmental parameters. Verh. Internat. Verein. Limnol., 23: 530-534.
Degens ET, Guillard R, Sackett WM, and Hellebust JA. 1968. Metabolic fractionation of carbon isotopes in marine plank-ton. Temperature and respiration experiments. Deep Sea Res., 15: 1-9.
Falkowski PG. 1991. Species variability in the fractionation of 13C and 12C by marine phytoplankton. J. Plankton Res., 13: 21-28.
France RL, Del Giorgio PA, and Westcott KA. 1997. Productiv-ity and heterotrophy infuences on zooplankton 13C in north-ern temperate lakes. Aquat. Microb. Ecol., 12: 85-93. Fry B, and Wainright SC. 1991. Diatom sources of 13C-rich
car-bon in marine food webs. Mar. Ecol. Prog. Ser., 76: 149-157.
Gearing JN, Gearing PJ, Rudnick DT, Requejo AG, and Hutchins MJ. 1984. Isotopic variability of organic carbon in a phytoplankton-based, temperate estuary. Geochim. Cos-mochim. Acta, 48: 1089-1098.
Goericke R, Montoya JP, and Fry B. 1994. Physiology of iso-topic fractionation in algae and cyanobacteria. In: K. Lajhta, and R.H. Michener (Eds), Stable isotopes in ecology and en-vironmental science. Blackwell Scientific Publications, Cambridge, MA: 187-221.
Grey J, Jones RI, and Sleep D. 2001. Seasonal changes in the importance of the source of organic matter to the diet of zoo-plankton in Loch Ness, as indicated by stable isotope analy-sis. Limnol. Oceanogr., 46: 505-513.
Gu B, Chapman AD, and Schelske CL. 2006. Factors controlling seasonal variations in stable isotope composition of partic-ulate organic matter in a soft water eutrophic lake. Limnol. Oceanogr., 51: 2837-2848.
Gu B, and Schelske CL. 1996. Temporal and spatial variations in phytoplankton carbon isotopes in a polymictic subtropical lake. J. Plankton Res., 18: 2081-2092.
Gu B, Schelske CL, and Waters MN. 2011. Patterns and controls of seasonal variability of carbon stable isotopes of particu-late organic matter in lakes. Oecologia, 165: 1083-1098. Hillebrand H, Dürselen CD, Kirschtel D, Pollingher U, and
Zo-hary T. 1999. Biovolume calculation for pelagic and benthic microalgae. J. Phycol., 35: 403-424.
Hollander DJ, and McKenzie JA. 1991. CO2control and
car-bon-isotope fractionation during aqueous photosynthesis: a paleo-pCO2barometer. Geology, 138: 929-932.
Jones RI, Grey J, Quarmby C, and Sleep D. 1998. An assessment using stable isotopes of the importance of allochthonous or-ganic carbon sources to the pelagic food web in Loch Ness. Proc Royal Soc Lond B, 265: 105-111.
Kamenir Y, and Morabito G. 2009. Lago Maggiore oligotroph-ication as seen from the long-term evolution of its phyto-plankton taxonomic size structure. J. Limnol., 68: 146-161. Kruk C, Huszar VLM, Peeters E, Bonilla S, Costa L, Lurling M, Reynolds CS, and Scheffer M. 2010. A morphological clas-sification capturing functional variation in phytoplankton. Freshwat. Biol., 55: 614-627.
Leggett MF, Johannsson O, Hesslein R, Dixon DG, Taylor WD, and Servos MR 2000. Influence of inorganic nitrogen cy-cling on the δ15N of Lake Ontario biota. Can. J. Fish. Aquat. Sci., 57: 1489-1496
Leggett MF, Servos MR, Hesslein R, Johannsson O, Millard ES, and Dixon DG. 1999. Biogeochemical influences on the car-bon isotope signatures of Lake Ontario biota. Can. J. Fish. Aquat. Sci., 56: 2211-2218.
Lehman JT, Abella S, Litt AH, and Edmondson WT. 2004. Fin-gerprints of biocomplexity: Taxon-specific growth of phy-toplankton in relation to environmental factors. Limnol. Oceanogr., 49: 1446-1456.
Litchman E, de Tezanos Pinto P, Klausmeier CA, Mridul KT, and Yoshiyama K. 2010. Linking traits to species diversity and community structure in phytoplankton. Hydrobiologia, 653: 15-28.
Litchman E, and Klausmeier CA. 2008. Trait-based community ecology of phytoplankton. Ann. Rev. Ecol. Evol. Syst., 39: 615-639.
Litchman E, Klausmeier CA, Schofield OM, and Falkowski PG. 2007. The role of functional traits and tradeoffs in structur-ing phytoplankton communities: scalstructur-ing from cellular to ecosystem level. Ecol. Lett., 10: 1170-1181.
Lorenzen CJ. 1967. Determination of chlorophyll and pheopig-ments: spectrophotometric equations. Limnol. Oceanogr., 12: 343-346.
Lund JW, Kipling C, and Le Cren ED. 1958. The inverted mi-croscope method of estimating algal numbers and the statis-tical basis of estimation by counting. Hydrobiologia, 11: 143-170.
Manca M, Visconti A, Fadda A, Caroni R, Cerutti I, and Volta P. 2009. Indagini sullo zooplancton e sulla rete trofica pelag-ica attraverso analisi d’isotopi stabili di carbonio e azoto. In: C.N.R.-I.S.E. (Ed.), Ricerche sull'evoluzione del Lago Mag-giore. Aspetti limnologici. Programma quinquennale 2008-2012. Campagna 2008. Commissione Internazionale per la protezione delle acque italo-svizzere: 35-52.
Margalef R. 1978. Life forms of phytoplankton as survival al-ternatives in an unstable environment. Oceanol. Acta, 1: 493-509.
McCune B, and Mefford MJ. 2004. HyperNiche. Nonparametric Multiplicative Habitat Modeling MjM Software, Oregon. McCune B, and Mefford MJ. 2006. PC-ORD. Multivariate
Analysis of Ecological Data. MjM Software, Oregon. Michener RH, and Schell DM. 1994. Stable isotope ratios as
tracers in marine aquatic food webs. In: K. Lajtha and R.H. Michener (Eds), Stable Isotopes in Ecology and Environ-mental Science. Blackwell Scientific, London: 138-157. Mook WG, Bommerson JC, and Stavermen WH. 1974. Carbon
isotopes fractionation between dissolved bicarbonate and gaseous carbon dioxide. Earth Planet. Sci. Lett., 22: 169-176.
Morabito G, Ruggiu D, and Panzani P. 2002. Recent dynamics (1995-1999) of the phytoplankton assemblages in Lago Maggiore as a basic tool for defining association patterns in the Italian deep lakes. J. Limnol., 61(1): 129-145.
Morabito G, Sili C, Panzani P, and Oggioni A. 2009. Dinamica stagionale e distribuzione orizzontale di fitoplancton, car-bonio organico e batterio plancton. Struttura dei popola-menti fitoplanctonici. In: C.N.R.-I.S.E. (Ed.), Ricerche sull’evoluzione del Lago Maggiore. Aspetti limnologici. Programma quinquennale 2008-2012. Commissione Inter-nazionale per la protezione delle acque italo-svizzere: 53-66.
Parker PL. 1964. The biogeochemistry of the stable isotopes of carbon in a marine bay. Geochim. Cosmochim. Acta, 28: 1155-1164.
Perga ME, and Gerdeaux D. 2006. Seasonal variability in the δ13C and δ15N values of the zooplankton taxa in two alpine
lakes. Acta Oecol., 30: 69-77.
Peterson BJ, and Fry B. 1987. Stable isotopes in ecosystem stud-ies. Ann. Rev. Ecol. Syst., 18: 293-320.
Phillips G, Morabito G, Carvalho L, Solheim AL, Skjelbred B, Moe J, Andersen T, Mischke U, de Hoyos C, and Borics G. 2011. Deliverable D3.1-1: Report on lake phytoplankton composition metrics, including a common metric approach for use in intercalibration by all GIGs. www.wiser.eu Popp BN, Laws EA, Bidigare RR, Dore JE, Hanson KL, and
Wakeham SG. 1998. Effect of phytoplankton cell geometry on carbon isotopic fractionation. Geochim. Cosmochim. Acta, 62: 66-77.
Post DM. 2002. Using stable isotopes to estimate trophic posi-tion: models, methods, and assumptions. Ecology, 83: 703-718.
Rau GH, Riebesell U, and Wolf-Cladrow D. 1996. A model of photosynthetic fractionation by marine phytoplankton based on diffusive molecular CO2uptake. Mar. Ecol. Prog. Ser.,
133: 275-285.
Rau GH, Takahashi T, and des Marais DJ. 1989. Latitudinal vari-ations in plankton 13C: implicvari-ations for CO2and
productiv-ity in past oceans. Nature, 341: 516-518.
Rau GH, Takahashi T, des Marais DJ, Repeta DJ, and Martin JH. 1992. The relationship between 13C of organic matter and [CO2(aq)] in ocean surface water: data from a JGOFS
site in the northeast Atlantic Ocean and a model. Geochim. Cosmochim. Acta, 56: 1413-1419.
Reynolds CS. 1984. The ecology of freshwater phytoplankton. Cambridge University Press, Cambridge.
Reynolds CS, Huszar V, Kruk C, Naselli-Flores L, and Melo S.
2002. Towards a functional classification of the freshwater phytoplankton. J. Plankton Res., 24: 417-428.
Reynolds CS, and Irish AE. 1997. Modelling phytoplankton dy-namics in lakes and reservoirs: the problem of in situgrowth rates. Hydrobiologia, 349: 5-17.
Rott E. 1981. Some results from phytoplankton counting inter-calibrations. Schweizerische Zeitschrift für Hydrologie, 43: 34-63.
Salmaso N. 2000. Factors affecting the seasonality and distribu-tion of cyanobacteria and chlorophytes: a case study from the large lakes south of the Alps, with special reference to Lake Garda. Hydrobiologia, 337: 49-68.
Salmaso N, and Padisak J. 2007. Morpho-functional groups and phytoplankton development in two deep lakes (Lake Garda, Italy and Lake Stechlin, Germany). Hydrobiologia, 578: 97-112.
Takahashi K, Yoshioka T, Wada E, and Sakamoto M. 1990. Tem-poral variations in carbon isotope ratio of phytoplankton in a eutrophic lake. J. Plankton Res., 12: 799-808.
Utermöhl H. 1958. Zur vervollkommnung der quantitativen phy-toplanktonmetodik. Verh. Internat. Verein. Theor. Angew. Limnol., 9: 1-38.
Vander Zanden MJ, and Rasmussen JB. 1999. Primary consumer 13C and 15N and the trophic position of aquatic consumers. Ecology, 80: 1395-1404.
Visconti A, and Manca M. 2011. Seasonal changes in the δ13C
and δ15N signatures of the Lago Maggiore pelagic food web. J. Limnol., 70: 263-271.
Vuorio K, Meili M, and Sarvala J. 2006. Taxon-specific varia-tion in the stable isotopic signatures (13C and 15N) of lake phytoplankton. Freshwat. Biol., 51: 807-822.
Zohary T, Erez J, Gophen M, Berman-Frank I, and Stiller M. 1994. Seasonality of stable carbon isotopes within the pelagic food web of Lake Kinneret. Limnol. Oceanogr., 39: 1030-1104.