On Intelligent Transportation Systems and
Road Congestion
Completed Research Paper
Zhi (Aaron) Cheng
Department of MIS, Fox School of
Business, Temple University,
1801 N Broad St, Philadelphia, PA
19122, USA
acheng@temple.edu
Min-Seok Pang
Department of MIS, Fox School of
Business, Temple University,
1801 N Broad St, Philadelphia, PA
19122, USA
minspang@temple.edu
Paul A. Pavlou
Department of MIS, Fox School of Business, Temple University,
1801 N Broad St, Philadelphia, PA 19122, USA
pavlou@temple.edu
Abstract
Despite substantial investments in transportation infrastructures, road congestion in urban areas has not abated. While there is a growing interest among policymakers in intelligent transportation systems (ITS), the role of ITS in road congestion has not been established. To investigate the effect of ITS on road congestion, we utilized a unique dataset on traffic and ITS adoption from 99 U.S. urban areas in 2001-2008. The results from fixed-effects estimations show that ITS adoption reduces road congestion, saving an average driver 98 minutes of driving time and $38 per year. We also obtained preliminary evidence that ITS reduces carbon emissions by alleviating road congestion. Our findings extend the emerging IS literature on IT value in the public sector and the societal impacts of IT. Our study also contributes to the transportation economics literature and informs transportation policymakers by showing that ITS could be a cost-effective alternative to tackle road congestion.
Keywords: Intelligent Transportation Systems, Road Congestion, Transportation Economics, Public sector IT Value, Societal Impact of IT, Green IT
Introduction
In 2014, an average American spent over 40 hours stuck in traffic, causing $954 economic loss due to traffic jams, according to 2015 Annual Urban Mobility Scorecard. This figure is more pronounced in large metropolitan areas (e.g., New York City, Los Angeles, and Chicago) with 60-hour annual delays and $1,376 congestion costs per commuter. Not only does it cause economic loss to commuters, but also the road congestion burns extra fossil fuels and generates heavy greenhouse gas (GHG) emissions (Government Technology 2011a). There has been a major increase in investments over the last several decades to the construction and expansion of highways and roads. However, despite their touted promise, these investments in increasing the road supply were not shown to be effective in reducing road congestion (e.g., Arnott and Small 1994; Cervero 2002; Duranton and Turner 2011).
As an alternative to expensive infrastructure investments, policymakers in the transportation sector have begun considering IT to reduce road congestion, specifically intelligent transportation systems (ITS). ITS is defined by the U.S. Department of Transportation (DOT) as “an integrated system of advanced communications technologies embedded in the transportation infrastructure and in vehicles to improve transportation safety and mobility”.1 Since the early 2000s, a number of state and local governments in
the U.S. have made substantial investments in ITS with financial grants from the DOT. These governments rely on ITS to leverage traffic data collected from sensors and video cameras installed in roads and bridges, so that they can effectively manage day-to-day traffic operations and devise long-term traffic-mitigation policies and future construction plans. For instance, the State of Washington uses the real-time data from its ITS installed across the Seattle metropolitan area to operate managed-lane highways, to dynamically change speed limits, and to inform drivers on traffic conditions via overhead traffic signs.2
The U.S. federal and state governments spent $111 billion in transportation in 2013, which amounts to $351 per capita.3 This spending includes annual investments of $100 million in the ITS research
(Government Technology 2010). Given the magnitude of transportation expenditures, it is imperative to rigorously examine the effectiveness of such investments in ITS. Hence, this study asks the following research question: “Do Intelligent Transportation Systems help relieve road congestion?”
We draw upon long-held debates on congestion in the transportation economics literature (e.g., Downs 1962, 1992; Cervero and Hansen 2002; Duranton and Turner 2011). One central tenant in this literature is “induced traffic” (Goodwin 1996; Cervero 2002), which challenges a taken-for-granted assumption that congestion is mitigated if road supply increases. Specifically, it contends that a decrease in driving costs thanks to an increased supply of roads will induce more traffic and will not necessarily reduce congestion. This literature, therefore, proposes that road congestion be tackled by dealing with traffic supplies and demands simultaneously (Cervero 2002), a solution that can be enabled by ITS. By integrating the transportation economics and the information systems (IS) literatures, we offer two theoretical mechanisms on the role of ITS in reducing road congestion.
We consolidated a panel dataset with 99 metropolitan statistical areas (MSA, such as Dallas, Seattle) across the U.S. spanning eight years. We mainly focus on 511 traveler information systems that were adopted by U.S. states. The reason to choose this research context is twofold. First, the 511 systems are federally-funded ITS projects that gradually expanded to most U.S. states and areas over the period since 2001. The infrastructure, the functionalities, and the services provided by the 511 systems are relatively standardized. Hence, the systems should have similar effects on road congestion across different locations. Second, gradually adopted 511 systems across locations for more than a decade provide us with a source of variance to compare the difference in congestion, not only between MSAs that adopted ITS (or did not) in a specific year, but also before and after ITS was adopted in a specific MSA. Besides, some potential confounding factors (e.g., demographic and socio-economic status) can be controlled using the census data, and some MSA-specific factors (e.g., geographical location and climate) and year-specific factors (e.g., nationwide common macroeconomic trend) are arguably fixed or quasi-fixed. This research context, therefore, helps us develop an identification strategy that uncovers a causal relationship between ITS and road congestion.
Using fixed effects regressions and additional econometrics analyses, we obtained several key findings. First, we found that ITS significantly reduces road congestion. An average commuter in a metropolitan area that adopted a 511 system saved about 4% of the time, money, excessive fuel consumption, and greenhouse gas emissions incurred due to congestion. Multiplying this figure by the total number of commuters, the overall annual cost savings from the 511 systems in all 99 urban areas in our sample is estimated to be as much as $2.9 billion, a non-trivial figure in terms of economic magnitude. This finding is consistent in a series of robustness checks, such as falsification tests and Heckman (1979) specifications, which address endogeneity concerns. We also found that the impacts of ITS persist for several years, implying its long-term effects on reducing road congestion. In addition, to consider more advanced ITS, we extended our empirical investigation to the effect of Google Maps popularity on road
1http://safety.fhwa.dot.gov/its/
2http://www.wsdot.wa.gov/Operations/Traffic/ActiveTrafficManagement/ 3http://www.usgovernmentspending.com/state_spending_2013USmn
congestions. By using Google Trends data on search popularity of “Google maps”, we compiled a dataset that has variables for the sample cities and time spanning as same as our 511 datasets. The additional findings show the use of Google Maps, like the 511 systems, also significantly reduces road congestion. Finally, we examined the relationship between ITS and individual driving behaviors to better understand the underlying mechanism that explains the role of ITS in road congestion. Using a fine-grained dataset of 28,344 U.S. census tracts, we provide suggestive evidence on a significant decrease in the number and the miles of individual daily travels after the adoption of the 511 systems.
This study makes a set of important contributions to the IS and the transportation economics literatures as follows. By focusing on a long-lasting public concern on road congestion, this study contributes to the emerging literature on societal impacts of IS by examining how ITS affects road congestion. Our empirical evidence shows that the adoption of IT-enabled transportation management systems benefits the society by saving time and money incurred by road congestion. We also contribute to the burgeoning “Green IT” literature (e.g., Melville 2010; Malhotra et al., 2013) by providing preliminary but encouraging evidence that ITS reduces excessive CO2 emissions due to road congestion. Second, our study contributes to the transportation economics literature by showing that an IT-enabled intervention on congestion is likely to reduce traffic. Third, by integrating the IS with the transportation literature, we propose a new interdisciplinary research that sheds light on the increasing role of IT in transportation, an approach that, to our knowledge, few prior studies have attempted.
Finally, this research provides meaningful practical implications for policymakers. Providing transportation infrastructures is considered one of the primary responsibilities of government and a crucial factor for economic development. This is why transportation spending is one of the largest public-sector expenditures. We seek to influence policy debates on transportation by empirically demonstrating that an IT-enabled traffic intervention can be a more cost-effective alternative to expensive infrastructure investments. We also suggest that policymakers leverage ITS to develop a capability in traffic management and demand-and-supply coordination.
Literature Review
To investigate the mechanisms in which ITS affects road congestion, we invoke several bodies of literature – a) the transportation economics literature on traffic interventions and “induced traffic”, b) the transportation systems literature on ITS design and evaluation, and c) the IS literature on societal impact of IT, public-sector IT value, and Green IT. In particular, the transportation economics literature provides a conceptual foundation on traffic supply-and-demand. The transportation system literature provides the backgrounds of development and evaluation of various intelligent transportation systems. The IS literature helps us establish the rationale on what are the societal impacts of ITS, why and how ITS may create value in the public sector, and what role ITS plays on environmental sustainability.
Traffic Interventions and Induced Traffic
The effectiveness of conventional traffic interventions has been predominately discussed in the transportation science (e.g., Mogridge 1997; Brackstone and McDonald 1999) and the transportation economics literatures (e.g., Vickrey 1969; Arnott and Small 1994; Duranton and Turner 2012). Transportation science has primarily focused on road network design (e.g., Yang and Bell 1998) and traffic optimization problems (e.g., Laporte 1992), while transportation economics is interested in road pricing (Arnott and Small 1994) and transportation policy evaluation (Duranton and Turner, 2011). Our research objective is to assess the effects of IT-enabled traffic interventions; hence, we mainly review the relevant transportation economics literature to understand the theoretical mechanisms that drive the impacts of ITS.
The transportation economics literature primarily utilizes a supply-demand lens to analyze and evaluate the effectiveness of certain traffic interventions on traffic congestion. An intuitive approach (Downs 1962; Duranton and Turner 2011; Hsu and Zhang 2014) in the supply side is to build more roads. However, the literature shows that this approach is not effective in reducing congestion. It is due to what it calls “induced traffic” (Goodwin 1996; Duranton and Turner 2011, 2012), which can be explained as an outcome of a decrease in driving costs. Studies argue that the “building more roads” approach only considers the supply side and lacks the ability to coordinate supplies and demands in tandem (e.g.,
Cervero 2002). Unlike the supply-side, the demand-side interventions are concerned with how to mobilize persons or goods (Bull 2004). An example is road pricing or congestion tax. Vickrey (1963, 1969) argued that the core problem of congestion is negative externality (e.g. Arnott and Small 1994) that occurs when drivers do not bear all costs of the consequence (e.g., traffic jams) from driving. Congestion pricing is one of the solutions to incentivize drivers to adjust their driving behavior by imposing a cost on driving and by internalizing the externalities from road congestion.
We seek to contribute to the transportation economics literature by theorizing and evaluating the effect of an IT-enabled traffic intervention on road congestion. Since ITS provides a means to connect, integrate, and coordinate existing traffic supply-and-demand interventions (e.g., road expansion and pricing), it is an ideal setting to study how the focal IT-enabled traffic management affects road congestion.
Traffic Intervention Design and Evaluation
A small portion of the transportation science literature has focused on designing and developing IT-enabled traffic interventions (Chen and Cheng 2010). These studies mostly adopted design science methodologies to develop the functionalities of ITS, such as dynamic routing, congestion management, and intelligent traffic control (Smith and Demetsky 1994; Chabini 1998; Drane and Rizos 1998; Quddus et al. 2007). In addition, some of the studies used simulation modeling to evaluate the performance of their algorithms, systems or schemes in reducing congestion (e.g. Wen 2008). While their objective is primarily to design systems that improve the effectiveness of specific transportation intervention, we are more interested in assessing the effectiveness of widely-adopted ITS projects (511 systems) with historical traffic data and spatiotemporal econometrics models.
Societal Impact of IT and Green IT
To investigate the mechanisms on how ITS influences road congestion, we invoke several IS research streams. First, to understand what roles ITS play in addressing congestion, we draw upon the literature on the societal impacts of IT. In recently years, this emerging stream of IS literature discuss various topics, such as online dating (Bapna et al. 2012), spread of HIV (Chan and Ghose 2014), and alcohol related motor vehicle homicides (Greenwood and Wattal 2016). The key mechanism in these studies is that an increase in information transparency and a decrease in search and transaction costs are attributed to IT-enabled digital platforms (e.g., Craigslist, Uber). In our setting, ITS makes traffic information more transparent and available. Hence, it lowers the costs for drivers to search traffic conditions and helps them make more informed travel decisions. At the same time, it also lowers the costs for local governments to search for the same information that is needed to control traffic. Therefore, our study extends the literature on the societal impacts of IT to road congestion issues.
Second, we are interested in how ITS creates value to the public by reducing congestion. To understand this, we draw on the IT value and strategic IS literature (e.g., Pavlou and El Sawy 2006; Rai et al. 2006; Rai et al. 2012). One of the main theoretical perspectives, the process view of the effects of IT, stresses that IT resources are associated with enhanced performance by developing relevant IT related capabilities. Pang et al. (2014) extended this perspective to theorize how IT value is created in the public sector. They contended that IT resources facilitate the development of public-sector organization capabilities, thus pushing the public-value frontiers to increase societal value. Our study argues that ITS helps local governments develop a traffic management capability to reduce road congestion. Thus, our study extends the IS literature on public-sector IT value to examine the impact of ITS on road congestion. Last, this work is also related to an emerging research stream of Green IT (Melville 2010; Malhotra et al. 2013), which calls for more research on the role of IT in environmental sustainability (Melville, 2010). A few design science studies proposed how to design IT artifacts for sustainability reporting (e.g., Hilpert et al. 2014). Some empirical work investigates the effectiveness of various IT systems on energy saving (e.g., Schmidt et al. 2014) and pollution reducing (Rush et. 2015). In our study, we extend the Green IT literature to the transportation setting. Our basic premised is that if ITS reduces congestion significantly, it would also lead to a significant reduction of greenhouse gas emission by vehicles in traffic (e.g., Barth and Boriboonsomsin 2008; Chen and Whalley 2012; and Proost et al. 2012).
Hypothesis Development
Integrating the literatures on IS and transportation economics discussed in the preceding section, we hypothesize how ITS affects road congestion.
First, ITS helps balance traffic supplies and demands. As described above, “induced traffic” incurs when road supplies cannot be adjusted dynamically in response to changes in traffic demands. Passively expanding road capacities mitigates congestion only temporally because the expanded capacities incentivize drivers to drive more due to a reduction in driving costs (Duranton and Turner 2011). Unlike road expansion, ITS makes real-time traffic information available to both drivers and local governments. Consistent with key perspectives in societal impacts of IT, ITS increases the transparency and availability of information on traffic conditions and facilitates coordinating traffic supplies and demands. With real-time information, drivers can choose alternative routes to avoid congestion. In addition, local governments can proactively respond to road congestion by adjusting supplies or diverting demands. For instance, a local transportation agency can change the number of lanes for inbound or outbound traffic once it foresees potential congestion by analyzing real-time traffic data from ITS. In sum, with ITS, both drivers and local governments can better allocate their resources to avoid road congestion.
Second, ITS enables local governments to develop a traffic management capability. Traditional traffic interventions (e.g., road expansion and pricing) are often individually utilized by local governments to control traffic. To better allocate resources for investments in congestion relief, ITS provides a systematic solution for congestion by coordinating traditional traffic interventions and maximizing the joint effects of those interventions. For example, in 2009, the City of New York (NYC) collected GPS data from 13,000 taxicabs to find out the most congested roads (and why). Based on these data, the NYC closed off the Time Square and Herald Square sections of Broadway to traffic in an effort to eliminate the confusion from the diagonal trajectory of Broadway Avenue. After this intervention, the speed of taxi trips in both directions has improved by 15% (Government Technology 2011a). Without information about congested roads, the NYC could not have developed the plan to close up these troubling segments. This example illustrates how ITS reduces road congestion by enhancing the traffic management capability.
In sum, ITS mitigates road congestion by helping balance traffic supplies and demands and develop a traffic management capability. We therefore propose the following hypothesis:
H1. The adoption of ITS by urban areas is negatively associated with road congestion in these areas.
Methodology
Settings
The ITS we mainly focus on is 511 traveler information systems. Since 2001, this ITS projects have been deployed by U.S. states with the support from the federal government. By 2014, 46 states and urban areas implemented 511 systems with $135 million. The 511 systems aimed to help drivers and local governments make informed travel decisions of time, transportation modes, and routes. The functionality of the 511 systems consists of dynamic traveler information services, collection of a massive amount of data through cameras and sensors, and access to a wide range of real-time traffic information via phone, Web, and smartphone apps.
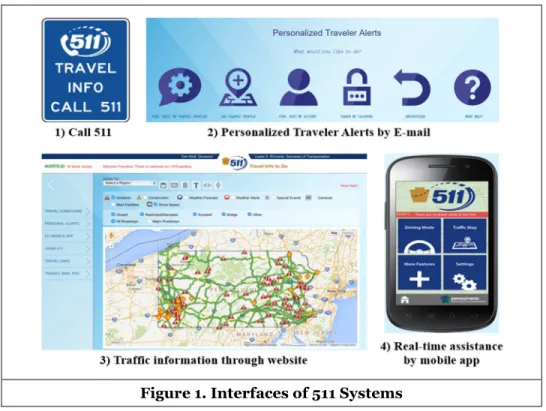
Figure 1 shows four types of interfaces whereby drivers can access to traffic information from a 511 system. The most traditional way is to call 511 for traffic conditions and transit information. Travelers can sign up for personal travel alerts and receive email notifications for roadways through which they usually commute. Drivers can check incident and construction information from the 511 websites. Recently, the 511 systems began to provide real-time traffic advisories through mobile apps. Travelers can listen to travel alerts without touching their phones if they switch on the “Driving Mode”.
The reasons we chose the 511 systems are twofold. First, they are the most common and standard ITS systems that have been implemented in most states. Their functionalities and services are fairly standardized across states, and accordingly, we can assume them as identical treatments for road congestion once adopted. Second, since the time at which the 511 systems launched varies across states
and urban areas, we leveraged this temporal and spatial heterogeneity as a source to explain the variance in road congestions across the urban areas.
Figure 1. Interfaces of 511 Systems
It is noteworthy that more advanced ITS (e.g., Google Maps, iOS Maps, and Waze) keep emerging in the ITS market, especially after mobile devices have become commonplace in the last few years. For example,
Google Maps is currently the most widely used web and mobile application that offers multiple views (e.g., satellite imagery, panoramic views) of streets, real-time-traffic conditions, and route planning functions. Apple has collaborated with automobile companies (e.g., Honda, Ford and Volvo) to cast the
iOS Maps into vehicle-mounted display screens served as a Car Play function. Waze is a social app that enables motorists to share traffic and road information, making real-time travel routing more convenient and reliable. Whereas we do not have the exact usage data for such mobile applications, it is important to note that these individual-level apps primarily help drivers, but they do not help local governments reduce road congestion with traffic data. Nonetheless, in a supplementary empirical analysis, we capture the effects of mobile app popularity using the search query “Google Maps” in the corresponding MSA in our sample using Google Trends data.
Data and Measures
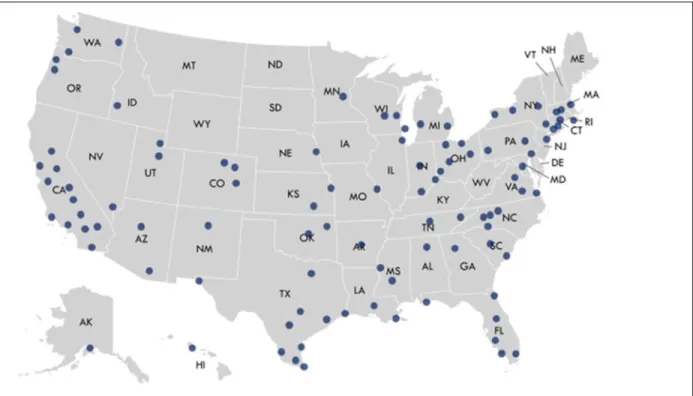
We built a panel dataset for 99 U.S. metropolitan areas (Figure 2) from multiple data sources. The descriptions for the variables (Table 1), summary statistics (Table 2) and correlation matrix (Table A1 in the Appendix) are available below. We collected road congestion data from Annual Urban Mobility Scorecard (AUMS) maintained by the Texas A&M Transportation Institute. AUMS is a comprehensive dataset that integrates highway performance data from the Federal Highway Administration (FHA) and traffic speed data collected by INRIX on 1.3 million miles of urban streets and highways. Moreover, AUMS provides a series of rich measures for road congestion, such as annual congestion costs, annual hours of delay per commuter, car fuel consumption, and excess CO2 emission due to congestion, which are aggregated to the MSA level. We also incorporated vehicle miles traveled (VMT) data from Highway Performance Monitoring System (HPMS) as a traffic volume measure (Duranton and Turner 2011, 2012). AUMS and HPMS data help us evaluate the effects of ITS on different aspects of road congestion.
Figure 2. Metropolitan Statistical Areas (MSAs) in the Sample
For the ITS measure, we identified when a U.S. state launched a 511 system with data from the FHA. We first conducted a binary adoption-timing indicator for a MSA for a given year. The FHA provides 511 implementation data at the state level. Therefore, we assigned them to each MSA in our congestion sample. Some metropolitan areas stretch across several states (e.g., Philadelphia-Camden-Wilmington, PA-NJ-DE-MD, MSA) where drivers benefit from the ITS services from each of these states. Thus, we calculated the road miles-percentages of MSA in each state as weights and then obtained the weighted-average ITS measure for such interstate metro areas.4
To account for potential confounding factors that may affect ITS adoption and road congestion, we incorporated a set of control variables, including population, economic conditions, total road miles, area density, public transit, commercial traffic, unemployment rates, and employment distribution across related sectors (Table 1), as suggested by extant transportation studies (e.g., Duranton and Turner 2011; Hsu and Zhang 2014). These covariates were collected from multiple sources. Population and GDP data were retrieved from the Bureau of Economic Analysis (BEA). We used HPMS to measure the amount of road in each MSA. To measure public transit and commercial traffic, we used County Business Patterns (CBP) data from the U.S. Census Bureau. We used the unemployment rates from the Bureau of Labor Statistics (BLS) and employment distribution from CBP.
In addition, to further investigate the mechanisms that drive the impacts of ITS on road congestion, we conducted an additional analysis with a survey dataset on individual and household driving behaviors. We retrieved such travel information from the National Personal Travel Survey (NPTS) in 2001-2011. This survey provides data on the number and length of trips made by individuals and households at the census-tract level, providing much finer-grained data.
4 For example, in the Philadelphia-Camden-Wilmington metro area, the percentage of total roadway miles in each
state, Pennsylvania, New Jersey, Maryland and Delaware, were 63.39%, 26.63%, 0.6% and 9.34% in 2008, respectively. Until 2008, only New Jersey adopted 511 systems (August 2007), therefore the ITS measure for Philadelphia-Camden-Wilmington MSA is 0.2663 in 2008 and zero before 2007 because none of the four states adopted 511 systems from 2001 to 2006.
Table 1. Variables and Data Sources
Variable Description Sources
Dependent Variables
CONGESTION
COST Log (annual congestion cost per commuter)
AUMS TIME Log (annual hours of delay per commuter)
FUEL Log (annual gallons of gasoline per commuter) CO2 Log (annual excess CO2 pounds per commuter)
TRAFFIC VMT Log (total vehicle-miles traveled) HPMS
Independent Variable
ITSit ITS adopted at ith MSA (or tract) and tth year=1, otherwise 0 FHA Control Variables
POP Log (population)
BEA GDP Log (GDP per capita in real dollars)
ROAD Log (total miles)
HPMS DENSITY Log (population/land area)
COMMUTER Commuters-population ratio AUMS
UNEMP Unemployment rate BLS
PUCLIC TRANSIT % of employment for public transit in transportation sector
CBP TRUCK % of employment for truck driving in transportation sector
MANU % of employment for manufacturing industries TRANSP % of employment for transportation-intensive sector INFO % of employment for information-intensive sector EDUC % of employment for education sector
SCI&RES % of employment for science and research
COMMITTEE Whether the state of a MSA area is a committee member of the ITS development consortium (=1 if yes, otherwise 0)
FHA EARLYADOP Whether the state of a MSA area is identified as an early adopter of
ITS by the US DOT (=1 if yes, otherwise 0)
Table 2. Summary Statistics
Variable Mean Std. Dev. Min Max
[1] ITS 0.205 0.394 0 1 [2] POP 13.732 0.968 11.462 16.743 [3] GDP 10.835 0.575 7.325 12.025 [4] ROAD 8.186 0.898 5.814 10.685 [5] DENSITY 7.566 0.499 4.796 8.751 [6] COMMUTER 0.484 0.039 0.260 0.538 [7] UNEMP 0.053 0.015 0.024 0.117 [8] PUBLIC TRANSIT 0.113 0.106 0.005 1.000 [9] TRUCK 0.361 0.147 0.096 1.000 [10] MANU 0.105 0.053 0.009 0.631 [11] TRANSP 0.037 0.022 0.007 0.220 [12] INFO 0.029 0.013 0.002 0.084 [13] EDUC 0.026 0.019 0.002 0.142 [14] SCI&RES 0.069 0.032 0.009 0.246 [15] COMMITTEE 0.109 0.312 0 1 [16] EARLYADOP 0.109 0.312 0 1 [17] COST 6.829 0.385 4.913 7.635 [18] TIME 3.602 0.386 1.609 4.454 [19] FUEL 2.718 0.425 0.693 3.497 [20] CO2 5.744 0.548 3.526 6.645 [21] TRAFFIC 9.927 1.022 7.263 12.647
Empirical Specifications
Baseline EstimationTo model the effects of ITS on road congestion, we adopted a fixed-effects regression as our baseline specification. This identification strategy assumes that after accounting for the MSA-specific time-invariant factors and year-specific MSA-indifferent factors and conditional on observed heterogeneity, the ITS is as good as randomly assigned to some urban areas (Angrist and Pischke 2009). Through comparison of changes in road congestion in urban areas with and without ITS, we were able to uncover the causal effect of ITS using this fixed-effects model. Thus we have:
ln (CONGESTIONit) = βITSit + γXit + ui + vt + ɛit (1)
where i and t index MSA and year, respectively (t = 2001-2013). CONGESTit indexes road congestion for
MSA i in year t. We used annual congestion cost per commuter (COST) and annual hours of delay per commuter (TIME) as our primarily congestion measures. We checked the robustness of our estimation by using additional congestion measures, such as annual excess CO2 emission per commuter (CO2) and
annual gasoline consumption per commuter (FUEL). ui is a vector of 99 MSA fixed-effects; vt is a vector of
year fixed-effects that account for common macroeconomic trends in 2001-2008; and Xit is a covariate
vector of control variables (Table 1). ɛit is error term, clustered by MSA to account for heteroscedasticity
(Bertrand et al. 2004). ITSit is an indicator for whether a 511 system was adopted at MSA i in year t. The
coefficient β is the estimate of the average effect of ITS adoption on road congestion. If β < 0, then ITS would have a mitigating effect on road congestion.
Falsification Checks
The assumption of our fixed-effects model may be violated if the relationship between ITS adoption and road congestion may be driven by unobserved confounding effects. A potential confounding effect could be from an increase in fuel prices. The U.S. had experienced a surge in regular gasoline price from 1.03$ (in 1998) to 3.25$ (in 2008) per gallon. In the meantime, the median household income remained stagnant during this period. Therefore, it may be high driving costs relative to income that had reduced traffic demand and congestion. The perceived increase in fuel prices could be treated as a pre-adoption factor that overlaps with the period of ITS adoption at various urban areas. But one assumption of the fixed-effects model is that there is no difference in the pre-adoption trend across observations, which is not resolved by location fixed-effects. The heterogeneity in pre-adoption factors could be a violation of the assumption of our baseline model.
To check whether such heterogeneous pre-adoption exists and to assess whether ITS has a spurious effect, we conducted a falsification test through the use of placebo dummy variables in our regression following Chan and Ghose (2014). We included two years of pre-adoption dummies as placebos along with four years of post-adoption dummies to capture potential inter-temporal entry effects as follows.
ln (CONGESTIONit) = ∑ + βXit + ui + vt + ɛit (2)
where j ∈ {-2, -1, 1, 2, 3, 4}, indicating whether year t is the jth year since ITS was adopted in the MSAi.
is omitted in this regression. In the presence of an overlapping trend of decreasing congestion prior
to ITS adoption, the placebo indicators ( ) would produce positive and significant
coefficients. In addition, the coefficients on the post-adoption indicators (, , , )
reflect the immediacy of ITS adoption impact on road congestion. When j>0, the dynamic temporal impacts of ITS on road congestion can be characterized by the sequence α1, α2, α3 and α4. If α1 < α2 < α3 <
α4, then ITS shows a monotonic increasing effects on reducing road congestion. ITS Adoption and Individual Driving Behaviors
To investigate whether ITS adoption influences road congestion by changing individual and household driving behaviors over time, we look at finer-grained census-tract-level information from the NPTS data. The key question is whether ITS increases traffic by decreasing perceived driving costs. Therefore, we used traffic volume, measured by vehicle miles traveled (VMT), as the dependent variable, to check whether ITS adoption leads to an increase in driving demand. So the specification is as follows.
ln (TRAFFICit) = βITSit + γXit + ui + vt + ɛit (3)
i indexes each census tract in our sample. We expect β ≤ 0, indicating that ITS does not induce traffic.
Table 3. The Effects of ITS on Road Congestion and Traffic Volume
Variables
CONGESTION
TRAFFIC
COST TIME FUEL CO2
(1) (2) (3) (4) (5) ITS -0.045** (0.02) -0.042* (0.02) -0.040* (0.02) -0.039* (0.02) (0.04) 0.007 POP 1.337*** (0.19) 0.327* (0.19) 1.320*** (0.17) (0.23) 0.341 (0.21) 0.171 GDP 0.279* (0.15) 0.263* (0.15) 0.267** (0.12) 0.380* (0.21) -0.0414 (0.13) ROAD -0.020 (0.02) -0.024 (0.02) -0.017 (0.02) (0.06) 0.059 0.827*** (0.12) DENSITY -0.015* -0.014 -0.011 -0.036 0.014 (0.01) (0.01) (0.01) (0.02) (0.02) COMMUTER 2.705** 1.702 2.943** -3.801* -0.303 (1.13) (1.20) (1.18) (2.20) (1.10) UNEMPLOY -0.482 -0.585 -0.406 -1.522 -1.002 (0.86) (0.90) (0.84) (1.37) (0.79) PUBLIC TRANSIT -0.014 -0.007 -0.001 -0.302* -0.018 (0.06) (0.06) (0.06) (0.18) (0.06) TRUCK 0.022 0.027 0.020 0.049 0.035 (0.03) (0.03) (0.03) (0.06) (0.04) MANUFACT -0.130 -0.176 -0.134 0.008 -0.204 (0.16) (0.17) (0.16) (0.28) (0.15) TRANSPT (0.77) 0.857 (0.77) 0.995 0.884 (0.77) -0.406 (1.15) 0.830 (0.67) CONSTANT -7.045*** (2.658) -3.954* (2.300) -19.18*** (2.028) (3.075) 4.009 (2.393) 1.610
MSA Fixed Effects YES YES YES YES YES
Year Fixed Effects YES YES YES YES YES
# of Observations 792 792 792 792 792
# of MSAs 99 99 99 99 99
R2 0.970 0.962 0.937 0.961 0.983
Note: All regressions are under the same specification with different dependent variables. Robust standard errors (clustered by MSA) in parentheses. *** p<0.01, ** p<0.05, * p<0.1
Results
Main Results
Table 3 presents the main results. In Columns (1) and (2), the coefficient of ITS is negative and significant, representing a 4.5% decrease in annual congestion costs and a 4.2% decrease in annual delays per commuter thanks to the 511 system adoption. On average, a commuter at the metropolitan areas that implemented ITS saves 98 minutes or $38 per year. By multiplying this individual saving by the number of commuters (7,643,2000) in all our sample areas in 2008, we could obtain the total annual saving amount up to $2.9 billion, implying a sizable impact of the 511 systems on road congestion.
This finding supports Hypothesis 1 that the adoption of ITS alleviates road congestion. While an alternative explanation would predict that an ITS adoption could exacerbate road congestion in a way to make driving less expensive and thereby induce more traffic, our result shows that this may not be the case.
In Column (5) in Table 3, traffic volume, measured by VMT, is treated as a dependent variable in our baseline fixed-effects model. This result shows that the coefficient on ITS is insignificant, implying that there is little evidence that ITS induces more traffic. Consistent with the transportation economics literature (e.g., Duranton and Turner 2011; Hsu and Zhang 2014), the coefficient of road supply is positive and significant, indicating that road expansion does induce traffic. Comparing these two traffic interventions, investments in ITS seem to be more effective on congestion relief than building more roads.
Robustness Checks
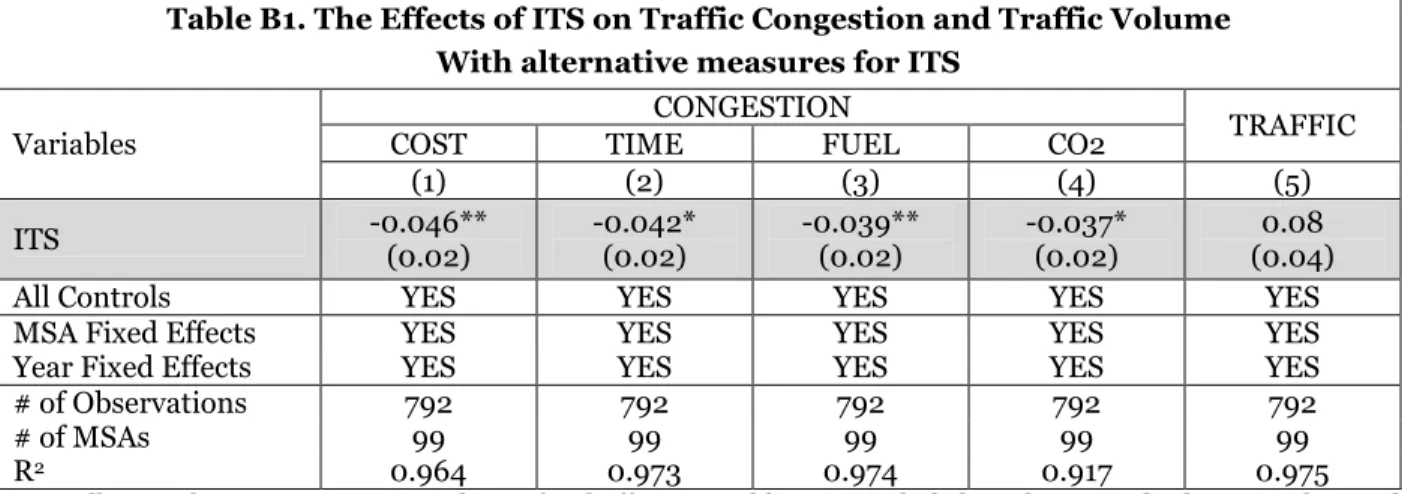
First, we assessed the robustness of these main results with alternative measures of road congestion – fuel usage and CO2 emission. The estimates in Table 3, Columns (3) and (4) are largely similar to Columns (1) and (2). Also, we used alternative measures for ITS adoption. As a 511 adoption may occur in the latter months of a year, its indicator for the year of initial adoption may not be accurate. In our alternative adoption measure, MSAs that launched 511 systems in the last quarter of the year (i.e., October, November and December) are labeled as ITS adoption in the following year. Estimations under this alternative specification remain consistent with those in Table 3 in terms of sign and significance (Table B1 in the Appendix).
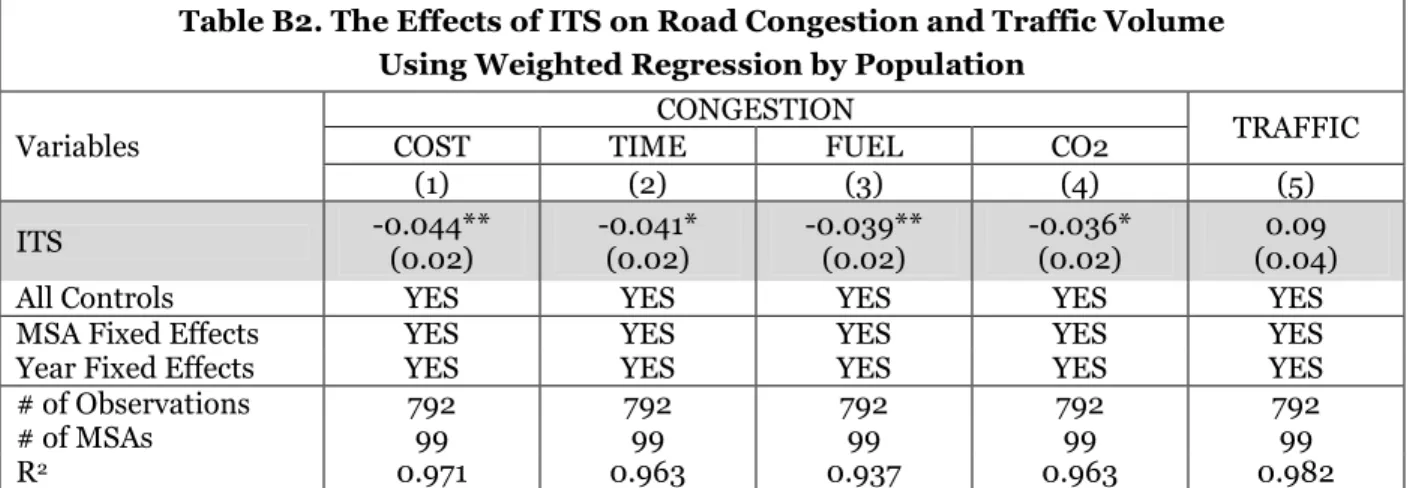
Second, we evaluated whether our result is robust to alternative estimations. We compared the results using OLS estimates with MSA fixed-effects (Table 3) to those with weighted least squares (WLS) estimates. WLS can correct OLS when estimating causal effects in the following ways (Solon et al. 2015): 1) to achieve precise estimates by correcting for heteroscedasticity (sub-population have different variabilities from others), 2) to achieve consistent estimates by correcting for endogenous sampling, and 3) to identify average partial effects in the presence of unmodeled heterogeneity. Therefore, we weighted our regression by population, as extant literature suggested (Angrist and Pischke 2009, p.92). The results (Table B2 in the Appendix) show very similar findings when using WLS estimation with those using OLS (Table 3). Thus heteroscedastic, selectivity, and unobserved heterogeneity (Solon et al. 2015) are not major problems in this study, and our findings are robust.
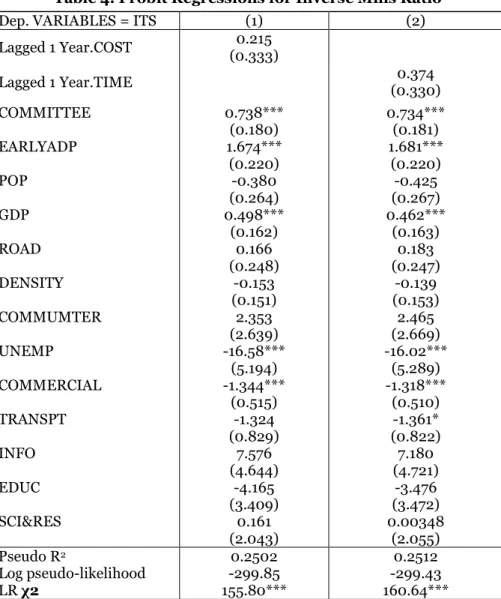
Third, to further check for selection bias, we addressed a concern that ITS adoption may be endogenously determined. Failing to account for endogeneity in the ITS adoption could bias the estimates. We used a two-step procedure originally described by Heckman (1979), as further developed by Shaver (1998). In the first step, we estimated a Probit model to assess the effects of a set of factors that are associated with ITS implementation. This set of factors includes COMMITTEE and EARLYADT. The first is a dummy variable indicating whether a state is a member of the ITS development consortium, which consisted of eight states that jointly pooled resources and expertise to develop the 511 services. The second is also a dummy variable denoting whether the 511 system was identified as the best cases for the 511 system implementation by the FHA. We also incorporated basic economic, employment, and industry indicators into the Probit model. All of these factors are expected to affect the ITS adoption (Table 4). Then, endogeneity was accounted by including an “inverse Mill’s ratio” obtained from the Probit regression as a control variable into our fixed-effects model. The coefficients on ITS are still negative and significant (Table 5).
Fourth, in regard to reverse causality, we ran a Probit regression in the first step of selection model with congestion variables in year (t-1). Reverse causality would exist if a local government’s decision to adopt ITS in year t is determined by the congestion level in a city in year (t-1). From Table 4, we found the coefficients on these lagged congestion variables are both insignificant using different measures, COST and TIME, implying that reverse causality may not be a serious concern.
Table 4. Probit Regressions for Inverse Mills Ratio
Dep. VARIABLES = ITS (1) (2)
Lagged 1 Year.COST (0.333) 0.215 Lagged 1 Year.TIME (0.330) 0.374 COMMITTEE 0.738*** 0.734*** (0.180) (0.181) EARLYADP 1.674*** 1.681*** (0.220) (0.220) POP -0.380 -0.425 (0.264) (0.267) GDP 0.498*** 0.462*** (0.162) (0.163) ROAD 0.166 0.183 (0.248) (0.247) DENSITY -0.153 -0.139 (0.151) (0.153) COMMUMTER 2.353 2.465 (2.639) (2.669) UNEMP -16.58*** -16.02*** (5.194) (5.289) COMMERCIAL -1.344*** -1.318*** (0.515) (0.510) TRANSPT -1.324 -1.361* (0.829) (0.822) INFO 7.576 7.180 (4.644) (4.721) EDUC -4.165 -3.476 (3.409) (3.472) SCI&RES 0.161 0.00348 (2.043) (2.055) Pseudo R2 0.2502 0.2512 Log pseudo-likelihood -299.85 -299.43 LR χ2 155.80*** 160.64***
Note: # of Observation is 686. Constants are omitted for brevity. Robust standard errors in parentheses. *** p<0.01, ** p<0.05, * p<0.1
Table 5. Fixed-Effects Estimation with Inverse Mill’s Ratio
Variables CONGESTION Traffic COST TIME (1) (2) (3) ITS -0.043** (0.02) -0.039** (0.02) (0.04) 0.08
Inverse Mills Ratio 0.026 -0.053 -0.036
(0.07) (0.07) (0.07)
All Controls YES YES YES
MSA Fixed Effects YES YES YES
Year Fixed Effects YES YES YES
# of Observations 792 792 792
# of MSAs 99 99 99
R2 0.968 0.964 0.975
Note: The inverse mills ratio calculated from Table 4. All controls, constants and fixed effects in Table 3 are incorporated. Robust standard errors (clustered by MSA) in parentheses. *** p<0.01, ** p<0.05, * p<0.1
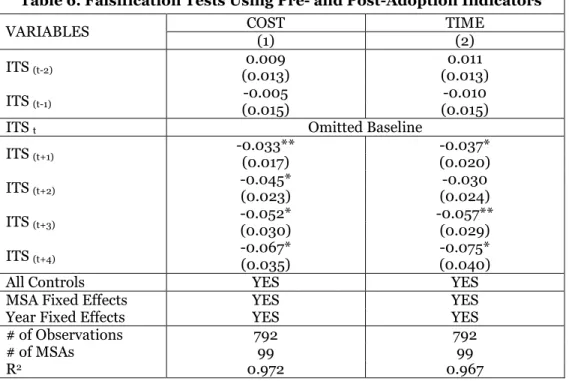
Finally, to alleviate concerns for omitted variable bias, we performed falsification tests to check whether pre-adoption heterogeneity existed the estimation of ITS adoption on road congestion. The result (Table 6) shows that the two-year pre-adoption placebo variables did not pick up any pre-adoption effect (i.e., the coefficients on ITS(t-2) and ITS(t-1) are not significant), suggesting that the negative relationship
between ITS adoption and road congestion is unlikely to be a spurious effect that propagated from periods prior to the ITS adoption. Moreover, the coefficient on ITS (t+1) is significant, as well as those of other
post-adoption dummies. This indicates the impact of ITS on road congestion shows up immediately after its adoption in an MSA. We also observed the monotonic increasing effects on road congestion over time once a 511 system becomes available in an MSA, implying that the role ITS plays in reducing congestion becomes more and more important.
Table 6. Falsification Tests Using Pre- and Post-Adoption Indicators
VARIABLES COST TIME
(1) (2)
ITS (t-2) 0.009 0.011
(0.013) (0.013)
ITS (t-1) -0.005 -0.010
(0.015) (0.015)
ITS t Omitted Baseline
ITS (t+1) -0.033** -0.037* (0.017) (0.020) ITS (t+2) -0.045* -0.030 (0.023) (0.024) ITS (t+3) -0.052* -0.057** (0.030) (0.029) ITS (t+4) -0.067* -0.075* (0.035) (0.040)
All Controls YES YES
MSA Fixed Effects YES YES
Year Fixed Effects YES YES
# of Observations 792 792
# of MSAs 99 99
R2 0.972 0.967
Note: All regressions, weighted by population, include MSA and year fixed effects, all controls, and constants. Robust standard errors (clustered by MSA) in parentheses. *** p<0.01, ** p<0.05, * p<0.1.
Table 7. The Effects of Search Query Popularity for “Google Maps” on Traffic Congestion and Traffic Volume
VARIABLES
CONGESTION
TRAFFIC
COST TIME FUEL CO2
(1) (2) (3) (4) (5)
Google Maps -0.0038** (0.0015) -0.0040*** (0.0015) -0.0038*** (0.0013) -0.0030** (0.0015) (0.0018) 0.0012
All Controls YES YES YES YES YES
MSA Fixed Effects YES YES YES YES YES
Year Fixed Effects YES YES YES YES YES
# of Observations 688 688 688 688 688
# of MSA 86 86 86 86 86
R2 0.983 0.983 0.984 0.956 0.997
Advanced ITS: Google Maps
Though the focus of the paper is on government IT infrastructure (i.e., 511 systems), the impact of recent ITS (e.g., Google Maps,Waze) initiated by private IT companies should not be downplayed (Wachs 2002). Therefore, we expanded our study to consider the impacts from Google Maps, which is known as the most popular and widely used ITS product. Unfortunately, we could not access to exact spatial-temporal data on Google Maps usage. However, we use the popularity of a search item “Google Maps” from Google Trends data in different urban areas from 2005 to 2008. The time frame was chosen because (1) Google launched Google Maps in 2005, and (2) our dataset covers corresponded spatial-temporal traffic information until 2008. From Google Trends, we could only find 86 MSAs in our 511 dataset and thus consolidated a panel data with 688 observations. Then we substituted the current independent variable with Google Maps search popularity. We found that the popularity for Google maps is associated with a decrease in congestion (Table 7), in consistent with the results with the 511 systems (Table 3).
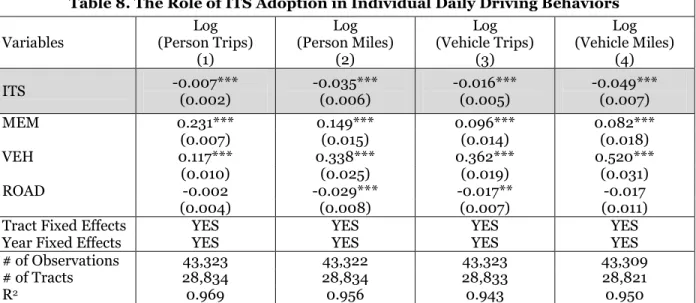
ITS and Driving Behaviors: Congestion-Reducing Mechanism
To examine what mechanism ITS reduces congestion, we analyzed the changes in individual and household driving behaviors in response to ITS adoption by urban areas. We used a more granular dataset retrieved from the National Personal Travel Survey (NPTS) to investigate how ITS changes individual and household driving behaviors. The NPTS in 2001 collected individual/household travel information in 2001 and aggregate them to the census-tract level, while the NPTS in 2009 collected the same information for 2007-2011. We mapped MSA-level ITS indicators to census tracts, in a way that the census tracts in the same MSA are assigned with the same value of ITS measure. This dataset shows that the number of family members and private-owned vehicles has increased from 2001 to 2011 by 4.65% and 6.67%, respectively. However, the average commuting distance has dropped significantly (by 29.23%) from 81.77 in 2001 to 63.27 miles in 2011. To check whether such a drop is attributed to the adoption of 511 systems, we used a fixed-effects model in Equation (3). We found that the ITS adoption significantly reduces the number of daily vehicle trips by 1.5% and the average daily vehicle miles travelled by 4.8% (Table 8). Hence, we did not find significant evidence that ITS induces traffic. Instead, we found that ITS may change individual driving behaviors. Specifically, Table 8 provides suggestive evidence that with ITS, drivers could make a better decision in choosing the timing and route, reducing unnecessary trips and distances. Drivers not only avoid congested road for themselves but also decrease a possibility to cause congestion for other drivers on the road. Therefore, the changes in driving behaviors due to ITS in the micro census-tract level affect traffic conditions in the macro MSA level, demonstrating the role of ITS in balancing traffic supplies and demands simultaneously.
Table 8. The Role of ITS Adoption in Individual Daily Driving Behaviors
Variables Log (Person Trips) Log (Person Miles) Log (Vehicle Trips) Log (Vehicle Miles) (1) (2) (3) (4) ITS -0.007*** (0.002) -0.035*** (0.006) -0.016*** (0.005) -0.049*** (0.007) MEM 0.231*** 0.149*** 0.096*** 0.082*** (0.007) (0.015) (0.014) (0.018) VEH 0.117*** 0.338*** 0.362*** 0.520*** (0.010) (0.025) (0.019) (0.031) ROAD -0.002 -0.029*** -0.017** -0.017 (0.004) (0.008) (0.007) (0.011)
Tract Fixed Effects YES YES YES YES
Year Fixed Effects YES YES YES YES
# of Observations 43,323 43,322 43,323 43,309
# of Tracts 28,834 28,834 28,833 28,821
R2 0.969 0.956 0.943 0.950
Note: MEM and VEH represent the average number of members and vehicles per household. ITS and ROAD
measures are assigned to each tract. Robust standard errors in parentheses (clustered by census tract and MSA). *** p<0.01, ** p<0.05, * p<0.1.
Discussion and Conclusion
In this study, we investigated the impact of ITS on road congestion and quantify this effect by focusing on the federally-supported 511 systems. The governments in the U.S. at all levels make massive capital expenditures in road construction, with scant evidence that such investments in roads are worthwhile. While policymakers hope that ITS provides a viable alternative to traffic relief, our understanding of whether and how it can alleviate road congestion is limited. To fill this important gap in the literature, we utilized a unique dataset of 99 urban areas in the U.S. spanning eight years to assess the effectiveness of ITS in combating road congestion. To the best of our knowledge, this study represents an initial empirical effort that quantifies the role of ITS adoption in road congestion.
Theoretical Contributions
This study makes several contributions to the IS and transportation economics literatures. We contribute to the IS literature by extending the extant studies on the IT value in the public sector (Pang et al. 2014). We found that an ITS adoption in an urban area leads to a 4% decrease in road congestion (Table 3). Moreover, we extend the IS literature on the broader societal impacts of IT (e.g., Chan and Ghose 2014; Greenwood and Wattal 2015) to the transportation sector. We also contribute to the emerging research stream on Green IT (Melville 2010; Malhotra et al., 2013) by demonstrating that ITS can save energy consumption and reduce greenhouse emissions in two ways, a) by relieving road congestion (Table 4, Column 4) and by reducing traffic volume (Table 8).
We also contribute to the transportation literature by providing empirical evidence that ITS could be more effective in lessening road congestion than road construction, owing to the ability of ITS to simultaneously coordinate traffic supplies and demands. By examining the effect of ITS on traffic volume at the census-tract level, we found that ITS can even decrease the number of daily trips and travel distance. Given the increased road stocks in our study period (2001-2008), we interpret that ITS helps drivers make more informed decisions on choosing routes and timing, so that they can avoid congested roads, save time, and reduce energy consumption, contributing to environmental sustainability.
Public Policy Implications
This study informs policymakers and transportation planners that ITS could be a more cost-effective means to address traffic problems than infrastructure constructions. Road construction and expansion is not only expensive and time-consuming but also confronted with fierce political resistance from citizens whose properties or livelihoods are affected by construction or those who oppose massive government spending that comes from raising tax revenues. More importantly, evidence from the transportation economics literature suggests that investments in road infrastructure constructions may not be worthwhile. Our study suggests that policymakers pay attention the potential of IT (Gaspar and Glaeser 1998) to tame traffic. Within government agencies, IT has been more treated as a tool to improve administrative efficiency. However, its potential to create social welfare and tackle chronic social problems (Pang et al. 2014) needs to be more recognized by policymakers to achieve its expected outcomes.
Limitations and Future Research
Our paper has a few limitations. While we tried to rule out confounding factors and alternative plausible explanations, there might be unaccounted factors that could bias our estimations. For example, though state governments implement standardized 511 systems, how they actually use these systems may be varied and affect the degree of congestion reduction. Moreover, while the results are indicative of a causal relationship between ITS and road congestion, some of the proposed mechanisms such as development of a traffic management capability have not been fully empirically tested due to data availability. Future work could advance the theoretical explanations we proposed with additional evidence.
Concluding Remarks
Notwithstanding these limitations, this work represents the first empirical attempt to assess and quantify the relationship between ITS adoption and road congestion in urban areas. To the best of our knowledge, road congestion and subsequent environment impacts are important societal problems that are seldom investigated in the IS literature.
Our study highlights the importance of IT in a broader socio-economic setting, identifying a new avenue for IS studies to focus on how IT can have major societal effects to improve the quality of life. Future research may include how ITS increases traffic mobility and safety, how ITS facilitates the development of traffic management capabilities for local governments, and how to design and develop effective and efficient transportation technologies to advance societal value. We hope our study can attract new intellectual conversations around IT and transportation in the IS discipline.
Appendix
Table A1. Correlation Matrix
[1] [2] [3] [4] [5] [6] [7] [8] [9] [10] [11] [12] [13] [14] [15] [16] [17] [18] [19] [20] [2] 0.0 [3] 0.2 0.0 [4] 0.0 0.9 0.0 [5] -0.1 0.3 0.0 0.1 [6] 0.1 -0.4 -0.1 -0.3 -0.3 [7] -0.2 -0.1 -0.3 -0.1 0.1 0.1 [8] -0.1 0.1 0.1 0.0 0.1 -0.3 -0.2 [9] -0.1 -0.4 0.0 -0.3 -0.2 0.2 0.1 -0.3 [10] -0.1 -0.3 0.1 -0.2 -0.2 0.1 0.0 0.0 0.3 [11] 0.0 -0.1 0.0 -0.1 0.1 0.1 0.1 -0.2 -0.1 -0.1 [12] 0.1 0.1 0.1 0.1 0.0 -0.1 -0.2 0.0 -0.1 0.0 -0.2 [13] 0.0 0.0 -0.1 0.0 -0.2 -0.2 0.0 0.3 -0.1 0.2 -0.2 0.1 [14] 0.1 0.2 0.2 0.2 0.1 -0.3 -0.3 0.1 -0.3 -0.1 -0.3 0.4 0.1 [15] 0.2 0.0 0.1 0.1 0.0 0.0 0.0 0.0 -0.1 0.1 0.0 0.0 0.0 0.0 [16] 0.4 0.2 0.0 0.2 0.0 -0.2 -0.2 -0.1 -0.1 0.0 0.0 0.1 0.1 0.2 0.2 [17] 0.1 0.7 0.2 0.7 0.1 -0.4 -0.2 0.2 -0.4 -0.1 -0.2 0.2 0.1 0.3 0.1 0.2 [18] 0.1 0.7 0.3 0.7 0.1 -0.3 -0.3 0.2 -0.4 -0.2 -0.2 0.2 0.0 0.4 0.1 0.2 0.9 [19] 0.1 0.6 0.2 0.6 0.1 -0.3 -0.2 0.2 -0.4 -0.1 -0.2 0.1 0.1 0.3 0.1 0.1 0.9 0.9 [20] 0.1 0.5 0.2 0.5 0.0 -0.2 -0.2 0.1 -0.3 -0.2 -0.1 0.1 0.0 0.3 0.0 0.1 0.7 0.7 0.7 [21] 0.0 1.0 0.0 1.0 0.2 -0.3 -0.2 0.0 -0.3 -0.2 -0.1 0.1 0.0 0.2 0.0 0.2 0.7 0.7 0.6 0.5
Note: the mark numbers [1]-[21] correspond to those in Table 2.
Table B1. The Effects of ITS on Traffic Congestion and Traffic Volume With alternative measures for ITS
Variables
CONGESTION
TRAFFIC
COST TIME FUEL CO2
(1) (2) (3) (4) (5) ITS -0.046** (0.02) -0.042* (0.02) -0.039** (0.02) -0.037* (0.02) 0.08 (0.04)
All Controls YES YES YES YES YES
MSA Fixed Effects YES YES YES YES YES
Year Fixed Effects YES YES YES YES YES
# of Observations 792 792 792 792 792
# of MSAs 99 99 99 99 99
R2 0.964 0.973 0.974 0.917 0.975
Note: All controls, constants, MSA and year fixed effects in Table 3 are included. Robust standard errors (clustered by MSA) in parentheses. *** p<0.01, ** p<0.05, * p<0.1
Table B2. The Effects of ITS on Road Congestion and Traffic Volume Using Weighted Regression by Population
Variables
CONGESTION
TRAFFIC
COST TIME FUEL CO2
(1) (2) (3) (4) (5) ITS -0.044** (0.02) -0.041* (0.02) -0.039** (0.02) -0.036* (0.02) 0.09 (0.04)
All Controls YES YES YES YES YES
MSA Fixed Effects YES YES YES YES YES
Year Fixed Effects YES YES YES YES YES
# of Observations 792 792 792 792 792
# of MSAs 99 99 99 99 99
R2 0.971 0.963 0.937 0.963 0.982
Note: All controls, constants, MSA and year fixed effects in Table 3 are included. Robust standard errors (clustered by MSA) in parentheses. *** p<0.01, ** p<0.05, * p<0.1
References
Angrist, J. D., and Pischke, J.-S. 2008. Mostly harmless econometrics: An empiricist’s companion, Princeton university press.
Arnott, R., and Small, K. 1994. “The economics of traffic congestion,” American scientist (82:5), pp. 446– 455.
Bapna, R., Ramaprasad, J., Shmueli, G., and Umyarov, A. 2013. “One-way mirrors and weak-signaling in online dating: A randomized field experiment,” in International Conference on Information Systems (ICIS 2013): Reshaping Society Through Information Systems Design (Vol. 3), pp. 2748–2762 Barth, M., and Boriboonsomsin, K. 2008. “Real-world carbon dioxide impacts of traffic congestion,”
Transportation Research Record: Journal of the Transportation Research Board (2058), pp. 163– 171.
Bertrand, M., Duflo, E., and Mullainathan, S. 2004. “How Much Should We Trust Differences-in-Differences Estimates?,” Quarterly journal of economics (119:1), pp. 249–275.
Braskstone, M., and McDonald, M. 2000. Car following: a historical review, transportation research part F. 2, Pergamon.
Bull, A. 2003. Traffic Congestion: The Problem and how to Deal with it, United Nations Publications Cervero, R. 2002. “Induced travel demand: Research design, empirical evidence, and normative policies,”
Journal of Planning Literature (17:1), pp. 3–20.
Cervero, R., and Hansen, M. 2002. “Induced travel demand and induced road investment: a simultaneous equation analysis,” Journal of Transport Economics and Policy (JTEP) (36:3), pp. 469–490.
Chabini, I. 1998. “Discrete dynamic shortest path problems in transportation applications: Complexity and algorithms with optimal run time,” Transportation Research Record: Journal of the
Transportation Research Board (1645), pp. 170–175.
Chan, J., and Ghose, A. 2014. “Internet’s Dirty Secret: Assessing The Impact of Online Intermediaries on HIV Transmission,” Age (15), p. 19.
Chen, B., and Cheng, H. H. 2010. “A review of the applications of agent technology in traffic and
transportation systems,” IEEE Transactions on Intelligent Transportation Systems (11:2), pp. 485– 497.
Chen, Y., and Whalley, A. 2012. “Green infrastructure: The effects of urban rail transit on air quality,”
American Economic Journal: Economic Policy (4:1), pp. 58–97.
Downs, A. 1962. “The law of peak-hour expressway congestion,” Traffic Quarterly (16:3)
Downs, A. 1992. “Stuck in traffic: Coping with peak-hour traffic congestion”. Brookings Institution Press. Washington DC (8).
Drane, C. R., and Rizos, C. 1998. Positioning systems in intelligent transportation systems, Artech House, Inc. (available at http://dl.acm.org/citation.cfm?id=550829).
Duranton, G., and Turner, M. A. 2011. “The fundamental law of road congestion: Evidence from US cities,”
Duranton, G., and Turner, M. A. 2012. “Urban growth and transportation,” The Review of Economic Studies (79:4), pp. 1407–1440.
El Sawy, O. A., Malhotra, A., Park, Y., and Pavlou, P. A. 2010. “Research Commentary-Seeking the configurations of digital ecodynamics: It takes three to tango,” Information Systems Research (21:4), pp. 835–848.
Gaspar, J., and Glaeser, E. L. 1998. “Information technology and the future of cities,” Journal of urban economics (43:1), pp. 136–156.
Goodwin, P. B. 1996. “Empirical evidence on induced traffic,” Transportation (23:1), pp. 35–54.
Government Technology. 2010. Driving into the Future. 23(6), 14-19.
Government Technology. 2011a. Taming Traffic: Communities Use Technology to Fight Congestion. 24(7), 16-22.
Government Technology. 2011b. Smart highways: Active traffic management technology curbs congestion and improves safety. 24(1), 14-20.
Greenwood, B. N., and Wattal, S. 2015. “Show me the way to go home: an empirical investigation of ride sharing and alcohol related motor vehicle homicide,” Fox School of Business Research Paper (15–054) Heckman, J. J. 1979. “Sample Selection Bias as a Specification Error,” Econometrica (47:1), pp. 153–161. Hilpert, D.-W.-I. H., Kranz, J., and Schumann, M. 2013. “Leveraging Green IS in logistics,” Business &
Information Systems Engineering (5:5), pp. 315–325.
Hilpert, H., Kranz, J., and Schumann, M. 2014. “An Information System Design Theory for Green Information Systems for Sustainability Reporting-Integrating Theory with Evidence from multiple Case Studies,” (available at http://aisel.aisnet.org/ecis2014/proceedings/track22/6/).
Hsu, W.-T., and Zhang, H. 2014. “The fundamental law of highway congestion revisited: Evidence from national expressways in Japan,” Journal of Urban Economics (81), pp. 65–76.
Laporte, G. 1992. “The vehicle routing problem: An overview of exact and approximate algorithms,”
European Journal of Operational Research (59:3), pp. 345–358.
Malhotra, A., Melville, N. P., and Watson, R. T. 2013. “Spurring impactful research on information systems for environmental sustainability,” MIS Quarterly (37:4), pp. 1265–1274.
Melville, N. P. 2010. “Information systems innovation for environmental sustainability,” MIS Quarterly
(34:1), pp. 1–21.
Mogridge, M. J. 1997. “The self-defeating nature of urban road capacity policy: A review of theories, disputes and available evidence,” Transport Policy (4:1), pp. 5–23.
Pang, M.-S., Lee, G., and DeLone, W. H. 2014. “IT resources, organizational capabilities, and value creation in public-sector organizations: a public-value management perspective,” Journal of Information Technology (29:3), pp. 187–205.
Pavlou, P. A., and El Sawy, O. A. 2006. “From IT leveraging competence to competitive advantage in turbulent environments: The case of new product development,” Information Systems Research
(17:3), pp. 198–227.
Proost, S., and Van Dender, K. 2012. “Energy and environment challenges in the transport sector,”
Economics of Transportation (1:1), pp. 77–87.
Quddus, M. A., Ochieng, W. Y., and Noland, R. B. 2007. “Current map-matching algorithms for transport applications: State-of-the art and future research directions,” Transportation research part c: Emerging technologies (15:5), pp. 312–328.
Rai, A., Patnayakuni, R., and Seth, N. 2006. “Firm performance impacts of digitally enabled supply chain integration capabilities,” MIS quarterly, pp. 225–246.
Rai, A., Pavlou, P. A., Im, G., and Du, S. 2012. “Interfirm IT capability profiles and communications for cocreating relational value: evidence from the logistics industry,” MIS quarterly (36:1), pp. 233–262. Rush, D., Melville, N., Ramirez, R., and Kobelsky, K. 2015. “Enterprise Information Systems Capability
and GHG Pollution Emissions Reductions,” (available at
http://aisel.aisnet.org/icis2015/proceedings/Sustainability/9/).
Schmidt, J., Eisel, M., and Kolbe, L. M. 2014. “Assessing the potential of different charging strategies for electric vehicle fleets in closed transport systems,” Energy Policy (74), pp. 179–189.
Shaver, J. M. 1998. “Accounting for endogeneity when assessing strategy performance: does entry mode choice affect FDI survival?,” Management Science (44:4), pp. 571–585.
Small, K. 2013. Urban transportation economics (Vol. 4), Taylor & Francis.
Smith, B. L., and Demetsky, M. J. 1994. “Short-term traffic flow prediction: neural network approach,”
Solon, G., Haider, S. J., and Wooldridge, J. M. 2015. “What are we weighting for?,” Journal of Human resources (50:2), pp. 301–316.
Vickrey, W. S. 1963. “Pricing in urban and suburban transport,” The American Economic Review (53:2), pp. 452–465.
Vickrey, W. S. 1969. “Congestion theory and transport investment,” The American Economic Review, pp. 251–260.
Wachs, M. 2002. “Fighting traffic congestion with information technology. Issues in Science and Technology,” National Academy of Sciences.