University of Massachusetts Amherst
ScholarWorks@UMass Amherst
Transportation Engineering Masters Projects Civil and Environmental Engineering
2018
A Safety and Emissions Analysis of Continuous
Flow Intersections
Joshua Wolfgram
Follow this and additional works at:https://scholarworks.umass.edu/cee_transportation
Part of theTransportation Engineering Commons
This Article is brought to you for free and open access by the Civil and Environmental Engineering at ScholarWorks@UMass Amherst. It has been accepted for inclusion in Transportation Engineering Masters Projects by an authorized administrator of ScholarWorks@UMass Amherst. For more information, please [email protected].
Wolfgram, Joshua, "A Safety and Emissions Analysis of Continuous Flow Intersections" (2018).Transportation Engineering Masters Projects. 6.
A Safety and Emissions Analysis of Continuous Flow Intersections
A Project Presented by
JOSHUA WOLFGRAM
Master of Science in Civil Engineering
Department of Civil and Environmental Engineering University of Massachusetts
Amherst, MA 01003 FEBRUARY 2018
ACKNOWLEDGMENTS
I would like to thank my advisor, Dr. Eleni Christofa, for all her guidance, advice, support, and mentoring during my graduate school experience. Thank you for your feedback and many reviews of this paper, as well as your work to connect me with other transportation professionals. I have grown immensely under her leadership and I feel prepared to tackle the challenges of professional engineering. Thank you as well to Dr. Michael A. Knodler for being a member of my committee, and for your role in shaping this work and myself.
I also want to thank the Dwight D. Eisenhower Fellowship committee for helping to fund this research and for giving me the opportunity to attend TRB. Thank you to the City of Loveland and to the Missouri DOT for providing much of the data used in this project.
Finally, a special thank you to my wife, Abigail Wolfgram, for encouraging me and supporting me throughout graduate school, even when we were many states apart. None of this would have been possible without your love and support.
ABSTRACT
A SAFETY AND EMISSIONS ANALYSIS OF CONTINUOUS FLOW INTERSECTIONS
DECEMBER 2017 JOSHUA WOLFGRAM
B.S.C.E., VALPARAISO UNIVERSITY
M.S.C.E., UNIVERSITY OF MASSACHUSETTS AMHERST Directed by: Professor Eleni Christofa
Increasing travel demand, and challenges associated with high percentages of left-turning vehicles, have encouraged the introduction of significant infrastructure
advancements. Certain alternative intersection designs, such as continuous flow intersections, median U-turns, and jughandles, eliminate the traditional protected
left-erations of these intersection types have been studied to varying degrees, their safety and
emissions-related impacts are not well-understood.
This project develops a series of microsimulation models for two continuous flow intersections (CFI) located in Missouri and Colorado, and uses the Surrogate Safety Assessment Model (SSAM) to determine the impact of those designs on the location and type of conflicts compared to conventional signalized intersections. Additionally, an emissions model, CMEM, was used in the analysis of the Colorado study site to
determine whether CFIs have the potential to reduce emissions compared to conventional signalized intersections.
As hypothesized, the number of total conflicts did decrease upon installation of a CFI for both study sites, despite lane-change conflicts experiencing an insignificant
increase at the Loveland, CO study site. While too small of a sample size to provide a definite validation of SSAM, these results show SSAM can accurately predict the types of conflicts likely to occur as well as indicate a reduction in total vehicle conflicts when a conventional signalized intersection is converted into a CFI.
Emission rates per mile at the CFI were lower than those at a conventional signalized intersection, most likely due to fewer total stops and lower delay times for users. The CMEM analysis was repeated for four other volume scenarios, varying left-turn demand. Under all scenarios, the CFI performed better than the conventional signalized intersection. This improvement increased as volume increased, showing that the environmental performance of a CFI is less sensitive to demand than a conventional signalized intersection.
This project set forth to quantify sustainability benefits to the installation of a CFI for practitioners. Ultimately, this research can aid transportation decision-makers by providing quantitative evidence that CFIs can improve the safety impacts for vehicle users and environmental impacts for the general population in both rural and urban applications.
TABLE OF CONTENTS
Page
ACKNOWLEDGEMENTS iii
ABSTRACT iv
LIST OF TABLES xiii
LIST OF FIGURES ix CHAPTER 1. INTRODUCTION 1 Problem Statement 2 Scope of Research 3 Research Goals 3 2. LITERATURE REVIEW 4
BACKGROUND ON CONTINUOUS FLOW INTERSECTIONS ... 4
OPERATIONS ANALYSIS 8
SAFETY ANALYSIS 9
EMISSIONS ANALYSIS 13
SUMMARY OF LITERATURE REVIEW 15
3. STUDY DESIGN 17 RESEARCH OBJECTIVES 17 Research Objective 1 17 Research Objective 2 18 Research Objective 3 18 Research Objective 4 19 RESEARCH TASKS 19
Task 1: Literature Review 19
Task 2: Selection of Test Sites and Data Collection . 19
Task 3: Development of Microsimulation Models 21
Task 4: SSAM Analysis 22
Task 5: Comparison of Field and Simulation Safety Data 22
Task 6: 22
Task 7: Sensitivity Analysis of Safety and Emissions.. 23
Task 8: Documentation of Findings 23
4. SAFET 24 24 24 27 30 31 Fenton, MO 31 Loveland, CO Study 33 Loveland, CO Study 35 5. EMISSIONS EVALUATION OF 39 39 42 42 46
6. EVALUATION OF CFI PERFORMANCE UNDER VARYING DEMAND 48
48 50
SSAM Comparative Analysis Fenton, MO.. 51
SSAM Comparative Analysis Loveland, CO 55
60 65 65 66 67 68 71
LIST OF TABLES
Table Page
2.1: Summary of CFI Benefits and Disbenefits 7
4.1: List of Microsimulation Models Developed 28
4.2: SSAM Conflicts Summary for Fenton, MO Intersection 32
4.3: SSAM Conflicts Summary for Loveland, CO Intersection 34
4.4: Summary of Safety Analysis for the Loveland, CO Study Site 36
41 5.2: Average Emission Rates at the Loveland, CO Study Site for All Vehicles 44
6.1: VISSIM Varying Volume Inputs for Fenton, MO 49
6.2: VISSIM Vary 50
6.3: Conflict Type Percentages for Fenton, MO 52
LIST OF FIGURES
Figure Page
2.1: Partial CFI with Displaced Lefts on a Major Street 5
3.1: CFI at Summit Road and MO-30, Fenton, MO 20
3.2: CFI at Madison Ave. and Eisenhower Blvd., Loveland, CO 21
4.1: Study Sites: a) CFI at Summit Rd and MO-30 in Fenton, MO, and b) CFI at
Eisenhower Blvd and Madison Ave in Loveland, CO 25
4.2: Lane Groups and Phasing Schemes for a) Fenton, MO Conventional Intersection, b) Fenton, MO CFI, c) Loveland, CO Conventional Intersection, and d) Loveland, CO
CFI 27
4.3: Conflict Map for the Before Condition of the Fenton, MO Study Site 32
4.4: Conflict Map for the After Condition of the Fenton, MO Study Site 33
4.5: Conflict Map for the Before Condition of the Loveland, CO Study Site 34 4.6: Conflict Map for the After Condition of the Loveland, CO Study Site .. ... 35
5.1: NOx Emission Rates Loveland, CO 45
5.2: CO2 Emission Rates Loveland, CO 45
5.3: Fuel Economy Loveland, CO 46
6.1: Total Conflicts per Hour Fenton, MO 53
6.2: Crossing Conflicts per Hour Fenton, MO 54
6.3: Rear-End Conflicts per Hour Fenton, MO 54
6.4: Lane-Change Conflicts per Hour Fenton, MO 55
6.5: Total Conflicts per Hour Loveland, CO 58
6.6: Crossing Conflicts per Hour Loveland, CO 58
6.8: Lane-Change Conflicts per Hour Loveland, CO 59
6.9: HC Emission Rates Loveland, CO 61
6.10: CO Emission Rates Loveland, CO 62
6.11: NOx Emission Rates Loveland, CO 62
6.12: CO2 Emission Rates Loveland, CO 63
CHAPTER 1: INTRODUCTION
Conventional signalized intersections have been in existence since the early driving on the right side of the road, approaching the intersection, and either turning left, right or continuing through. However, as the vehicle miles traveled (VMT) increases, so does congestion that occurs at the chokepoints of the transportation network: intersections. The left-turn movement is particularly susceptible to this, as left-turning vehicles must stop and wait at the
intersection before finding a gap in oncoming traffic, when permissive, or must be given their own signal phase. The addition of a signal phase either requires a longer cycle length, or shorter green times for through movements, increasing total delay for users. Innovative traffic engineers over the past five decades have been seeking a remedy for this problem, and one common solution is alternative intersection designs that relocate or divert the left turning movement. This can be accomplished in many ways, but the goal is always the same: increase the operational efficiency and safety of the intersection.
The most widely implemented alternative intersection design is the roundabout. popularity rapidly across the country. A form of a traffic circle, it eliminates the signal, allows vehicles to enter the intersection when a sufficient gap exists in the circulating traffic, and treats all turning movements identically. Thus, left turning vehicles have no more impact than through moving or right turning vehicles. However, a significant amount of research has already been dedicated to roundabouts, and they will not be discussed in this project.
This project will instead focus on the continuous flow intersection (CFI), which was developed in 1991 by Francisco Mier and has since been implemented in a number
of sites across the country [1]. While only approximately 25 CFIs have been implemented across the United States to date, they exist in many different locations across the country. The state of Utah has been a proponent of them, converting at least 11 conventional intersections to CFIs since 2007 [2]. CFIs also exist in Maryland, Missouri, and
Colorado, among other states, and are currently being planned or constructed in Virginia, Texas, and Florida.
PROBLEM STATEMENT
While innovative intersection designs like the CFI are often championed by designers as viable and sustainable alternatives to signalized intersections, there is a lack of quantitative data to support those claims. Past studies have indicated that CFIs
generally provide better operational performance than conventional signalized
intersections, but other sustainability impacts of alternative intersection designs have not been studied.
This is especially true as it relates to the safety and environmental impacts of CFIs. For a technology to be sustainable, it must be sustainable in three aspects: economic, social, and environmental. Thus, knowing the environmental impacts (e.g., amount of greenhouse gases produced or impacts on human health) is essential to begin determining if CFIs are sustainable. The safety impacts of the conversion of a
conventional signalized intersection to a CFI also affect sustainability. According to an NHTSA report from 2010, the economic cost of crashes in the United States for that year alone totaled approximately $240 billion [3]. When factoring in the quality of life, the total societal costs exceeded $800 billion for 2010 alone [3]. Any reductions in these costs contributes to transportation infrastructure sustainability improvements. Without
quantifying the safety and environmental improvements, however, the true magnitude of the sustainability improvements cannot be shown.
SCOPE OF RESEARCH
The objective of this research is the following two components: 1) safety assessment, and 2) emissions estimation at CFIs.
RESEARCH GOALS
The overall goal of this research is to better quantify the potential benefits of continuous flow intersections in two main aspects: safety and environmental. The following goals were determined to properly address these research needs:
Determine whether continuous flow intersections are safer than
conventional signalized intersections for the same traffic conditions using surrogate safety measures through microsimulation and validating with real-world crash data.
Determine if continuous flow intersections produce lower emission levels than conventional signalized intersections for the same traffic conditions through microsimulation.
CHAPTER 2: LITERATURE REVIEW BACKGROUND ON CONTINUOUS FLOW INTERSECTIONS
The operations of various alternative intersection designs have been lately documented at length by the Federal Highway Administration (FHWA) [2]. The
following section summarizes relevant publications and discuss the main advantages and disadvantages of installing a CFI.
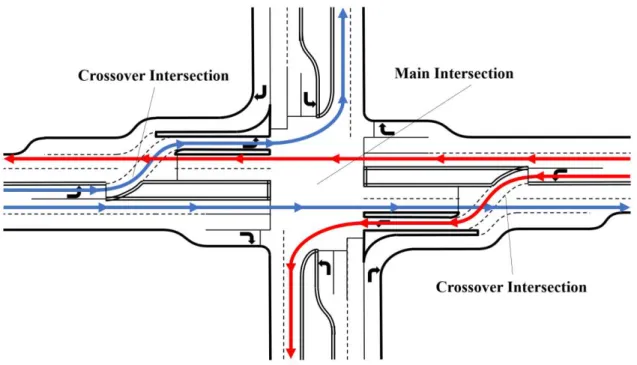
Continuous flow intersections (CFI) are also commonly referred to as displaced left turn (DLT) intersections or crossover displaced left (XDL) intersections. These intersections relocate the left-turn movement of an approach to the other side of the opposing flow at an upstream crossover intersection, as seen in Figure 2.1 on the following page. This relocation allows through movements and left-turn movements to proceed through the main intersection at the same time and eliminates the conflict between the left-turn crossing and the opposing through movement. Consequently, the number of phases at a CFI are reduced as phases for left-turn movements do not need to be protected. Green time allocated to left-turning movements at conventional signalized intersections can instead be allocated to through or pedestrian movements.
CFIs can have many different geometric configurations. When two major roads intersect, it is possible to have displaced left turn lanes for all four approaches. However, if the left-turning volume of a road is not as a high as the major road, a partial CFI can be installed. A partial CFI has displaced left-turn lanes for only the major approaches and conventional left turn lanes for the minor approaches. Few four-leg CFIs exist in the United States, so the intersections studied in this project are partial CFIs. Figure 1 depicts
a typical partial CFI. The red arrows depict eastbound traffic, and the blue arrows depict westbound traffic. Once the eastbound and westbound left-turning vehicles have crossed over during the north/southbound through phases, the east/westbound left-turn and through moving vehicles can all use the main intersection at the same time. Other
common geometric variations are the presence or absence of channelized right turn lanes or pedestrian refuge islands. Channelized right turns require additional right of way to be constructed, but eliminate conflicts between right-turn movements and the displaced left turning vehicles.
Figure 2.1: Partial CFI with Displaced Lefts on a Major Street
The signal timing for a CFI requires careful design to ensure vehicles do not have to stop more than once. Upstream crossover intersections can be controlled separately from the main intersection, or a single controller can be used for the whole intersection. The general pattern for phasing is as follows: the major crossover movement is given the green indication at the same time minor street movements are given the green indication.
Then, as crossover vehicles approach the main intersection, the major through and left movements are given the green indication [2]. To best serve these vehicles, the length of the crossover left turn bay should be long enough so that the time it takes vehicles to travel the length of the bay equals the time it takes for the signal phase to switch from the minor street to the major street. Too short of a bay will result in vehicles stopping both at the crossover intersection and the main intersection, and too long of a bay will result in a travel time too long that could lead crossover vehicles being forced to stop at both intersections as well [4].
While in theory CFIs are safer than conventional intersections since they remove the left turning conflicts, there is little empirical evidence to support this hypothesis. This is because there are currently only 25 CFIs in the United States, and all but three of these have been constructed in the last ten years. As a result, much of the prior literature on the safety of CFIs has yet to be validated with field data. One commonly cited point about the safety benefits of CFIs is the reduction of conflict points [2]. Even though the number of conflict points by itself does not necessarily indicate a level of safety, comparing the number of conflict points of two intersections can give an idea as to the safety benefits of one intersection design relative to another. When a partial CFI is installed, the number of conflict points is reduced from the 32 of a conventional signalized intersection to 30. These two eliminated conflict points are crossing conflicts, which are more dangerous than merging or diverging conflicts that are often associated with lane-change maneuvers.
Driver unfamiliarity could present some safety challenges when a new CFI is constructed. However, a study performed by Dowling College indicated that
design [2]. That figure increased to approximately 100 percent after participants used it for a week. Adequate markings and signage can help unfamiliar drivers and reduce the potential for unsafe driving behavior or movements.
The FHWA provides a table summarizing both the advantages and disadvantages of CFIs. That table is duplicated below to give a picture of the potential benefits of installing a CFI.
Table 2.1: Summary of CFI Benefits and Disbenefits (Source: [5])
Characteristics Potential Benefits Potential Disbenefits
Safety Left-turns removed from
main intersection
None identified
Operations More green for through
movements
More stops and delay for left turns Multimodal No conflicts during
pedestrian crossing
Two-stage pedestrian crossing Layout may not be immediately apparent, especially for visually impaired pedestrians
Physical Smaller footprint than
interchange alternative
Right-of-way needed
Larger footprint than conventional intersection
Access management
Socioeconomic Air quality Construction cost
Access management Enforcement,
Education, and Maintenance
None identified Public information campaign may be
needed
While the operational benefits to CFIs are well documented, questions remain about their safety performance, especially with regard to multimodal users. Additionally,
no studies have examined the environmental impacts of CFIs, which could potentially be reduced for through moving vehicles but increased for left turning vehicles compared to traditional signalized intersections.
OPERATIONS ANALYSIS
Continuous flow intersections have previously been modeled in microsimulation. Past studies have been devoted to the operations of those intersections, and whether they succeeded in more efficiently moving vehicles than conventional signalized intersections.
Jagannathan and Bared used VISSIM to simulate three cases of CFIs (referred to as XDLs) [6]. Cases A and B were dual CFIs while Case C was a T-leg CFI with only the major road having a displaced left turn. The authors used the number of stops and
intersection delay as parameters for evaluation. Their findings indicated that the CFI would outperform a conventional signalized intersection in all demand scenarios. However, the degree to which delay and queues were reduced were dependent on the volume of traffic at the intersection. The reduction in stops due to the CFI over a
conventional intersection ranged from 15% to 30% for undersaturated traffic conditions and 85% to 95% for saturated traffic conditions.
A 2013 study by Autey et al. looked at four different alternative intersection designs, two of which were the median U-turn (MUT) and CFI (referred to as XDL) [7]. Using VISSIM to model generic intersections with varying traffic volumes, the authors compared delay results for the four types of intersections. Most significantly, they found that each alternative design outperformed a conventional signalized intersection,
increased, especially when the percentage of left-turning traffic increased, but that the CFI was able to handle large traffic demand without failing.
Reid and Hummer (2001) compared seven different unconventional designs (including the CFI, jughandle, and MUT) to a conventional intersection [8]. Unlike Autey et al., Reid and Hummer used travel time as a performance measure in evaluating each design. Seven conventional intersections were modeled in CORSIM and modified to reflect the ideal geometries of the seven alternative intersection designs. The results showed that, as in other studies, at least one alternative intersection design always outperformed a conventional signalized intersection. Significant for future emissions work, the authors found that the MUT design produced the most miles driven at each intersection, which could be an indicator of increased emissions production. It is also interesting to note that the authors found that the jughandle was always outperformed by a conventional intersection in average travel time [8]. This might be outweighed by other benefits, but by the performance measure chosen by Reid and Hummer alone, the
jughandle was found to be inferior to a conventional signalized intersection. SAFETY ANALYSIS
The most common method of analyzing roadway safety is by comparing current crash levels with historical records. This allows for a statistical analysis of real-world data that present an accurate picture of the roadway conditions. Once a section of roadway experiences more crashes than it has historically seen or is expected to see, remediation techniques are employed by transportation agencies to combat the problem. This is helpful for analyzing locations that have been in place for a while, as there is usually sufficient historical data to observe statistically significant changes.
However, for newer sections of roadway or proposed improvements, for many years there was no way to assess the safety performance. This prompted researchers under an FHWA grant to develop the Surrogate Safety Assessment Model (SSAM) [9]. SSAM is a software program which uses codified parameters to evaluate the presence of traffic conflicts given simulated vehicle trajectories. The model uses the surrogate safety measure of traffic conflicts in place of actual crash frequency to quantify the safety performance of a roadway.
e locations in an intersection where two
situation in which two or more road users approach each other in time and space to such
an extent that there is risk of coll [10].
Traffic conflicts do not necessarily indicate that a crash occurs, as in most circumstances drivers alter their behavior. For example, a driver approaching a queue at a red light will almost always slow down to avoid a rear-end collision, even though depending on speed and acceleration that could be defined as a traffic conflict by an observer. SSAM
improves on the subjectivity that a human observer would bring to a real-world observation by using several surrogate measures of safety to define a conflict. These surrogate measures include minimum time-to-collision (TTC) and minimum
post-encroachment (PET). To analyze a roadway in SSAM, the roadway must be modeled in a microsimulation software. Trajectory (.trj) files can be exported from microsimulation software to SSAM and analyzed for traffic conflicts.
SSAM was validated by researchers in three main respects: theoretical validation, field validation, and sensitivity analysis for various intersection designs. In the theoretical
validation, researchers were primarily concerned with the relative accuracy of the model in assessing 11 pairs of intersection designs. These designs included 6 conventional signalized intersections, one diamond intersection, one median U-turn, and three roundabouts. In each pair, design A was presumed by intuition to be the safer design while design B was presumed to be the less safe design. Conventional crash prediction models based on approach volumes and geometric factors were used to compare design A to design B. Then, Gettman et al. compared the same two designs in SSAM to see if SSAM made the same predictions as the conventional crash prediction models. The results of the theoretical validation indicated, however, that often design A had more conflicts than design B, while design B had higher severity conflicts than design A [11]. And while some of the predictions from surrogate measures matched those of the
conventional crash prediction models, other cases yielded inconclusive or
counterintuitive results. Researchers suggested that more work should be done to investigate the implications of surrogate safety measures, as to which design is objectively safer.
Unlike the theoretical validation, the field validation was conducted to ensure the absolute accuracy of SSAM [11]. Eighty-three locations were chosen for simulation and the results of the SSAM analysis were compared to historical crash data obtained from insurance claims. This validation demonstrated that the conflict data from SSAM
correlated well with the historical crash data for all crash types, except for left-turn right angle crashes (defined as crossing conflicts) which were underrepresented in SSAM. A relationship between conflicts and crashes was calibrated with data from the study and is given in the equation below. 11
(1)
The sensitivity analysis involved an SSAM analysis of a subset of five out of the previous 83 locations modeled in four separate microsimulation software. Each of the five study intersections were conventional signalized intersections, with different signal timing plans and geometries. The trajectory files from an analysis of each location in VISSIM, AIMSUN, Paramics, and TEXAS were analyzed in SSAM and the results compared with each other. Researchers found SSAM to be useful in revealing anomalies in simulation software and noted that their work has prompted software updates from TEXAS and VISSIM as of 2008 to account for these errors [11].
Although there are no publications detailing the use of SSAM in CFIs, SSAM has been used to evaluate other intersection designs, most notably conventional signalized intersections and roundabouts. Shahdah et al. (2014) used SSAM in developing a model to obtain crash modification factors (CMFs) in urban intersections [12]. Their work focused on how the relationship between observed crash data and simulated conflict data could be used in the development of CMFs for the conversion of permitted left-turns to protected left-turns. These CMFs were compared with a traditional crash-based empirical Bayses before and after study. This work was expanded by Shahdah et al. (2015), where researchers confirmed the findings of Shahdah et al. (2014) with more study sites [13]. They concluded that the relationship between observed crashes and simulated conflicts was significant, and that the relationship grew stronger as the threshold for conflicts was increased (i.e. TTC lowered). Roach et al. (2016) used VISSIM and SSAM to evaluate both a single roundabout and double roundabout and compared the results to field
reduction of conflicts that would occur due to the conversion of conventional
intersections to roundabouts. This research also concluded that SSAM can be valid for estimating conflicts at roundabouts if the demand is high enough to produce conflicts. If the demand is low such that no or few conflicts would be present, SSAM was found to be unsuitable for highlighting troublesome locations.
EMMISIONS ANALYSIS
For this project, the focus of emissions analysis was on microsimulation studies. Other methods of emissions analyses exist, such as analytical models and real-world measurements. For analyzing a rare and unconventional intersection type, though, it was determined that the best analysis tool was to use an emissions model in conjunction with a microsimulation software. The most common emissions modeling software used in the literature is CMEM, the Comprehensive Modal Emissions Model [15]. The model itself was developed by researchers at the University of California, Riverside in partnership with researchers from the University of Michigan and Lawrence Berkeley National Laboratory. While also including a model for heavy-duty vehicles (HDVs), the original model was designed for light-duty vehicles (LDVs). Unlike other software which is often based on
speed-physical power-demand modal modeling approach based on a parameterized analytical [15]. In other words, emissions are modeled directly on the physical characteristics and operating behaviors of vehicles. This can be done on a microscopic basis given individual vehicle second by second profiles, or on a macroscopic basis given average fleet characteristics. The model is comprehensive in that
it has been developed for a number of light and heavy-duty vehicles, in various ages and states of repair.
Other emissions models include MOVES and VT-Micro. MOVES was developed by the EPA to use statistically based vehicle specific power (VSP) to calculate emissions, rather than the analytical modeling of physical processes performed by CMEM. VT-Micro is a microscopic emissions model like CMEM; however, instead of using a power-demand model,
VT-[16].
Stathopoulos and Noland (2003) used CMEM in conjunction with VISSIM to evaluate the emissions benefits of two traffic-flow improvement scenarios [17]. The first scenario was the addition of a lane to a frequent bottleneck merge location; the second was a traffic signal coordination project. The goal of this research was to determine whether short-term and long-term environmental benefits could be achieved. While in the short-term, researchers found a reduction in emissions, this was unable to be sustained in the long-term with the introduction of new demand for both scenarios.
Song et al. (2012) illustrated the drawbacks of using MOVES in conjunction with a microsimulation analysis to provide definitive estimates of real-world emissions
conditions [18]. Their work indicated that the default VSP distributions of VISSIM tended to differ significantly from real-world VSP distributions at times, notably higher and lower power ends of the spectrum. This was especially noticeable at lower vehicle speeds, where the percent error for estimated emissions was even higher than for other speeds. This meant that using MOVES and VISSIM to compare alternative treatments
was unreliable, as any differences in speed caused by changes to the roadway would result in errors in emissions estimation.
Park and Rakha (2010) used VT-Micro to examine the environmental impacts of installing a CFI. Using data provided by Utah DOT, Park and Rakha developed
microsimulation models for no-build and build scenarios for a CFI in West Valley City, UT. The output from the microsimulation models was used in VT-Micro to compare emission productions for both scenarios. The authors found that emission improvements were produced in the range of 0% to 10 % by constructing a CFI in place of a
conventional signalized intersection [19]. This study only looked at one intersection, however, and the authors recognized the need to evaluate other CFI locations and at varying demand levels.
SUMMARY OF LITERATURE REVIEW
The papers detailing operations performance all used microsimulation models to determine the best conditions under which to use each intersection type. CFIs were found to generally perform better than conventional signalized intersections in terms of overall delay and stops, even though that overall benefit sometimes came at the expense of left-turning vehicles.
While the safety benefits of CFIs have been discussed in theory, CFIs have only recently been implemented in the United States. Therefore, before and after crash data is only now becoming available. Additionally, surrogate safety measures like conflicts have not been used to demonstrate the safety benefits of CFIs, despite being used for other intersection types.
Finally, despite the environmental benefits of alternative intersections being touted by researchers, only one study could be found that attempted to quantify the emission improvements associated with CFIs. Other studies used emissions models and microsimulation to assess other roadway improvement scenarios, but found mixed results when assessing any long-term benefits associated with the improvements. Additionally, research showed that inaccuracies in some of these emissions models yielded unsuitable results for quantifying emissions performance at an intersection.
CHAPTER 3: STUDY DESISGN
The study design is composed of the research objectives and research tasks. RESEARCH OBJECTIVES
Defining research objectives was essential to execute the purpose of this research. Each objective is discussed more at length in this chapter, but the four basic objectives are as follows:
1. Validate the accuracy of SSAM in estimating type and location of crashes at
CFIs using real-world crash data.
2. Compare the safety of CFIs to the safety at signalized intersections using
microsimulation.
3. Compare emissions associated with CFI operations to those associated with
operations of signalized intersections.
4. Assess any potential safety and environmental benefits of CFIs at varying
demand levels.
The following subsections detail the above objectives. Research Objective 1
Validate the accuracy of SSAM in estimating type, number, location, and number
of crashes at CFIs using real-world crash data.
As stated in the literature review, little research has been performed investigating the validity of SSAM in assessing safety at CFIs. By comparing the predicted crashes
from a surrogate safety analysis to the actual crash data we can validate the use of SSAM for intersection types not previously validated by its creators. Exact crash location data is not available; however, crash location relative to approach legs, numbers, and types can be compared. This can be done for one of the two study intersections.
Research Objective 2
Compare the safety of CFIs to the safety at signalized intersections using
microsimulation.
Most studies that investigate the safety of alternative intersection types use a before/after crash analysis. While useful for a single intersection, it does not necessary reveal much about the intersection type in general. By performing a surrogate safety analysis and comparing the results from different intersection types, the safety benefits of CFI relative to a conventional signalized intersection can be understood.
Research Objective 3
Compare the emissions associated with CFIs to those associated with signalized
intersections.
While the environmental impacts of other intersection types (such as conventional signalized intersections and roundabouts) have been studied, little quantitative research exists for the three intersection types studied in this paper. Theoretically, these
intersection types would reduce total emissions produced, as average number of stops and delay are reduced. However, to verify this hypothesis, the levels of CO2, CO, NOx, and HC at the alternative intersections will be compared to the levels at a conventional
signalized intersection. This will be completed using microsimulation software along with the CMEM emissions modeling software.
Research Objective 4
Assess any potential safety and environmental benefits at varying demand levels.
In order to provide a recommendation to practitioners regarding the installation of a CFI, any potential safety and environmental benefits should exist not only at current demand levels, but in off-peak hours and unexpected demand increases. SSAM and CMEM analyses will be repeated at five different demand scenarios for both the conventional signalized intersection and CFI.
RESEARCH TASKS
In order to complete the above research objectives, the following series of tasks has been created.
Task 1: Literature Review
The first task was to complete a literature review of the subject matter related to the research objectives. This yielded previous studies on operations, safety, and emissions at alternative intersection designs. Additionally, it explored models for estimating
emissions from microsimulation models.
Task 2: Selection of Test Sites and Data Collection
The two sites to be used as case studies were selected. These are the intersections of Summit Rd. and MO-30 in Fenton, MO (Site A), and of Eisenhower Blvd. and
Site A was selected because of its rural setting. The major road MO-30 has a speed limit of 60 miles per hour, and intersects with Summit Road, which has a speed limit of 35 miles per hour. Access is restricted on MO-30 to motor vehicles, meaning no multimodal transportation is allowed at the intersection. There are no bicycle or
pedestrian treatments. Therefore, Site A is suitable for examining the rural applications of CFIs. Figure 3.1 below contains a satellite image of the first study site.
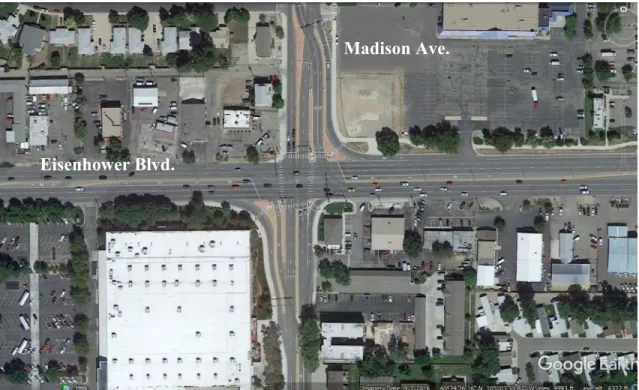
Figure 3.1: CFI at Summit Road and MO-30, Fenton, MO (Source: [20]) On the other hand, Site B was chosen for its location in a more urban setting. Commercial businesses line both intersecting roads, and therefore the speed limit of both roads is only 35 miles per hour. Figure 3.2 below contains a satellite image of the second test site.
Summit Rd.
Figure 3.2: CFI at Madison Ave. and Eisenhower Blvd., Loveland, CO (Source: [20])
Data for Site A was obtained by the Missouri DOT. Signal timings, traffic
volumes, and turning counts were obtained along with SYNCHRO files used in the initial development of the intersection. Data for Site B was obtained by the City of Loveland, CO. This includes signal timings for the main intersection as well as those for two adjacent intersections so the effects of platooning can be captured. Additionally, crash data, traffic volumes, and turning counts were obtained for the intersection.
Task 3: Development of Microsimulation Models
Microsimulation models for a conventional signalized intersection and a CFI were developed for both Fenton, MO and Loveland, CO. Provided traffic volumes and turning movement counts were used. Provided signal timings were used whenever available,
Eisenhower Blvd.
otherwise signal timings were optimized in SYNCHRO with the goal of minimizing total delay and stops.
Task 4: SSAM Analysis
Trajectory (.trj) files were obtained for each simulation run in VISSIM. These were imported into SSAM and analyzed to determine vehicle conflicts. Conflicts were color-coded by conflict type. A background layer was added to the analysis so that the conflicts could be mapped over the original satellite image, helping to determine the most problematic locations.
Task 5: Comparison of Field and Simulation Safety Data
Potential conflicts from the surrogate safety analysis were obtained, and compared with real-world crash data. This is due to the cooperation of the City of
Loveland, CO in sharing crash data from the test site since the CFI was constructed. This analysis was used to confirm that SSAM is capable of accurately predicting conflict type and troublesome locations.
Task 6: Emissions Analysis through Simulation
After the microsimulation models were calibrated and validated, vehicle emissions (including HC, NOX, CO, and CO2) were estimated using CMEM. CMEM
requires second-by-second vehicle speed trajectories, as well as vehicle fleet
characteristics. To account for stochasticity, multiple simulation runs were conducted and emission results averaged. These results were obtained for both conventional signalized intersections and CFIs and were compared to determine if alternative designs do in fact reduce emissions.
Task 7: Sensitivity Analysis of Safety and Emissions
To determine whether CFIs have a true advantage over conventional signalized intersections, both intersections were simulated in VISSIM for varying levels of demand. Vehicle trajectories for these additional simulations were analyzed using SSAM and CMEM to determine the conflict and emissions at higher and lower volume levels than the existing field conditions.
Task 8: Documentation of Findings
The research detailed above was document was
submitted to the College of Engineering of the University of Massachusetts Amherst. The was followed in the
completion of this project.
RESEARCH CONTRIBUTIONS
In total, this research has four major contributions:
SSAM validation for a CFI in terms of conflict type and location.
Assessment of CFI safety performance compared with conventional signalized intersections.
Evaluation of the environmental performance of CFIs compared with equivalent conventional signalized intersections.
Determining whether the safety and emissions benefit of CFIs are sensitive to varying levels of travel demand.
CHAPTER 4: SAFETY ASSESSMENT THROUGH MICROSIMULATION OF CFIs
METHODOLOGY
The methodology consists of a before and after conflict study in a
microsimulation environment using two selected study sites. The conflict analysis is performed using VISSIM and SSAM. The results from the SSAM before and after analysis are compared with each other for both study sites to determine if safety improvements occurred after the installation of a CFI. The results from the before and after studies for the Loveland, CO study site are also compared with crash data collected from the field to determine the accuracy of SSAM in estimating CFI conflicts.
Study Sites
Two sites were selected for this study: 1) the intersection of Summit Rd and MO-30 in Fenton, MO and 2) the intersection of Eisenhower Rd. and Madison St. in
Loveland, CO. Both intersections are currently partial CFIs that have been converted from conventional fully actuated intersections. Two study sites were chosen to obtain a larger sample size and to demonstrate the differences in CFI application. The Loveland, CO CFI is in a higher density commercial neighborhood, with traffic moving at a speed limit of 35 miles per hour on the major road. The displaced left turns are located on the minor road, which sees a high percentage of vehicles turning left onto the major road. The Fenton, MO CFI is in a more rural setting, with MO-30 having a speed limit of 60 miles per hour. The displaced left turns are located on the major road to improve the throughput of MO-30. Both study intersections have channelized right turn lanes on
approaches that do not have displaced left turns. These intersections are depicted in Figure 4.1.
Figure 4.1: Study Sites: a) CFI at Summit Rd and MO-30 in Fenton, MO, and b) CFI at Eisenhower Blvd and Madison Ave in Loveland, CO (Source:[20])
In order to accurately capture the effects of platooning on an urban corridor for the Loveland, CO CFI, the nearby cross street intersections of Redwood Dr and Boise Ave with Eisenhower Blvd were modeled in VISSIM. Data for the Loveland, CO study site was obtained from the City of Loveland Public Works Department. For this study, the evening peak hour of 5PM-6PM was simulated. Peak hourly volumes and turning movement counts were provided from 2012 traffic studies of the three specified intersections. These were scaled to 2015 levels using AADTs provided for each year from the Colorado Department of Transportation (DOT) Traffic Data Management website [21]. Current signal timings for each intersection were provided by the city engineer as of 2016 and used for the after conditions. Signal timings for all three
intersections along the Eisenhower Blvd corridor were optimized in SYNCHRO for the before conditions by minimizing delays. Toavoid excessive queues, the optimized cycle length was specified to be between 40 and 150 seconds. Coordinated cycle lengths of 120 seconds for Madison Ave and Boise Ave and 60 seconds for Redwood Dr. were
b)
a) Madison Ave.
Eisenhower Blvd. Summit Rd.
determined to be optimal. The degree of saturation was calculated for the study
intersection for both before and after conditions. An initial degree of saturation of 0.81 was reduced to 0.62 after CFI construction. Crash data was also provided for the
intersection for a ten-year period from 2006 to 2016, which represented both before and after the construction of the CFI in 2010.
Data for the Fenton, MO study site was obtained through a records request from the Missouri DOT. Due to the lack of intersections in close proximity to the study intersection, no additional intersections were simulated for this location. Evening peak hour volume and turning movement counts from 2012, as well as a 2012 signal timing plan, were taken from a SYNCHRO file of the CFI provided by the Missouri DOT and used for the after conditions. The cycle length of the CFI was 90 seconds. A signal timing for the conventional signalized intersection was not provided, so the intersection was built and signal timings were optimized in SYNCHRO using the old geometry and phasing sequence but 2012 volumes. The cycle length was optimized to be 150 seconds. The intersection degree of saturation was reduced from 1.04 to 0.59 after the CFI
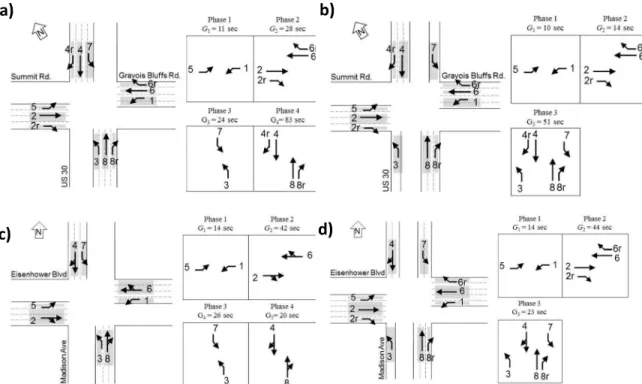
construction. Lane groups and phasing diagrams for both before and after conditions for the study intersections are presented in Figure 4.2 on the following page.
Figure 4.2: Lane Groups and Phasing Schemes for a) Fenton, MO Conventional Intersection, b) Fenton, MO CFI, c) Loveland, CO Conventional Intersection, and
d) Loveland, CO CFI Microsimulation Modeling
The data discussed above was used to model the before and after conditions for both study sites in VISSIM 9. VISSIM is a microsimulation software developed by PTV that uses behavior modeling to create time step trajectories individual vehicles [22]. Driver behavior is modeled with separate functions of car following and lane-change behaviors. This software was chosen for its flexibility in creating uncommon geometries and its ability to create trajectory files that can be exported to SSAM. The physical geometry of the current intersections was modeled by tracing the networks from the integrated Bing Maps feature of VISSIM. The physical geometries of the before
conditions were modeled by tracing scaled images of the old intersections from Google Earth. Speed limits, lane widths, turning movements, conflict areas, and right-turn on
reds were all input to match existing conditions. Reduced speed decision zones were included to simulate the slowing down of vehicles due to turning movements. All other parameters were left as the default values for the initial models before calibration. In total, five models were created in VISSIM. Before and after models using current
volumes were created for the Fenton, MO study site to allow for an SSAM comparison of the before and after intersection designs. Two before and one after models were created for the Loveland, CO study site. One before model used the current volumes, so that the SSAM results of before and after intersection geometry and signal timing could be compared. The other before model used volumes from 2008, so that the SSAM results could be compared to the provided crash data from just before the CFI was installed. A total of ten runs were performed for each model with random seeding. Each run had a simulation period of 3600 seconds and a warm up period of 300 seconds. Table 1 below contains a list of the microsimulation models developed for this study, and includes the different volume years and signal timings used.
Table 4.1: List of Microsimulation Models Developed
VISSIM Model Volume Year Signal Timings
I) MO Conventional Intersection 2012 2012 SYNCHRO Optimized
II) MO CFI 2012 2015 - Provided
III) CO Conventional Intersection 2009 2009 SYNCHRO Optimized
IV) CO Conventional Intersection 2015 2009 SYNCHRO Optimized
V) CO CFI 2015 2015 - Provided
Upon visual inspection, several unwanted phenomena were observed to occur in the VISSIM models, including simulated crashes between vehicles. These resulted from either insufficient gaps for safe turning movements, abrupt lane changes, or the failure to
follow priority rules and conflict behaviors. Chapter 4 of the SSAM Validation Report by FHWA provides guidance in solving these problems, which was followed in this study [9]. When queuing was observed in the left and right hand turn lanes, trailing vehicles would pass through the rear of the last queued vehicle while changing lanes. To
overcome this, the option to keep minimum lateral distance from vehicles was selected from the driving behaviors window in VISSIM. This can reduce capacity, but is necessary to avoid this unusual lane-changing behavior. Additionally, it was observed that vehicles at the beginning of green intervals would not wait for slow moving turning vehicles to clear the intersection before accelerating. This generated a number of
collisions that increased the number of simulated conflicts, resulting in crashes, which would most likely be avoided in real life. Per the suggestion of Gettman et al. [9], priority rules were created for those through movements that dictated they wait until all turning vehicles have cleared the intersection before moving. Even still, conflicts existed as the minimum gap acceptance was too small, so the default VISSIM value of 3.0 seconds was increased to 5.0 seconds. This resulted in safe driving behavior observed from vehicles beginning their movements. It was noticed, however, that simulated crashes still occurred at times, especially on the high volume roads like Eisenhower Blvd. or MO-30. These crashes were excluded from the final SSAM analysis, at the recommendation of Gettman et al. [9].
After making the above adjustments, calibration checks were performed on the model. According to the Traffic Analysis Toolbox Volume III: Guidelines for Applying Microsimulation Software [23], calibration of microsimulation models can be performed according to the following calibration acceptance targets which were created by the
Wisconsin DOT. Individual link flows with between 700 veh/h and 2700 veh/h must be within 15% of the observed conditions in at least 85 percent of cases, and links with flows less than 700 veh/h must be within 100 veh/h for at least 85 percent of cases. These criteria fit the given hourly flows in the 5 microsimulation models created, and the 85 percent criteria was met for all 10 runs. In addition, the sum of all link flows in the simulated networks was within 5 percent of all link inputs and visual inspection
confirmed that congestion occurred in expected places. Therefore, no changing of other default VISSIM parameters was required and no additional calibration was necessary. Safety Assessment Through SSAM
Trajectory (.trj) files were produced in the VISSIM evaluation and imported into SSAM version 3. These trajectory files were obtained for each of the five models. A total of ten simulation runs were performed with random seeds for each model. Thus, in total, 50 SSAM evaluations were performed. A SSAM evaluation includes reading the
trajectory file, estimating the number, type, and location of conflicts present in each simulation run, and producing a summary table of those conflicts. Conflicts were mapped onto the intersection, providing information on the most troublesome locations. For this study, the conflict parameters were set to the SSAM default values of 1.5 seconds or less for maximum time-to-collision (TTC) and 5 seconds or less for maximum
post-encroachment time (PET). As stated above, minimum TTC and PET were each set to 0.01 seconds so as to not include crashes that occurred in VISSIM due to faulty simulation logic, i.e. vehicles not observing the physical geometries of other vehicles. Conflict types in SSAM are defined by the angle of incidence between two vehicle paths. These thresholds are defined by SSAM, but can be changed by users. For this study, the
values were left at their default thresholds: less than 30° for a rear-end conflict, between 30° and 80° for a lane-change conflict, and greater than 80° for a crossing conflict. ANALYSIS AND RESULTS
The results are presented by study site. Average number for each type of conflict is displayed in Tables 1 and 2 for the Loveland, CO and Fenton, MO study sites
respectively for both before and after conditions. Unpaired t-tests were performed for each conflict type for the before and after conditions, and the results are also included in these tables. The level of significance chosen for the t-tests is 0.01.
Fenton, MO Study Site
The results from the SSAM evaluation demonstrate a reduction in total conflicts after the conversion of the conventional signalized intersection to a CFI. The before conditions yielded a mean of 156 conflicts/hr, while the current conditions yielded a mean of 144.7 conflicts/hr. This reduction was not statistically significant; however, it is notable that the standard deviation of conflicts/hr was much greater in the before than the after conditions. This suggests that there is more variability and unpredictability in the number of conflicts at a conventional signalized intersection than a continuous flow intersection. This reduction was mostly due to the near-elimination of crossing conflicts, from 15 conflicts/hr to 2.1 conflicts/hr, and the reduction of lane-change conflicts from 39.0 conflicts/hr to 17.4 conflicts/hr. Rear-end conflicts on the other hand, experienced a slight increase, from 103 conflicts/hr to 125.2 conflicts/hr. These, as well as results from significance tests, can be seen in Table 4.2.
Table 4.2: SSAM Conflicts Summary for Fenton, MO Intersection
Type Before After t-value P-value
Lane-Change 39.0 17.4 3.934 0.00234
Rear-End 103.0 125.2 -3.030 0.00843
Crossing 15.0 2.1 8.712 2.88E-06
Total 156.0 144.7 0.931 0.36903
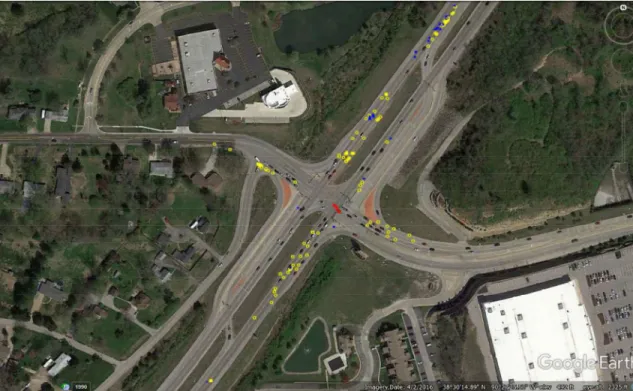
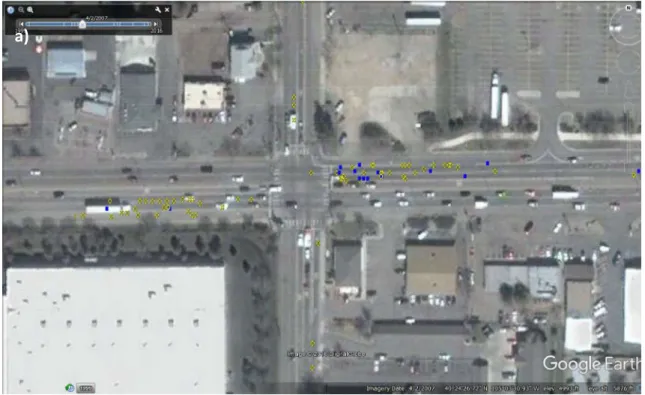
Figure 4.3 depicts the location of conflicts for the before and Figure 4.4 depicts the after conditions. Crossing conflicts are depicted in red, lane-change conflicts in blue, and rear-end conflicts in yellow. Each image below contains the conflicts from four runs, to show the consistency between the different SSAM runs.
Figure 4.4: Conflict Map for the After Condition of the Fenton, MO Study Site Loveland, CO Study Site SSAM Analysis
As with the Fenton, MO study site, the SSAM evaluation of the Loveland, CO site revealed an overall reduction in total conflicts after the installation of a CFI. Using 2012 volumes, the before conditions yielded a mean of 94.5 conflicts/hr while the CFI yielded a mean of 77.9 conflicts/hr. This reduction is due to a reduction in rear-end conflicts, from 79.5 conflicts/hr to 62.3 conflicts/hr. Lane-change conflicts did increase slightly, from 14.9 conflicts/hr before to 15.5 conflicts/hr after. This increase is not statistically significant, however, and is most likely due to the close proximity of the three intersections in the test site. The overall reduction in conflicts and the reduction in rear-end conflicts are significant. These results, as well as results from the t-tests, can be seen in Table 4.3.
Table 4.3: SSAM Conflicts Summary for Loveland, CO Intersection
Type Before After t-value P-value
Lane-Change 14.9 15.5 -0.389 0.353
Rear-End 79.5 62.3 2.655 0.0131
Crossing 0.1 0.1 0.0 0.500
Total 94.5 77.9 2.545 0.0157
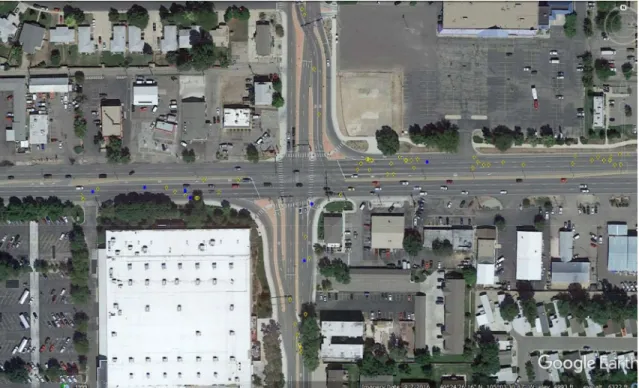
Figure 4.4 below depicts the location of conflicts for both before and after conditions. Crossing conflicts are depicted in red, lane-change conflicts in blue, and rear-end conflicts in yellow. Each image below contains the conflicts from four runs, to show the consistency between the different SSAM runs.
Figure 4.6: Conflict Map for the After Condition of the Loveland, CO Study Site Loveland, CO Study Site Field Data
For the Loveland, CO study site, field crash data was obtained for a ten-year period from 2006-2016. Table 4.4 below presents a summary of the crash data for the Loveland, CO study site for the before and after conditions specifically for years 2009 and 2015. The year 2009 was the last full year of data available before the intersection was converted to a CFI in 2010. 2015 was chosen to correspond to the volume data used, and to account for an adjustment period while residents became familiar with the new geometry. Crash data for 2011, the year immediately following the construction of the CFI, was also included. This can be used to determine whether there is an adjustment period where drivers are unfamiliar with how to navigate the intersection. Recall that the northbound and southbound approaches had the displaced left turn lanes.
Table 4.4: Summary of Safety Analysis for the Loveland, CO Study Site
Crash Number
Type of Crash Location of Crash
Rear-End Crossing Lane-Change Other WB Approach EB Approach NB Approach SB Approach Main Intersection 2009 13 4 1 1 6 0 3 4 6 2011 7 21 1 0 3 4 0 2 20 2015 11 2 1 2 3 6 2 2 3
As observed in Table 4.4, 68 percent of the 2009 crashes were rear-end. Also significant from the expanded crash data is that 75 percent of crossing conflicts were related to the left turn movements, and 6 of the 19 total crashes occurred at the main intersection. 2011 saw an increase in crashes, especially with regards to crossing movements. Inspection of the data reveals that 19 of the 21 crossing conflicts were caused by vehicles turning left. 17 of those vehicles were turning left from Eisenhower onto Madison, which do not receive the displaced left turn. This was most likely the result of two factors. First, the eastbound and westbound left-turn movements after CFI construction were initially protected-permissive during the through movement phase. Second, the presence of the displaced left turn lane upon completing their left turn movement might have confused these users, leading them to hesitate longer in the main intersection. The combination of these two factors resulting in an increase in crashes caused the City of Loveland to change the eastbound and westbound left-turn movement to protected only, which is how the intersection was modeled for this study. Of the total 19 left-turn crashes, only two were caused by vehicles turning left from Madison onto Eisenhower, and those could have been a result of unfamiliarity with the new
intersection. By 2015, no crashes were caused by vehicles turning left on any approach. This is to be expected over time, as the CFI removes the north and southbound left turn
movements from the main intersection and drivers become familiar with the new
geometric configuration. Additional rear-end crashes might be expected at the crossover intersection, but due to the lack of specificity of the available crash data, it is unknown whether the four northbound and southbound rear-end crashes occurred due to the left movement or the through movement. Also, only 3 out of the 16 total crashes took place at the main intersection. This is a rate of 19 percent, compared to 32 percent for the before conditions, i.e., conventional signalized intersection.
Comparing these results to the SSAM analysis reveals several key trends. For the before conditions, 16 percent of the conflicts were lane-change, 84 percent were rear-end, and 0 percent were crossing conflicts. No crossing conflicts were observed in VISSIM, while the percentage of crossing crashes was 21 percent. However, the percentage of lane-change conflicts is significantly overrepresented in SSAM (16 percent vs. 5 percent). The after conditions revealed similar trends. 20 percent of the simulated
conflicts were lane-change, 80 percent rear-end, and 0 percent were crossing conflicts. A value of 84 percent rear-end simulated conflicts observed for the before conditions is an error of 23.5 percent compared with the 67 percent rear-end crashes observed in the field. Lane-change conflicts were overrepresented with a 200 percent error by microsimulation. Therefore, while SSAM confirmed the overall reduction in conflicts and the high
percentage of rear-end conflicts, it was unable to accurately predict crossing or lane-change conflicts. This illustrates a weakness in microsimulation safety analysis.
Note that while the SSAM results indicate a much higher number of conflicts than the crashes that were observed, this is because SSAM reports all potential conflicts while the field data consists of actual crashes for a whole year. The given crash data does not
include near-misses, or conflicts avoided due to driver maneuvering or intervention. For this reason, conflict types and locations were compared to the crash types and locations, presented as percentages of the total numbers.
CHAPTER 5: EMISSIONS EVALUATION OF CFIs METHODOLOGY
The previously developed microsimulation models were again used in evaluating the emissions produced at continuous flow intersections. A before and after study was conducted with a conventional signalized intersection as the before condition and a continuous flow intersection used as the after condition. Only the Loveland, CO site was studied due to uncertainty in the accuracy of the results at the Fenton, MO study site after some errors were discovered in CMEM. The same volume and turning percentages were used in the before and after conditions for a meaningful comparison. Signal timings were not reoptimized to maximize fuel efficiency or minimize emission rates. Rather, the signal timings used in Chapter 4 were again used in this task.
The emissions modeling software CMEM was used to estimate tailpipe emission rates for hydrocarbon (HC), carbon monoxide (CO), nitrogen oxides (NOx), and carbon dioxide (CO2), as well as fuel consumption, using trajectories obtained through
microsimulation. CMEM requires three input files: a vehicle activity file, vehicle definition file, and vehicle control file.
Second by second vehicle trajectories, including simulation time, vehicle ID, speed, acceleration, and routing decision, were output from VISSIM. This data was formatted to create the vehicle activity file by removing the routing decision data, which would be used later to filter out the left-turning vehicles. The vehicle definition file specifies a CMEM vehicle category for each unique vehicle ID. A consistent vehicle fleet comprising of eight vehicle categories was used in each of the evaluations. These
categories were chosen based on the work of Stevanovic et al. (2009), who mapped the vehicle types from the US Environmental Protection Agency (EPA) MOBILE 6.2 database onto the CMEM vehicle categories [24]. This database contains vehicle age distributions for the US vehicle fleet. Stevanovic et al. (2009) correlated US vehicle age distributions to CMEM vehicle categories in order to create a representative vehicle fleet. This research was crucial, as CMEM vehicle categories are based on vehicle mileage and power characteristics, which different than the more readily available vehicle age
distribution data. The output of this work was a representative vehicle fleet with eight CMEM categories and their corresponding percentages of the total fleet.
The final CMEM vehicle fleet used by Stevanovic et al. (2009) comprised of two old vehicle categories (which are Tier 0, or non-Tier 1 certified), four Tier 1 vehicle categories, and two Tier 2 vehicle categories. The Tier 1 vehicles are separated into two categories based on the mileage of the vehicle (either less than or greater than 50,000 miles driven), and two more categories based on whether the vehicle has a low or high power-to-weight ratio. Tier 0 vehicles were assumed to all have mileage greater than 50,000 miles since they are more than 25 years old at the time of this project. Therefore, Tier 0 vehicles were only differentiated by power-to-weight ratio. These eight vehicle categories were randomly assigned to each of the simulated vehicle IDs from the VISSIM output using the percentages in Table 5.1. It should be noted that this distribution is not specific to either Colorado or Missouri, but is based on national vehicle distributions.
Table 5.1: CMEM Vehicle Categories Used
Vehicle Description CMEM No. Percent of Fleet
3-way catalyst, FI, >50k miles low 4 0.13
3-way catalyst, FI, >50k miles high 5 0.13
Tier 1 >50k, low ratio 8 0.20
Tier 1 >50k, high ratio 9 0.20
Tier 1 <50k, low ratio 10 0.09
Tier 1 <50k, high ratio 11 0.09
ULEV 51 0.08
PZEV 52 0.08
FI = Fuel injected
The vehicle control file specifies vehicle parameters such as vehicle mass, torque, max power, efficiency, and other emission generation rates for each vehicle category. Default CMEM parameters were used for each of the chosen vehicle categories. Once the input files corresponding to each VISSIM mode output were created, the command line interface of CMEM was used to run the program and generate emission rates. CMEM output files include second by second tailpipe emission data, as well as a summary of emissions and distance traveled for each unique vehicle ID. The emissions and distance files for the before and after scenarios of each study site were formatted for use in a database. Using SQL Server, the CMEM emissions and distance output were then linked by vehicle ID and the emission rates multiplied by distance traveled to obtain total emissions produced for each simulation run. Total emissions for each pollutant were divided by the total distance traveled by all vehicles to obtain a weighted average of emissions produced per mile.
Once emission rates for the vehicle fleet were calculated, the results were filtered to only include vehicles utilizing the displaced left turn lanes. In this step, the before and after Loveland, CO models were analyzed a second time, this time only including
northbound and southbound vehicles turning left. This comparison would indicate
whether or not improved intersection environmental performance as a whole was coming at the expense of the left-turning vehicles.
ANALYSIS AND RESULTS
Emission rates for the entire vehicle fleet for all ten simulation runs for the before and after conditions are presented first in Table 5.2. These are followed by Figures 5.1-5.3, which compare the average emission rates of significant pollutants for before and after conditions. Error bars in these figures depict the 99% confidence interval. Additionally, these figures also compare emission rates for the vehicle fleet with the average emission production for the left-turn vehicles using the newly configured displaced left-turn lanes. The level of significance chosen for all statistical significance tests was the 99% confidence level.
Loveland, CO Study Site
The Loveland, CO study site experienced a reduction in emissions in all
categories after the conversion of a conventional signalized intersection to a CFI. NOx had the greatest reduction at 7.90%, while CO2 had the least reduction at 6.32%.
Additionally, fuel economy increased by 6.75% after the conversion. These changes were all statistically significant, having P-values approaching zero at the 99% confidence level. Reductions in emission rates for all types can most likely be attributed to the better
operational performance of the CFI. Average delay was reduced from 34.5 seconds per vehicle to 26.9 seconds per vehicle, and the average number of stops was reduced from 0.77 to 0.63. Less time spent waiting and fewer stopping and starting movements both contributed to the reduction in emission rates.
Left-turning vehicles, on the other hand, experienced higher NOx and CO2 rates
and lower fuel economy than the total vehicle averages. In addition to higher emission rates for left-turning vehicles than the total vehicle averages, left-turning vehicles experienced an increase in emission rates from the before to the after condition. This increase was 7.10% for HC, 1.78% for CO, 12.8% for NOx, and 12.3% for CO2. A
10.5% reduction in fuel economy was also observed for left-turning vehicles in the after condition. These changes from the before to after condition were all significant at a confidence level of 99%. This indicates that while intersection emissions performance as a whole improves upon converting a conventional signalized intersection to a CFI, this benefit comes at the expense of higher emissions for left-turn users. Left-turn users are subject to additional delays waiting to use the crossover intersection and, in case of intersection capacity failure, might be forced to stop twice once at the crossover intersection and once at the main intersection. These extra delays and stops for left-turn users would not only make their emission rates higher than those of other movements, but might also explain the increase after the conversion of a conventional signalized
intersection. The following chapter addresses whether that cost to left-turn users outweighs the intersection benefit under varying vehicle demands.
Table 5.2: Average Emission Rates at the Loveland, CO Study Site for All Vehicles
Before Condition After Condition
HC (g/mi) CO (g/mi) NOx (g/mi) CO2 (g/mi) Fuel (mi/gal) HC (g/mi) CO (g/mi) NOx (g/mi) CO2 (g/mi) Fuel (mi/gal) Run 1 0.228 16.3 0.522 429 18.4 0.212 15.0 0.465 398 19.9 Run 2 0.222 15.6 0.503 432 18.4 0.213 14.8 0.480 408 19.5 Run 3 0.232 16.3 0.518 437 18.1 0.216 15.5 0.482 410 19.3 Run 4 0.226 15.9 0.513 428 18.5 0.211 15.0 0.473 407 19.5 Run 5 0.228 16.6 0.507 426 18.5 0.218 15.3 0.483 405 19.6 Run 6 0.229 16.2 0.520 427 18.5 0.214 15.2 0.479 402 19.7 Run 7 0.227 15.9 0.515 434 18.3 0.207 14.8 0.471 398 19.9 Run 8 0.223 15.9 0.512 432 18.4 0.212 15.0 0.465 405 19.6 Run 9 0.227 16.1 0.520 433 18.3 0.207 14.7 0.464 399 19.9 Run 10 0.228 16.1 0.514 428 18.5 0.212 15.3 0.476 402 19.7 Average 0.227 16.1 0.514 431 18.4 0.212 15.1 0.474 403 19.6 Std. Dev. 0.00270 0.259 0.00569 3.24 0.126 0.00329 0.238 0.00687 3.98 0.192
Figure 5.1: NOx Emission Rates Loveland, CO
Figure 5.2: CO2 Emission Rates Loveland, CO
0.000 0.100 0.200 0.300 0.400 0.500 0.600 0.700 0.800
Total Vehicles Left-Turn Vehicles
N O x (g /m i) CO Conventional CO CFI 0.0 100.0 200.0 300.0 400.0 500.0 600.0 700.0
Total Vehicles Left-Turn Vehicles
C O 2 (g /m i) CO Conventional CO CFI
![Table 2.1: Summary of CFI Benefits and Disbenefits (Source: [5]) Characteristics Potential Benefits Potential Disbenefits Safety Left-turns removed from](https://thumb-us.123doks.com/thumbv2/123dok_us/598307.2571584/18.918.156.794.415.932/summary-benefits-disbenefits-characteristics-potential-benefits-potential-disbenefits.webp)
![Figure 3.1: CFI at Summit Road and MO-30, Fenton, MO (Source: [20]) On the other hand, Site B was chosen for its location in a more urban setting](https://thumb-us.123doks.com/thumbv2/123dok_us/598307.2571584/31.918.173.810.369.760/figure-summit-road-fenton-source-chosen-location-setting.webp)
![Figure 4.1: Study Sites: a) CFI at Summit Rd and MO-30 in Fenton, MO, and b) CFI at Eisenhower Blvd and Madison Ave in Loveland, CO (Source:[20])](https://thumb-us.123doks.com/thumbv2/123dok_us/598307.2571584/36.918.171.811.206.413/figure-study-summit-fenton-eisenhower-madison-loveland-source.webp)