Passenger Transport Mode
Shares in World Cities
Passenger transport mode share refers to the percentage of passenger journeys or trips by the main mode of transport and is typically reported through travel surveys. Comparing passenger transport mode share across different cities is a challenging task. As travel surveys are typically conducted for long-term strategic planning purpose, such surveys are not conducted frequently and detailed reports are not always published. The situation is further complicated as the surveys are often commissioned by local governments. The geographical areas covered, sampling and interviewing techniques, questionnaire and stratification methods deployed by travel surveys vary greatly in different countries. For example, the definition for a pedestrian trip or a public transport trip may be different in different countries. In cities like Hong Kong, mode share is based on the number of boardings by mode of transport (or journey-stages). In most cities, however, mode share is reported on the basis of the number of journeys, which may consist of a series of boardings on different modes of transport and the main mode is reported as the transport mode.
Mode share is affected by household incomes, land use patterns, and many other economic and social factors. Therefore, the figures may not be directly comparable. They should be
analysed together with the historical, social and economic situation of the city.
The mode share information of some major metropolitan cities in the world is presented. They include the traditionally advanced cities (e.g. London, Paris, New York and Tokyo), newly developed cities (e.g. Hong Kong, Seoul), cities often cited in transport innovations or sustainable transport surveys (e.g. Bogota, Osaka), and emerging mega-cities (e.g. Shanghai, Bangalore) (Table 1). For cities where mode share information of different geographical coverage is available, the geographical area that is approximately in a similar pattern to Singapore is used (e.g. land area, population density).
Table 1: List of Selected Cities
Asia
Ahmedabad, Bangalore, Beijing, Delhi, Guangzhou, Hong Kong, Mumbai, Osaka, Seoul, Shanghai, Singapore, Taipei, Tokyo Australia
Melbourne, Sydney Europe
Barcelona, Berlin, London, Madrid, Paris, Prague, Rome, Vienna
NorthAmerica
Chicago, New York City, Toronto SouthAmerica
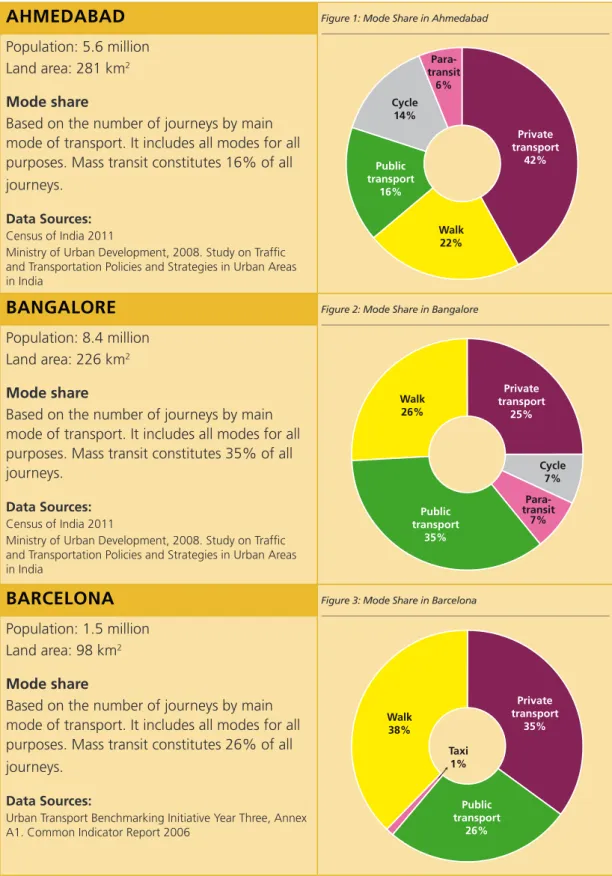
AHMEDABAD
Population: 5.6 million Land area: 281 km2 Mode shareBased on the number of journeys by main mode of transport. It includes all modes for all purposes. Mass transit constitutes 16% of all journeys.
Data Sources:
Census of India 2011
Ministry of Urban Development, 2008. Study on Traffic and Transportation Policies and Strategies in Urban Areas in India
Figure 1: Mode Share in Ahmedabad
BANGALORE
Population: 8.4 million Land area: 226 km2 Mode shareBased on the number of journeys by main mode of transport. It includes all modes for all purposes. Mass transit constitutes 35% of all journeys.
Data Sources:
Census of India 2011
Ministry of Urban Development, 2008. Study on Traffic and Transportation Policies and Strategies in Urban Areas in India
BARCELONA
Population: 1.5 million Land area: 98 km2 Mode shareBased on the number of journeys by main mode of transport. It includes all modes for all purposes. Mass transit constitutes 26% of all journeys.
Data Sources:
Urban Transport Benchmarking Initiative Year Three, Annex A1. Common Indicator Report 2006
Figure 2: Mode Share in Bangalore
Figure 3: Mode Share in Barcelona
Private transport 25% Public transport 35% Walk 26% Para-transit 7% Cycle 7% Private transport 42% Public transport 16% Walk 22% Para-transit 6% Cycle 14% Private transport 35% Walk 38% Public transport 26% Taxi 1%
BEIJING
1Population: 11.7 million Land area: 1,368 km2 Mode share
Based on the number of journeys by main mode of transport. It includes all modes for all purposes. Mass transit constitutes 23% of all journeys.
Data Sources:
Beijing Yearbook 2011
Beijing Transport Report 2005 (in Chinese only, 2005 北京 市交通发展年度报告)
Figure 4: Mode Share in Beijing
BERLIN
Population: 3.4 million Land area: 892 km2 Mode share
Based on the number of journeys by main mode of transport. It includes all modes for all purposes. Mass transit constitutes 26% of all journeys.
Data Sources:
Berlin Traffic in Figures 2010
BOGOTA
Population: 6.8 million Land area: 1,775 km2 Mode share
Based on the number of journeys by main mode of transport. It includes all modes for all purposes. Mass transit constitutes 62% of all journeys.
Data Sources:
Travel survey of Bogota and the Region 2008 (in Spanish only, Observatorio de Movilidad de Bogotá y la Región, Camara de Comercio de Bogotá), Colombia
Figure 5: Mode Share in Berlin
Figure 6: Mode Share in Bogota
Private transport 32% Public transport 26% Walk 29% Cycle 13% Other 2% Walk 15% Cycle 2% Private transport 15% Taxi 4% Bus & BRT 62% Private transport 20% Taxi 1% Rail 2% Bus 21% Others 3% Walk 21% Cycle 32%
CHICAGO
Population: 2.7 million Land area: 589 km2 Mode share
Based on the number of journeys by main mode of transport. It includes all modes for all purposes. Mass transit constitutes 16% of all journeys.
Data Sources:
Chicago Regional Household Travel Inventory: Mode Choice and Trip Purpose for the 2008 and 1990 Surveys, Chicago Metropolitan Agency for Planning
Figure 7: Mode Share in Chicago
CURITIBA
Population: 1.9 million Land area: 430 km2 Mode share
Based on the number of journeys by main mode of transport. It includes all modes for all purposes. Mass transit constitutes 45% of all journeys.
Data Sources:
ICLEI EcoMobility Case “Curitiba, Brazil - A model of transit oriented planning”
DELHI
Population: 11.0 million Land area: 431 km2 Mode share
Based on the number of journeys by main mode of transport. It includes all modes for all purposes. Mass transit constitutes 42% of all journeys.
Data Sources:
Census of India 2011
Ministry of Urban Development, 2008. Study on Traffic and Transportation Policies and Strategies in Urban Areas in India
Figure 8: Mode Share in Curitiba
Figure 9: Mode Share in Delhi
Walk 19% Cycle 1% Taxi 1% Private transport 63% Rail 5% Bus 11% Others 1% Walk 21% Private transport 28% Bus & BRT 45% Cycle 5% Walk 21% Cycle 12% Private transport 19% Para-transit 6% Public transport 42%
GUANGZHOU
2 Population: 6.3 million Land area: 1,166 km2 Mode shareBased on the number of journeys by main mode of transport. It includes only motorised modes for all purposes. Mass transit
constitutes 49% of motorised journeys.
Data Sources:
Guangzhou Yearbook 2010
Guangzhou Urban Transport Report 2010 (in Chinese only. 2010 年广州市城市交通运行报告)
Figure 10: Mode Share in Guangzhou
HONG KONG
Population: 7.1 million Land area: 1,104 km2 Mode shareBased on the number of boardings by mode of transport. It includes only motorised modes
for all purposes. Mass transit constitutes 80% of all boardings.
Data Sources:
Hong Kong in Figures 2011
Travel Characteristics Survey 2002, Transport Department, Hong Kong
LONDON
Population: 7.8 million Land area: 1,579 km2 Mode share
Based on the number of journeys by main mode of transport. It includes all modes for all purposes. Mass transit constitutes 27% of all journeys.
Data Sources:
GLA Intelligence Update 11-2011, Greater London Authority, U.K.
Travel in London, Supplementary Report: London Travel Demand Survey (LTDS) 2011, Transport for London, U.K.
Figure 11: Mode share in Hong Kong
Figure 12: Mode Share in London
Taxi 11% Private transport 40% Rail 14% Bus 35% Others 1% Private transport 11% Taxi 8% Rail 25% Bus / Tram 55% Walk 30% Cycle 2% Private transport 40% Taxi 1% Rail 12% Bus / Tram 15%
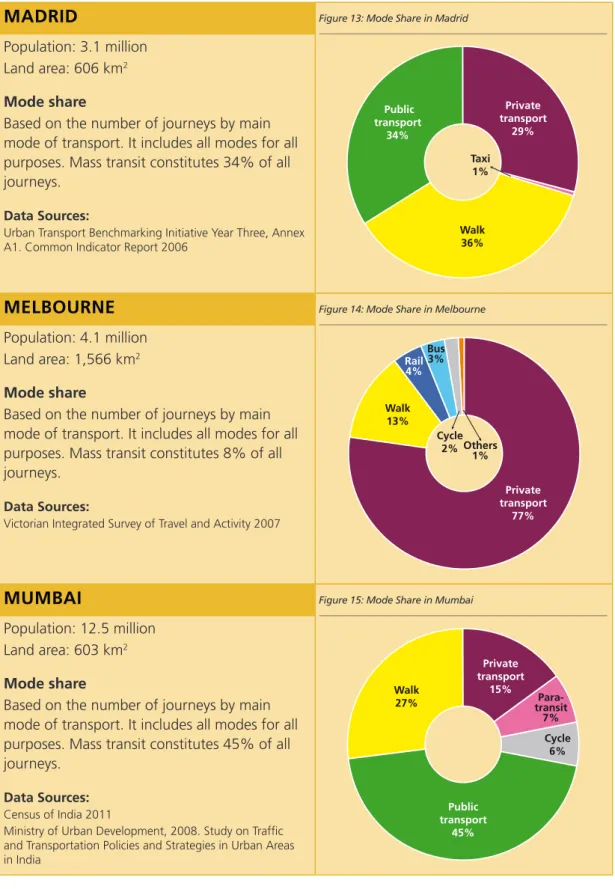
MADRID
Population: 3.1 million Land area: 606 km2 Mode share
Based on the number of journeys by main mode of transport. It includes all modes for all purposes. Mass transit constitutes 34% of all journeys.
Data Sources:
Urban Transport Benchmarking Initiative Year Three, Annex A1. Common Indicator Report 2006
Figure 13: Mode Share in Madrid
MELBOURNE
Population: 4.1 million Land area: 1,566 km2 Mode shareBased on the number of journeys by main mode of transport. It includes all modes for all purposes. Mass transit constitutes 8% of all journeys.
Data Sources:
Victorian Integrated Survey of Travel and Activity 2007
MUMBAI
Population: 12.5 million Land area: 603 km2 Mode share
Based on the number of journeys by main mode of transport. It includes all modes for all purposes. Mass transit constitutes 45% of all journeys.
Data Sources:
Census of India 2011
Ministry of Urban Development, 2008. Study on Traffic and Transportation Policies and Strategies in Urban Areas in India
Figure 14: Mode Share in Melbourne
Figure 15: Mode Share in Mumbai
Walk 36% Taxi 1% Private transport 29% Public transport 34% Others 1% Walk 13% Cycle 2% Private transport 77% Rail 4% Bus 3% Walk 27% Cycle 6% Private transport 15% Para-transit 7% Public transport 45%
NEW YORK
Population: 8.2 million Land area: 790 km2 Mode shareBased on the number of journeys by main mode of transport. It includes all modes for all purposes. Mass transit constitutes 23% of all journeys.
Data Sources:
Census 2010, U.S. Census Bureau
National Household Travel Survey 2009, New York City
Figure 16: Mode Share in New York
OSAKA
Population: 2.7 million Land area: 222 km2 Mode share
Based on the number of journeys by main mode of transport. It includes all modes for all purposes. Mass transit constitutes 34% of all journeys.
Data Sources:
Osaka Prefecture Travel Report 2000 (in Japanese only, 大 阪府全体の人の動き 第4回パーソントリップ調査から, Japan)
PARIS (Paris et Petite Couronne)
3 Population: 6.5 millionLand area: 762 km2 Mode share
Based on the number of journeys by main mode of transport. It includes all modes for all purposes. Mass transit constitutes 62% of all journeys.
Data Sources:
National Transport Survey 2008 (in French only, Enquête Nationale Transports et Déplacements)
Figure 17: Mode Share in Osaka
Figure 18: Mode Share in Paris et Petite Couronne
Others 6% Walk 39% Private transport 33% Rail 12% Bus 10% Walk 27% Private transport 39% Rail 32% Bus 2% Walk 4% Cycle 1% Private transport 32% Taxi 1% Public transport 62%
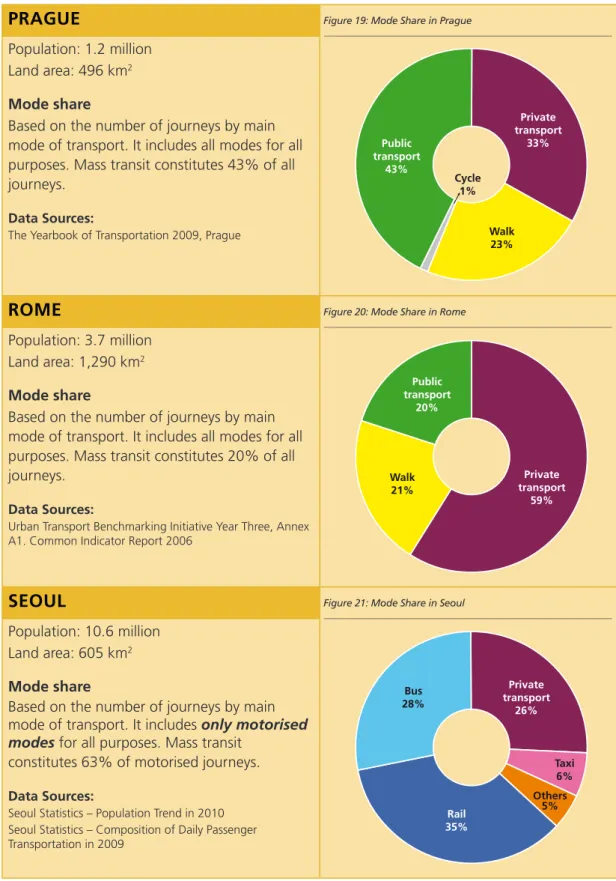
PRAGUE
Population: 1.2 million Land area: 496 km2 Mode share
Based on the number of journeys by main mode of transport. It includes all modes for all purposes. Mass transit constitutes 43% of all journeys.
Data Sources:
The Yearbook of Transportation 2009, Prague
Figure 19: Mode Share in Prague
ROME
Population: 3.7 million Land area: 1,290 km2 Mode share
Based on the number of journeys by main mode of transport. It includes all modes for all purposes. Mass transit constitutes 20% of all journeys.
Data Sources:
Urban Transport Benchmarking Initiative Year Three, Annex A1. Common Indicator Report 2006
SEOUL
Population: 10.6 million Land area: 605 km2 Mode share
Based on the number of journeys by main mode of transport. It includes only motorised modes for all purposes. Mass transit
constitutes 63% of motorised journeys.
Data Sources:
Seoul Statistics – Population Trend in 2010 Seoul Statistics – Composition of Daily Passenger Transportation in 2009
Figure 20: Mode Share in Rome
Figure 21: Mode Share in Seoul
Walk 23% Cycle 1% Private transport 33% Public transport 43% Walk 21% Private transport 59% Public transport 20% Others 5% Private transport 26% Taxi 6% Rail 35% Bus 28%
SHANGHAI
4 Population: 16.4 million Land area: 2,141 km2 Mode shareBased on the number of journeys by main mode of transport. It includes all modes for all purposes. Mass transit constitutes 33% of all journeys.
Data Sources:
Shanghai Yearbook 2011
Shanghai Construction and Transport Commission 2009 (data provided directly)
Figure 22: Mode Share in Shanghai
SINGAPORE
Population: 5.1 million Land area: 712 km2 Mode shareBased on the number of journeys by main mode of transport. It includes all modes for all purposes. Mass transit constitutes 44% of all journeys.
Data Sources:
Singapore in Figures 2011
Travel Survey 2011, Land Transport Authority, Singapore
SYDNEY
Population: 4.6 million Land area: 1,580 km2 Mode share
Based on the number of journeys by main mode of transport. It includes all modes for all purposes. Mass transit constitutes 11% of all journeys.
Data Sources:
2009/10 Household Travel Survey-Key Indicators for Sydney
Figure 23: Mode share in Singapore
Figure 24: Mode Share in Sydney
Walk 22% Cycle 1% Private transport 29% Taxi 4% Rail 19% Bus 25% Others 2% Walk 18% Private transport 69% Rail 5% Bus 6% Private transport 20% Walk 27% Cycle 10% E-bike 10% Public transport 33%
TAIPEI
Population: 2.6 million Land area: 272 km2 Mode share
Based on the number of journeys by main mode of transport. It includes all modes for all purposes. Mass transit constitutes 32% of all journeys.
Data Sources:
Taipei Yearbook 2010, Taipei City Government, Taiwan Analysis of Taiwan Transport Modes (in Chinese only, 臺 灣地區相關運具使用率指標 簡析及探討)2009. MOTC , Taiwan
Figure 25: Mode Share in Taipei
TOKYO (23-Ward)
5Population: 8.8 million Land area: 622 km2 Mode share
Based on the number of journeys by main mode of transport. It includes all modes for all purposes. Mass transit constitutes 51% of all journeys.
Data Sources:
Tokyo Statistical Yearbook 2009, Japan
Tokyo Metropolitan Area Travel Survey 2008 (in Japanese only, 東京都市圏パーソントリップ調査(交通実態調査) 平成20年, Japan)
TORONTO
Population: 2.4 million Land area: 630 km2 Mode shareBased on the number of journeys by main mode of transport. It includes all modes for all purposes. Mass transit constitutes 24% of all journeys.
Data Sources:
2006 Transportation Tomorrow Survey
Figure 26: Mode share in Tokyo 23-Ward
Figure 27: Mode Share in Toronto Others 1% Walk 15% Cycle 4% Private transport 46% Taxi 2% Rail 14% Bus 18% Walk 23% Cycle 14% Private transport 12% Rail 48% Bus 3% Others 1% Cycle & Walk 8% Private transport 67% GO Train 2% Local Transit 22%
VIENNA
Population: 1.6 million Land area: 415 km2 Mode share
Based on the number of journeys by main mode of transport. It includes all modes for all purposes. Mass transit constitutes 36% of all journeys.
Data Sources:
Vienna Modal Split 2010 (in German only, APA-Grafik Modal Split, Wiener)
Figure 28: Mode Share in Vienna
Notes
1. For Beijing, this includes the traditional urban area, which is only part of the area administered by the Beijing Municipality.
2. For Guangzhou, this includes the central districts (i.e. Liwan, Yuexiu, Haizhu, Tianhe, Baiyun, Huangpu) only, which is only part of the area administered by the Guangzhou Municipality.
3. For Paris, this includes the city of Paris and the surrounding districts collectively called “Petite Couronne” (Little Crown, or Inner Ring): Hauts-de-Seine, Seine-Saint-Denis and Val-de-Marne.
4. For Shanghai, this includes the traditional urban area and the Pudong New District, which is only part of the area administered by the Shanghai Municipality. 5. For Tokyo, this includes the traditional urban area
collectively called “23-Ward”, which is only part of the area administered by the Tokyo Metropolitan Government (TMG). Walk 28% Cycle 5% Private transport 31% Public transport 36%