A
Workers' Compensation
Claim
Population
for
Occupational Asthma*
Comparison of
Subgroups
Susan M. Tarlo, MBBS, FCCP; Gary Liss, MD; Paul Corey, PhD; andIrvin Broder, MD
Study objectives: (1) To compare patientswith claims submittedtotheOntarioWorkers'CompensationBoard
(WCB)foroccupational asthma,inrelationtotheWCB
decisions reached ofoccupational asthma (OA);
aggra-vationofasthmafromirritantexposures(AA);unrelated asthma; no asthma; and (2) to assess determinants of
outcomeofWCBaccepted claimsatpermanent
disabil-ity assessments.
Design: A retrospective reviewof609claims submitted to theWCB 1984to 1988.
Results: TheWCBdecisionreached wasOAin39% of
claims,mostlyattributedto isocyanates(57% ofthese).
A further 39% were accepted for AA. Exposure to a
known sensitizer occurred in91% with OA andto an
irritant in 67% with AA. Fortypercent with AA were
attributedtoaspilloraccidentalexposureand68%had preceding asthma. Those with AAwere more likelyto
have clearing of symptoms by the time of their main assessment(43%vs20%with OA) andweremorelikely
tohave remained inthe same work (35%vs 20%with
Claims accepted for occupational asthma (OA)
have been increasing over several years in
On-tarioandnowoutnumberclaims forpneumoconiosis.
In 1982, 17claims were accepted for OA,30for
sil-icosis, and 12 for asbestosis while in the year 1985, there were 54for OA, 33for silicosis, and20for as-bestosis. Similar increases have been reported from Quebec where claims accepted forOArosefrom6in
1977 to 97 in 1987.1
We have recently reported the results of
assess-mentsforOAinpatientsreferredtooneoccupational lung diseasecenterinOntario.2However, lessthana
quarter of all Ontario claimants were seen in that
center, and the findings could differ from those amongallcompensationclaims forOAasthmatothe
Ontario Workers' Compensation Board (Ontario
*From the Gage Research Institute, Department of Medicine,
Universityof Toronto(Drs. Tarlo, CoreyandBroder),and
On-tarioMinistry of Labour(Dr. Liss), Toronto, Ontario, Canada. Thisstudywassupported by the Ontario Workers'
Compensa-tionBoard.
ManuscriptreceivedNovember24, 1993;revisionaccepted
Au-gust16, 1994.
Reprint requests: Dr. Tarlo, Gage Research Institute, 223 College Street, Toronto, Ontario MST 1R4 Canada
OA).Of200OAacceptedclaims reviewedatameanof
1.9yearslater, clearing of asthma occurredin19% and milder asthma in 47%. Outcome was best with early
diagnosis (p<0.05), and milder impairment of pulmo-naryfunction at initial assessment (p<0.05).
Conclusions: Patientswith asthma inducedbya
work-place sensitizer demonstrate some differences from those relatedto workplace irritants. Accurate categori-zationandearlyremoval ofthose with OA offers the best
prognosis. (Chest 1995;107:634-41)
Key words: occupational asthma; compensation; asthma; outcome
WCB). In addition, the routine follow-up by the
WCB of accepted claims for disability rating could allow assessment of outcome variables.
Previousstudies ofprognosisinOAhavegenerally been restricted to groups with asthma caused by a single sensitizer, such as Western red cedar3 or isocyanates.4-7 Few studies have included multiple causativeagents.8'9 With the exception of the study of Chan-Yeung et a13 of 232 redcedar workers, fol-low-upreportshaveincludedrelatively smallgroups of subjects. The present study describes diagnostic
categoriesandoutcomevariablesinarelatively large population of subjects with OAfrom manydifferent
causative agents.
MATERIAL AND METHODS
Claims submittedforOAsincemid-1984tothe OntarioWCB
havebeen givenadecisionof(1) OA, (2)aggravationofasthma
(c)unrelatedasthma,or(d)otherdecision.Thetermaggravation of asthma(AA)wasgenerally applied by the WCBtoasthma that
occurredatwork,eitherwith ahistory of preceding asthmaor,
inthose withnoknownpreviousasthma,inthe absence ofa
spe-cific sensitizer. This includedincreasedairway reactivity
appar-ently triggered by irritantfactors insubjects with no previous
knownasthma. TheWCBgenerally provided alowerrangeof
compensation for those givenadecision ofAAthantothose with OA.
AA=aggravationofasthma; FEF50=forcedexpiratoryflow
at 50% vitalcapacity; FEF75=forced expiratory flow at
75%vitalcapacity;FEV,=forcedexpiratoryvolumein1s;
OA=occupational asthma; PC20=provocation
concentra-tioncausing a20% fallinFEV1; WCB=OntarioWorkers'
The WCBdecision was initially reachedby one of three
occu-pational physicians at the WCB with a majorinterest in OA, of-tenwith the aid of an independent specialized assessment. The initial decision was subjectto appeal to the WCB and if further
rejected, could be appealed through the Workers Compensation
Appeal Tribunal, consisting of a nonmedicalpanel. Thus, the
fi-nal WCB decision could be reached at any of these stages and would not necessarily reflect the non-WCB physician diagnosis. Fileswere reviewed of all claims for OA submitted to the WCB between mid-1984 and mid-1988 inclusive. From each file a standardized format was completed, from the most detailed as-sessments prior toandafter the WCBdecision (referredto
sub-sequently as the assessment of the main assessing physician). The following information was abstracted: (1) demographic details, including age, gender, smoking history, type and durationofwork exposure,and work status at the time of assessment; (2)natureand duration of upper and lower respiratory tract symptoms, im-provement ondays or weeks off work, and timing of any wors-ening at work; (3) history of anyprevious asthmasymptoms be-foreimplicated work exposure, and family history of asthma or allergic diseases; (4) medication requirements; (5) results of investigations ifperformed such as pulmonary function tests (ex-pressed as percent of age and height adjusted predicted normal
values'0),andresponse toabronchodilator; histamine or meth-acholine challenge expressed as PC20 (provocation concentration causing a 20%fallinFEVI);skin testresponses tocommon aller-gen extracts and specific workplace antigens, expressed where available from the mean wheal diameter as 1+ (1 to 2mm on prick test or .5mmon intradermaltest), 2+ (3 to 5mmonprick testor 6 to 9 mm onintradermal test), 3+ (6 to 9mmonprick testor >10 mm onintradermal test),4+(>10 mm on prick test
or .10mm with pseudopods on intradermal test); serial peak flow assessments at work and off work expressed as positive or negativeforwork-related changes as interpreted by the main as-sessingphysician;serial histamineormethacholinechallenge
re-sults within 48 h ofatypical working day and after7daysormore
off work; andspecific laboratory chamber challenge witha
sus-pected workplace agent; (6) the clinical diagnosis made by the main assessing physician after completion of any arranged investigations, and the WCB diagnostic decision; and (7) fol-low-up results obtained1 to 2yearslater, including work status, symptoms, medication requirements, and pulmonary function results.
Theamountof objective investigation could vary widely from physical examination alone, to performance of full pulmonary function tests with assessment of airway reactivity by histamine
or methacholine challenge, serialpeakflow measurements, spe-cific work allergen skin tests, and specificinhalation challenge.
Sincethese tests wereperformedinmanydifferentcentersunder the direction of manyphysicians, themethodology of thesetests wasnot uniform. That used in our center, where 19% of this
population had beenassessed,has been describedpreviously.2No
uniform criteria wereappliedtotheinterpretation of serialpeak flowmeasurements in thisstudy,sincetheoriginalreadingswere not always available. Therefore, the peak flow interpretation reached bythe attending physician wasaccepted as recorded. Methacholine and histamine responsivenessareexpressedasPC20 and are used in theanalysesasactual values or areseparatedinto
PC20responses greateror lessthan12mg/mL, whichistakenin
thisstudyasthecutoff foranormal response.
Follow-up assessmentswereperformedfordisability decisions
in all subjects whose claims were accepted for OAand AA if asthma was present at the initial assessment. The follow-up
assessmentfordisability rating wasgenerallyperformed 1 to2 years after theinitial WCB decision. The medicalreassessment wasperformed either byoneof the threeWCBphysiciansor a
respirologist selected by theWCB.
Statistical Analysis
Thegeneral linear models procedure(GLM of SAS) was used for analysis ofvariance, t test for Student's t tests, and FREQ for
x2analyses.Sinceinformation availableinthefileswasnot
com-plete for all patients, missing data were excluded from calcula-tions ofpercentages and from statistical analyses.
RESULTS
Total Group
Atotal of 609 files was reviewed from the 4-year
period. A diagnosis/decision of OA was reached in about one third of subjects both by the physician
(35%) and the WCB (39%). A similar proportion (39%) was given adecision by the WCB of AA, and a diagnosis of this by the main assessing physician
(34%).
Of thosewith a WCB decision ofAA, 68% had ahistory ofpreceding asthma. Unrelatedasthma was diagnosed in 6% of the total group by the physicianand10% were giventhis decisionby the WCB while otherdiagnoseswerereachedby the physician in 11% and otherdiagnosesordecisions by the WCB in 13%.
Insufficient informationwas theconclusion in 12% of claims by the assessing physician.
Overall, 40% of claims were assessed by one or more of eight non-WCB physicians with a known interest in OA, including 59% of those with a final diagnosisofOAand 66%withunrelatedasthma, but
only22% ofthosewith AA. A further 40%of the
to-tal number ofpatients wereassessedby other
respirol-ogists orallergists,2%by otherinternists, and 15%by
their primary carephysician or an emergency phy-sician alone.
Themostcommonexposure agents (Table1) were isocyanates(28%).Paintswereimplicatedas the most
likelycausative agent in 5.5% of claims while metal
fumes or dusts,
flour,
grain dusts, and solvents eachaccounted for 4% of all claims. Recognized sensitiz-ers such as cedar dust (3%), animals (2%), and
soldering fumes (1%)were lesscommon.
Specific
ir-ritants such as acids and welding fumes were also
eachimplicatedin2% orlessof all claims.In 17% of
subjects,
nonspecified
dusts, fumes, or sprays wereimplicated;60%of these weresubjects given a WCB decision of AA.
As might be expectedin apopulation assessed by
many different physicians,where most workers had
left the implicated environment, and many were
symptom free, further investigations were limited
(Table 2). Spirometric tests were
performed
in only52% of all subjects and mean values were normal.
Serialpeak flowrateswere
performed
atworkand off work by 25%, methacholine or histamine challenge offwork in34%,andduring a workingweek in23%(both
off work and during aworking week in12%).
A
specific
work allergen skin test wasperformed
in12% and
specific
laboratory
challenge
with a workTable 1-Main Implicated Exposure Agents in WCB Decision Groups*
Unrelated
OA AA Asthma Other Total No. ofsubjects 235 234 58 82 609
Primarily sensitizing agents
Isocyanates 135 19 4 13 171 Flour 17 4 2 3 26 Metalfumes/dusts 11 6 2 6 25 Red cedar 11 0 1 0 12 Grain 9 8 0 5 22 Solderingfumes 5 2 0 0 7 Acrylicfumes 5 2 0 0 7 Woods (noncedar) 3 8 3 2 16 Amines 3 1 1 1 6 Enzymes 3 1 0 0 4 Latex 3 2 1 0 6 Animals 2 9 2 1 14
Primarilyirritantagents
Paint fumes 1 22 5 6 34 Solvents 3 11 4 5 23 Calcium oxide 1 9 2 0 12 Sulfuricacid/SO2 2 8 1 4 15 Hydrochloric acid/Cl 0 9 0 2 11 Ammonia 0 7 1 1 9 Cigarette smoke 0 7 5 2 14 Glutaraldehyde 1 6 0 1 8 Welding fumes 2 5 4 2 13
*Other agentseachimplicatedinone or twosubjectswithOAincludepsyllium, platinumsalts,insects,foods, plants,anddyes.Other agents each implicatedinfourorlesssubjects withAAinclude ozone,pesticides, fungi,cottonfibers,cold air, and oilmists.Unspecified dusts, fumes,or
sprayswere implicatedin anadditional64subjects withAA.
Table2-Investigations byWCB Decision Group Unrelated
OA AA Asthma Other Total pValue*
No. 235 234 58 82 609
Skintestspositive 77/154 94/136 27/46 43/57 241/393 <0.01
>1 commonallergen (50%) (69%) (59%) (75%) (61%)
(>2+response)
Skintestspositive 31/41 14/20 4/7 4/8 53/76 NS
toworkagent (76%) (70%) (57%) (50%) (70%) (-1+response) FEVI, % predicted 98+26t 88+28 83+35 91+29 93 ±28 0.01 No. assessed 168 83 25 41 317 FVC 105±22 99+23 87+ 21 97+ 24 101±23 <0.005 No. assessed 169 84 25 40 318 FEF50 79±38 68±40 84±45 83±48 77±40 NS No. assessed 123 63 16 24 226 FEF75 72±49 65 + 47 78 + 63 65+34 69 + 48 NS No. assessed 124 60 17 24 225 Peak flows 56/94 14/34 1/11 1/13 72/152 <0.005 supporting OA (60%) (41%) (9%) (8%) (47%) PC20off work4 10.6±15 9+14 6.8+6.8 13.5±13 10.3±14.3 NS No. assessed 132 42 11 21 206 PC20atwork 4.7+±10 4.8± 11 11.4±12.6 9.4±6.1 5.5±10.7 NS No. assessed 84 37 11 10 142
Laboratory challenge positive 33/43 4/8 0/6 0/6 38/63 0.01
(77%) (50%) (0%) (0%) (60%)
PC20prechallenge 10.9+±18 16.8±31 7.2+2 6.0 11.2+±18 NS
No. assessed 14 4 3 1 22
PC20postchallenge 5.1+9 5.0+ 7 7.5+6 6.0 5.6+6 NS
No. assessed 13 3 4 1 21
*p values relatetosubgroups excluding the total group.
fStandarddeviation.
Table3-Comparison ofPatients AccordingtoWCB Decision: Demographics
Unrelated
OA AA Asthma Other Total pValue
Value* No. 235 234 58 82 609 Mean age, yr 40+13t 41±12 42±12 44±13 41+12 NS Male, % 69 65 69 51 65 NS Neversmoked, % 32 39 43 35 29 NS Currentsmokers,% 27 25 18 23 21 NS
Meanpack-yrofsmokers 14+15 15±12 16±17 22 ±22 15 ±15 NS
History ofprevious asthma, % 8 68 46 27 35 <0.0001
Yearssince onsetof previous asthma 18.0+13 17.6±14 18.7+15 21.1±18 18.1±14 NS
Familyhistoryof asthma, % 15 29 28 31 24 <0.01
*pvalues relatetocomparisonsofsubgroupsexcluding the totalgroup. tStandard deviation.
agent in 10%. Support for a diagnosis of OA came ing holidays (Table 4). However, 63% had left work from results of peak flow studies in 12% of the total by the time of the main physician
assessment,
andstudy population (47% ofthoseperformingthe test), 20% had no continuing symptoms. Ninety-one
per-from repeated methacholine or histamine challenge cent wereassessed by a specialist physician(allergist,
at work and off work in 5% (54% of those
tested),
respirologist, or occupational physician).specific skin tests in 8% (70% of those tested), and Exposure to a known sensitizing agent was
de-specific laboratory challenge in 6% (60% of those scribed in 91%, exposure to a presumed irritant in7%,
tested). and to unknown agents in 2%. The most commonly
OccupationalAsthma implicated exposure agentwasisocyanates (Table 1)
Occupational Asthma in
57%
of subjects. In addition tospirometry,
meth-Among the 235 patients who were given a WCB acholine or histamine challenge was performed
decisionofOA, the mean age was 40years, and 69% within 48 h of a work day in 36% of those withOA, weremen(Table3).One third had neversmoked. All and off work in 56% (Table 2), while the challenge describedasthmasymptoms and80%with available was performed both after a work day and off work
information also hadnasal symptoms,although 40% in 22%. Serial peak flow readings were assessed in
of files did not mention their presence or absence. 40% and specific skin tests to a work agent in 17%. Seventy percent had a history of improvement in Specific challenges in the laboratory with a work
symptomsduring weekendsoff work, and 88% dur- agent were performed in 18%. Table 4-Work-RelatedData inWCB Decision Groups
Unrelated p
OA AA Asthma Other Total Value*
No. 235 234 58 82 609 Yearsofsymptoms 2.8±4.2t 1.2 ±2.6 3.1± 4.3 2.5+4.8 2.2+3.8 <0.0001 atwork Yearsofsymptoms 2.8±4.3 1.3±3.0 3.6±5.3 2.7±4.9 2.3+4.0 <0.0001 before WCBsubmission Yearsofsymptoms 3.1± 4.4 1.4± 2.8 3.9±5.4 2.7±4.9 2.5+4.0 <0.0001
beforemain assessment
Exposure yearstowork 6.8+7.6 7.4±8.1 8±8.1 8.2+9.4 7.3+8 NS
agent
Improvement onweekends, % 70 65 41 48 55 <0.0001
Improvementonholidays, % 88 81 54 69 73 <0.0001
Leftwork, % 63 42 62 71 56 <0.0001
Samework,% 20 35 22 17 26 <0.0005
Outof usualexposure 15 17 9 4 17 <0.05
butatworkplace, %
Asymptomaticat 20 43 14 24 28 <0.0001
mainassessment, So
Asymptomaticand 19 24 11 17 19 <0.01
outof workarea, %
*pvalues relatetocomparisonsof subgroupsexcludingthe totalgroup.
tStandard deviation.
Aggravation of Asthma and Comparisons With
OA
Theonlydemographicfeatures(Table 3) that were significantly different between those with AA and OA were thehistory of previous asthma (68% of those with AA vs 8% of those with OA), and the family
history of asthma (29% of those with AA vs 15% of
those withOA). Clearing ofpreviousasthmaprior to the onset of work-attributedsymptoms was reported in only 19 of the 150 (12%) with AA and preceding asthma, while among the 18 with previous asthma whose claims were accepted as OA, 12 (67%) had clearing of their asthma prior to the onset of work-related symptoms, for a mean of 5.5 years (data not shown in tables).
As might be expected, there was a high level of
concordanceamong the main assessingphysicianand WCBforthediagnosisof AA with ahistoryofasthma (91%) and OA without previous asthma (87%). The
concordance was less for a diagnosis of AA, when
there was no history of asthma (71%) and for OA when therewas ahistory of precedingasthma (72%) (data not shown intables).
Symptoms, medication use,and physicalfindings
ofwheezingweresimilarinprevalence to those with OA, when recorded in the patient file (data not
shown). Therewas a similar prevalence of improve-mentduringweekends and holidays as in those with OA (Table 4). Althoughthe duration of exposure to theimplicated work agent was similar to those with OA, the duration ofwork-attributed symptoms was
less in those with AA than in those with OA (at the time of main assessment, 1.4 years vs 3.1 years).
Thosewith AA weresignificantlylesslikely to have
had exposure to isocyanates than those with OA (Table 1),and were more likely tohave exposure to agents other than the most commonly recognized sensitizers(Table 1). Exposure to a known respiratory irritant (most commonly paints, solvents, acids, am-monia, or calcium oxide) occurred in 67%. An
acci-dentalexposureor
spill
wasreported
in40%.Among thosewithAAandnohistory
of asthma(70 patients),
exposure agentswere
mainly
agentsconsideredtobe irritant such as acids, solvents,welding
fumes,
and nonorganic dusts (Table 5), although 34% of thesesubjects hadexposureto
potential
sensitizerssuchasisocyanates, eggs,
flour,
andmetal dustsorfumes. Allobjectivediagnostictests were
performed
inasmaller proportion of patients withAAthan OA. When these tests were performed, however, resultswere notsig-nificantly different from those with OA.
Unrelated Asthma, and Comparisons With OA
and AA
The 58 patients who were classified
by
the WCBas having unrelated asthma were not significantly
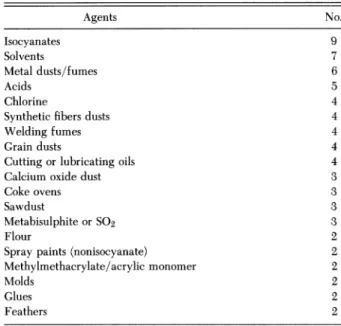
Table5-Exposure Agents inThose With a WCB Decisionof AggravationWho Had NoHistoryof
Asthma (70 Patients)* Agents No. Isocyanates 9 Solvents 7 Metaldusts/fumes 6 Acids 5 Chlorine 4
Syntheticfibers dusts 4
Weldingfumes 4
Grain dusts 4
Cutting orlubricatingoils 4
Calcium oxide dust 3
Cokeovens 3
Sawdust 3
MetabisulphiteorSo2 3
Flour 2
Spray paints (nonisocyanate) 2
Methylmethacrylate/acrylic monomer 2
Molds 2
Glues 2
Feathers 2
*Agentsinsinglecasesonly: ammonia,fur, leather, dusts, printing fumes, cinaminic alcohol, fiberglass, eggs, tobacco smoke, urea
formaldehyde insulation, epoxy resins.
different in demographic findings from those with OA or AA (Table 3) except for their history of pre-viousasthma.They didnotdiffereither insymptoms or physical findings of wheezing. They did have a
longerdurationof symptoms at work (Table4),and were less likely to be asymptomatic by the time of assessment. Theywere significantly less likelyto
de-scribe improvement in symptoms on weekends(41 %) or holidays (54%) (Table 4). Exposure to the most commonOA sensitizer, isocyanates, was less common inthosewith unrelated asthma (Table 1), and these patients were more likely to have unspecified expo-sures orexposure to agentsother than themost com-mon agentsinducing OA.
As with patients classified as having AA, investi-gations were lesscommonly performedthan among those with OA;but whenperformed,as expected, the test results were more likely to be normal or not supportiveofanoccupationalcomponentthanamong patientswithOA or AA.Airflowlimitation as assessed
by spirometry showed more marked reduction in
forced expiratory volume in 1 s (FEV1) and forced vital capacity (FVC) among those with unrelated asthma. There was nosignificant differenceinmean values forflowrates at 50% and 75%ofvital capacity.
Follow-up Results
Follow-up assessment had been performed for the purpose ofdisability rating in 285 of the 469 accepted claims for OA and AA (69%). Only 46% of these pa-tients wereworking atfollow-up,8%doing the same
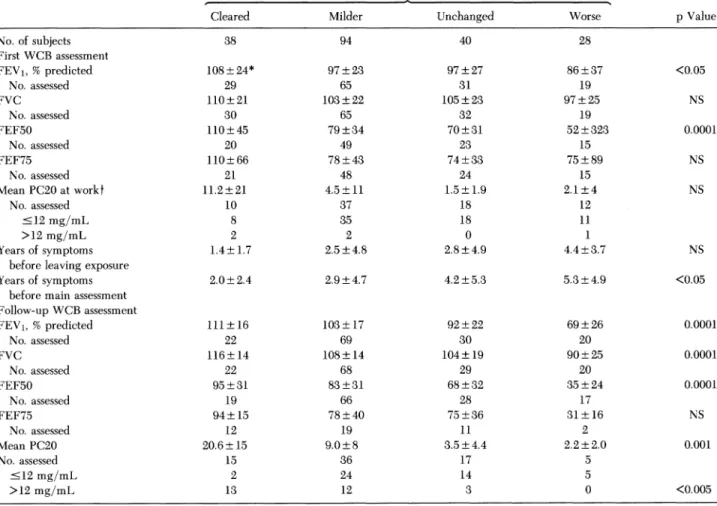
Table6-Patient Variables Relatedto Outcomeof Accepted Claimsin 200 PatientsWithOA StatusasRated byExaminingPhysicianatFollow-up
Cleared Milder Unchanged Worse pValue
No.ofsubjects 38 94 40 28 First WCB assessment FEV1, %predicted 108+24* 97 ±23 97 ±27 86±37 <0.05 No.assessed 29 65 31 19 FVC 110+21 103±22 105±23 97±25 NS No. assessed 30 65 32 19 FEF50 110± 45 79 ±34 70± 31 52+323 0.0001 No. assessed 20 49 23 15 FEF75 110±66 78±43 74+33 75±89 NS No.assessed 21 48 24 15 MeanPC20atworkt 11.2+21 4.5± 11 1.5±1.9 2.1±4 NS No. assessed 10 37 18 12 '12mg/mL 8 35 18 11 >12mg/mL 2 2 0 1 Yearsofsymptoms 1.4+ 1.7 2.5±4.8 2.8 ±4.9 4.4±3.7 NS
beforeleavingexposure
Yearsof symptoms 2.0+2.4 2.9 + 4.7 4.2 ±5.3 5.3+4.9 <0.05
beforemain assessment
Follow-upWCB assessment FEV1, %predicted 111±16 103+±17 92+22 69+26 0.0001 No. assessed 22 69 30 20 FVC 116+14 108±14 104±19 90±25 0.0001 No. assessed 22 68 29 20 FEF50 95+31 83+31 68 + 32 35+24 0.0001 No. assessed 19 66 28 17 FEF75 94+15 78 ± 40 75 ±36 31+16 NS No. assessed 12 19 11 2 Mean PC20 20.6±15 9.0±8 3.5±4.4 2.2±2.0 0.001 No. assessed 15 36 17 5 <12mg/mL 2 24 14 5 >12mg/mL 13 12 3 0 <0.005 *Standard deviation. tMethacholineorhistaminePC20, mg/mL.
up (70%)werethose whoseclaims were
accepted
forOA. Asthma hadcleared in 19% with OA, was
clin-ically considered milder in47%,
unchanged
in 20%,and worse in 14% in the opinion of the assessing
physician. The mean duration since the first assess-ment was 1.9±1.5years.
Pulmonary
functiontesting at follow-up (Table 6)paralleled
the outcomefind-ings, with worse asthma associated with greater
im-pairment of function.
Twovariables were associatedwiththeoutcomeof OA.First, theduration ofsymptomspriortothemain
assessment was
directly
related to the outcome(Ta-ble
6).
This was indicatedby
the duration rangingfromameanof2.0±2.4yearsinthosewith
clearing,
to 5.3±4.9yearsinthose withworsening of asthma.
Second,
thepulmonary
function status at the initial assessment showed a similar direct association with the status of the worker's asthma atfollow-up.
Forexample,anFEV1meanof 108±24%
predicted
wasinitially present in those with subsequent clearing,
and 86±37% in thosewith worsening asthma.
Sim-ilarly the initial assessment mean methacholine or
histamine PC20,
although
measuredin aminorityofsubjects
whileworking, ranged
from a mean of11.2±21
mg/mL
in those whocleared,
down to a meanof2.1±4mg/mL
inthose who had worseningof asthma on
follow-up.
Greater improvement was found in those with a WCBdecisionofOAthaninthose withAA
(data
not shown intables).
Among those with OA, 20% hadclearing
of asthma and 46% were mildervs 7% and30%,
respectively,
with AA. Fewer with AA had afollow-up
assessment(85
subjects),
butanalyses
oftheseshowedatrendtosimilaroutcomeassociations. In
addition,
prognosis for those with asthma attrib-uted to isocyanates was better than for those with other causes of OA.Clearing
of asthma occurred in 20% and improvement occurred in afurther 52% of those with isocyanate OA, ascompared
with 16%and 32%,
respectively,
in those with other causes(p<0.05).
This may reflect an earlierdiagnosis
of awell-recognized
sensitizer. DISCUSSIONThis survey reflects the claims received
by
theOntario WCB for
suspected
work-relatedasthma,
andmay not
necessarily
reflect the true Ontario in-cidence or distribution ofcausativeagents in thetimeperiodassessed,sincemany patientswithOAmaynot
be reported to the WCB or be
eligible
to submit a claim. Our categorization ofpatientsinto diagnostic groups has been on the basis of the WCB decision, stemminglargely
from themainphysician
assessment. WerecognizethattheWCBdecision mayattimesbe different from that which mightbereached
by
aphysician
specializing
in OA.However, there wasgood agreement betweendiagnoses reachedby
the WCBand the main assessing
physician,
and when resultswere analyzed using the physician
diagnosis
instead of the WCBdiagnosis,
thefindings
were substan-tively the same. We electedto usetheWCBdecision since it was reachedby
agroup of three physiciansat the WCB and thus maybe more consistent.
Objective investigations were not
performed
inmanysubjects, possibly duetolimitationspreviously
described,2
suchasdifficulty
inarranging workplace peakflowassessmentsandmethacholine
challengeinsubjects who had terminated their employment by
the time of main assessment (56% of all patients). Wherethereisinsufficient information or testsshow
borderlineresponses,thebenefitof thedoubtisgiven
by the WCB toward a diagnosis of OA or AA.
Therefore, no strict diagnostic criteria could be
appliedtobettercategorize thesesubjects,andthere
likelywere somepatients whodidnottruly belongin
the
diagnostic
category giventothem.
Therefore, this study cannotbedirectly
compared withstudies per-formed in a single center, using a standardizedapproach.2-7 Nevertheless,
it is of interestthat manyofthe
findings
inthisstudyare consistent withthese otherreports.2-7
Itis unlikely that the outcomecate-gories were
significantly
influenced by inaccurate diagnosesinone decision group more thanotherde-cisiongroupssincethepercentage of patientsineach ofthe
follow-up
outcomecategories who hadobjec-tiveconfirmation ofOA wassimilar (data notshown).
Some misclassification of claim decisions might have resulted from nonmedical decisions made
dur-ing appeals proceedings. The presence of misclassi-fication isfurther suggestedby thefinding of an
ap-parently positive
challenge
to known sensitizers inthree patients with AA, with
flour,
isocyanates, or cobalt.Compensation for AA and acute airway irritant
effectsis not
uniformly
acceptedanddoesnotoccur,forexample, in Quebec or in Britain under the
cat-egory of
OA.""1
Aproposedmedicolegal
definitionof OA from an author in the UnitedStates12
also includes only specificsensitizing agents. Thesubjects includedinthediagnosticcategoryofaggravationin Ontario have beenseparately classified from OA forthe purpose of compensation. They can be divided
intothose withandwithout
preceding
known asthma and subdivided intosubjects
with exposure toun-usually
high
levelsofpotential
irritantsubstances andsubjects exposed
tocurrently
acceptable
levels. Twothirdsof
patients
inthisaccepted
claim category ofAA had known
preceding
asthma,
which worsenedwhile
working
withpotential
airway irritants,suchasacid fumes or
aerosols,
ammonia,chlorine, paint
fumes, solvents,
orirritantdusts. Theremainingonethird had no
previous
documentedasthma,
andde-veloped
changes
of asthma whileworking
with no sensitizerexposureordidnotdemonstratesensitivity
toknownsensitizers. Thisincluded patientswithac-cidentalexposure toa
high-dose
irritantorrepeated
exposure to irritants with no
single high
concentra-tion
incident,
such as has been describedprevious-ly.13"14
Therefore,
aproportionofthesepatients mayhave had asthma induced
by
their work exposurewhileothersmayhave had coincidentalonsetofasthma withirritant exacerbation
by
workplace
substances.ThosewithAAwereless
likely
thanthosewithOAtohaveexposuretothemainrecognizedsensitizerin
Ontario,
isocyanates
(1l1%
vs58%) (Table 1),
had ashorter mean duration of symptoms before WCB
submission and main assessment
(1.2
years vs 2.8years) (Table 4),
andthey
were morelikely
to beasymptomatic
by
thetimeof main assessment(43%
vs
20%).
This greaterclearing
of symptoms inpatients
withAAmayreflecta proportionofsubjects
with transient symptoms related to
spills
or tempo-rary exposures to irritant substances. This issup-ported
by
thefinding
thatamongthosewith AA,35%remainedinthesameworkenvironment
by
thetimeoftheir main assessmentbut morethanhalf(52% of
those still at the same
work)
reported a clearing of work-related symptoms. In contrast, of those withOA,
only
20%remainedatthesameworkby
thetime oftheirmainassessment,andonly
3(7%)
ofthosestillat the same work
reported
clearing
ofwork-attrib-uted symptoms.
The greater
prevalence
of transient symptoms inthose withAA
might
alsoexplain
the fact thatfewerof those withAA were referred fortertiary
special-ist assessment, and fewer underwent detailedinves-tigation
(Table 2)
such aspeak
flow assessments,measurementofairwayreactivity, andskintestingor
challenge
withworkplace substances.
When thesetestswere
performed, however,
resultswerenotsig-nificantly
different from those with OA (Table2),
suggesting thatat least a subsetmayhave had simi-lar functional
changes
to those with OA. They maynot have been classified
by
the WCB ashaving OAdue to
preceding
asthma(150
patients classified asAA had a
history
of asthma and 14 had a question-ablehistory)
or lack of a recognized workplace sen-sitizer. These observations support the concept ofproviding some degree of compensation for such patients and the need for detailed investigation of these patients when feasible.
InOntario in the time period studied, isocyanates were themostcommonly identified suspect agents in allthe claims (30%) and the most commoncausative
agent in claims accepted for OA (58%) (Table 1). They werealso a significant attributed cause of irri-tant airway responses (11% of AA). This represents a
higher proportion of OA than compensated or
re-ported to the SWORD surveillance system in the United Kingdom in
1988.15
Conversely, flour and grain dustsaccounted forasimilar proportion ofOAaccepted claims in Britain and Ontario (18% and 17%,respectively), whileplatinum salts andsoldering flux accounted for higher proportions of
compen-sated cases in
Britain,11
possiblyreflectingdifferencesin occupational exposures.
Comparison ofthisstudywiththatof Yassi,'6 who reviewed earlier Ontario WCB claims from 1975 to 1981, isdifficult due to some differences in classifi-cation of accepted claims. However, our finding of
isocyanatesas the presumed causative agent in 58% of those with OA isfar greaterthan in theearlier re-view where isocyanates accounted for 27% of OA.
The proportion due to flour or grain is unchanged
(17% vs 18%). At follow-up, unemployment was
higherinthepresentstudy,54%o of those followedup ascompared with lessthan 40% in thepreviousstudy. Ofinterest, herfollow-up questionnaire, 2to 8years
after the WCB decision was reached, found 15% of subjectstobefreeof asthmasymptoms, similarto our
finding of 19%.
Theoutcome of asthmaamong all patients whose claims were accepted for OA and who were
reas-sessed was similar to previous
studies3,17-19
in thatclearing of asthma occurred inonly 19%,a meanof
1.9 years after the first assessment
(Table 6).
How-ever, anadditional47% had milder asthma. Amongsubjectswithimprovement andthose withclearingof
asthma,thepositivechange occurredat a meanof0.9
years, suggesting thatitisreasonable toperformthe assessment for permanent disability around 2 years after leaving work.Inthewholegroupat
follow-up,
theprognosis
appeared
tobeworst inthose withAAwho had no prior history of asthma; 48% of the 33
seen were worseat
follow-up
ascompared
with14%of those with OA and no prior history of asthma. Our
findings
oftheprognostic importanceofearly
diagnosisof OA andremoval from exposure,and the better prognosis in those with initial
relatively
mild pulmonary function impairment areconsistentwithfindingsof Chan-Yeung et
al3
in cedar workers andthe
findings
ofMappeta17 andPisati eta16 inisocy-anate-induced asthma,andextendtheir
findings
to alarger group of patients with OA from many more
causes than previously
reported.8'9
Further studies areneededtoassess whether earlyrecognitioncan bebest achieved by appropriate surveillance programs
in industries such as those using isocyanates that ac-count for mostcompensatedcases ofOA in Ontario.
ACKNOWLEDGMENT: Theauthors wish to thank Mary Har-purandJustinaGreene for data gathering and processing, and Dr. C.Smith andDr. P. Carrof the Ontario Workers'Compensation Boardfortheircooperation in this study as well as Kerrie Cheung
fortypingassistance.
REFERENCES
1 MaloJL.Compensationfor occupational asthmainQuebec.In:
Merchant JA, ed. Workshop on environmental and
occupa-tional asthma. Chest1990;98S:236S-239S
2 TarloSM, BroderI. Outcomeof assessment for occupational asthma. Chest 1991;100:329-35
3 Chan-YeungM, MacLean I,PaggiaroPL. Followupstudy of
232patients withoccupationalasthmacausedbyWesternred cedar(Thujaplicata).JAllergy Clin Immunol1987; 79:792-96 4 Paggiaro PL, Loi AM, Rossi0,etal. Follow upstudy ofpatients with respiratorydiseasedue totoluene diisocyanate(TDI). Clin Allergy1984; 14:463-69
5 LosewiczS, AssoufiBK,HawkinsR, etal.Outcomeof asthma inducedbyisocyanates. BrJDisChest 1987; 81:14-22 6 PisatiG, BaruffiniA,ZeddaS.Toluenediisocyanate induced
asthma:outcomeaccordingtopersistence orcessationof expo-sure. BrJInd Med 1993; 50:60-4
7 Mapp CE, Corona PC,DeMarzo N, et al.Persistentasthmadue toisocyanates. Am Rev Respir Dis 1988; 137:1326-29 8 VenablesKM, Davison KG,Newman-TaylorAJ.Consequences
ofoccupationalasthma. RespirMed 1989;83:437-40 9 HudsonP, Cartier A, Pineau L, etal. Follow-upof occupational
asthmacaused by crab and otheragents. JAllergyClin Immu-nol 1985; 76:682-88
10 Schoenberg JB,Beck GJ, Bouhuys A. Growth and decay of
pulmonary function in healthy blacks and whites. Respir
Physiol1978; 33:367-93
11 ReportbyIndustrialDiseaseSubcommittee ofIndustrial Inju-riesAdvisory CouncilonOccupationalAsthma.Departmentof Health and SocialSecurity. London:HMSO, 1981; 7-19 12 Smith DD. Medical-legal definition of occupationalasthma.
Chest1990; 98:1007-11
13 BrooksSM, Weiss MA, Bernstein IL. Reactive airways dys-functionsyndrome (RADS). Chest1985;88:376-84
14 Tarlo SM, Broder I. Irritant-induced occupational asthma. Chest1989; 96:297-300
15 MeredithSK,TaylorVM, McDonaldJC. Occupational respi-ratory disease in theUnited Kingdom 1989: areport to the British Thoracic Society and the Society of Occupational Medicine bythe SWORD project group. Br J IndMed 1991; 48:292-98
16 Yassi A. Health and socioeconomicconsequences of
occupa-tionalrespiratoryallergies: apilotstudyusingworkers' com-pensationdata. AmJ Ind Med 1988; 14:291-98
17 MaloJL, Cartier A,GhezzoH,etal.Patternsofimprovement
inspirometry,bronchialhyperresponsivenessandspecificIgE
antibody levels after cessation of exposure in occupational
asthmacaused by snow-crab processing. Am RevRespir Dis
1988; 136:807-12
18 RosenbergN, Garnier R,RousselinR,etal.Clinical and
socio-professionalfate of isocyanate induced asthma. ClinAllergy
1987; 17:55-61
19 Burge PS. Occupationalasthmainelectronicsworkerscaused bycolophony fumes: follow-up of affected workers. Thorax
1982;37:348-53