by Xiaoyun Zhou
A thesis proposal submitted to
the Faculty of Graduate Studies and Research in partial fulfillment of
the requirements for the degree of MASTER OF SCIENCE School of Computer Science
at
CARLETON UNIVERSITY
Ottawa, Ontario November, 2013
c
Table of Contents
List of Tables v List of Figures vi Abstract xi Acknowledgements xii Chapter 1 Introduction 1 1.1 Introduction . . . 1 1.2 Motivation . . . 21.3 Statement of the Problem . . . 3
1.4 Contributions . . . 4
1.5 Organization of Thesis . . . 5
Chapter 2 Background 6 2.1 Introduction . . . 6
2.2 Business Intelligence and OLAP . . . 6
2.2.1 Introduction to Business Intelligence . . . 6
2.2.2 OLAP and data cube . . . 8
2.2.3 Real-time OLAP . . . 11
2.3 Parallel computing and big data processing . . . 11
2.3.1 Introduction to parallel computing and its advantages . . . 11
2.3.2 Use of parallel computing on large scale of data processing . . . 14
2.3.3 Parallel computing on cloud platforms . . . 14
2.4 Summary . . . 15
Chapter 3 Review of the State of the Art 16 3.1 Introduction . . . 16
3.3 Buiding data cubes in parallel systems . . . 20
3.4 Real-time OLAP systems on cloud architectures . . . 20
Chapter 4 Problem Statement 23 4.1 Introduction . . . 23
4.2 Problem statement and justification . . . 24
4.2.1 OLAP data size is increasing dramatically . . . 24
4.2.2 Query performance is critical . . . 24
4.2.3 Data freshness is demanded . . . 26
4.3 Evaluation of Results . . . 27
4.4 Summary . . . 27
Chapter 5 Parallel real-time OLAP on multi-core processors 28 5.1 Introduction . . . 28
5.2 Parallel DC-Tree for multi-core processors . . . 28
5.3 The performance experiments of the PDC-tree on cloud platforms . . . 31
5.3.1 Experiments environment and scope . . . 32
5.3.2 Performance evaluation . . . 35
5.4 Summary . . . 43
Chapter 6 Real-time OLAP on cloud based distributed platform 44 6.1 Introduction . . . 44
6.2 Overview of PDCR-tree design . . . 45
6.2.1 Distributed PDCR tree and its data structure . . . 46
6.2.2 Building distributed PDCR tree from a master to workers . . . 52
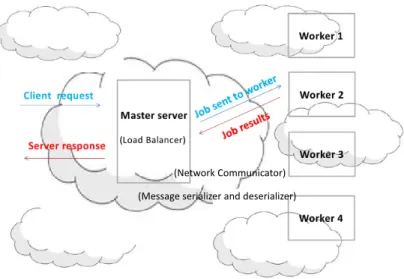
6.2.3 The network communication Structure and message serialization . . 58
6.2.4 Migration process and load balancer . . . 61
6.3 CR-OLAP operations and algorithms . . . 64
6.3.1 Insertion . . . 64
6.3.2 Aggregation . . . 66 iii
6.4 CR-OLAP query types . . . 73
6.5 Summary . . . 74
Chapter 7 Experiment and Testing of CR-OLAP 76 7.1 Introduction . . . 76 7.2 Test settings . . . 76 7.2.1 Experimental environment . . . 76 7.2.2 Experimental data . . . 77 7.2.3 Comparison baseline . . . 78 7.3 Analysis of Results . . . 79 Chapter 8 Conclusions 91 8.1 Conclusions . . . 91 8.2 Summary of Contributions . . . 91 8.3 Future Research . . . 92 Bibliography 94 iv
Table 5.1 Specifications of Amazon cloud instances used in our experiments [2] 33 Table 5.2 VCL cloud Instances . . . 33 Table 7.1 Specifications of Amazon cloud instances used in our experiments [2] 77
List of Figures
Figure 2.1 business intelligence architecture . . . 7
Figure 2.2 Snowflake schema for multi-dimensional database [14] . . . 9
Figure 2.3 a 3-dimensional data cube [42] . . . 9
Figure 2.4 a slice of data cube corresponding to location of Aisa [8] . . . 9
Figure 2.5 a dice of data cube corresponding to cellphones sold at North Amer-ica in year 2000 [8] . . . 9
Figure 2.6 drill-down data cube to a specific Store ‘EverMore’; (b) drill-down data cube to Store ‘EverMore’ and date ‘20080504’; (c) drill-down data cube to Store ‘EverMore’, month of date ‘April 2008’ and prod-uct category ‘Food’ [8] . . . 10
Figure 2.7 Speedup by parallel computing [10] . . . 12
Figure 2.8 linear, super linear and sub linear speedup [63] . . . 13
Figure 3.1 an R-tree for 2D rectangles [12] . . . 17
Figure 3.2 Visualization of an R-tree for 3D cubes [12] . . . 17
Figure 3.3 Structure of the X-tree . . . 18
Figure 3.4 Hierarchy Schema and Concept Hierarchy for dimension Customer . 18 Figure 5.1 data structure of a directory node in PDC-tree . . . 29
Figure 5.2 the structure of PDC-tree . . . 29
Figure 5.3 (a) Node split during insertion (b) stacks used for traversing direc-tory node for query [26] . . . 30
Figure 5.4 Hierarchy shema and Conceptural Hierarchy for each dimension . . 34
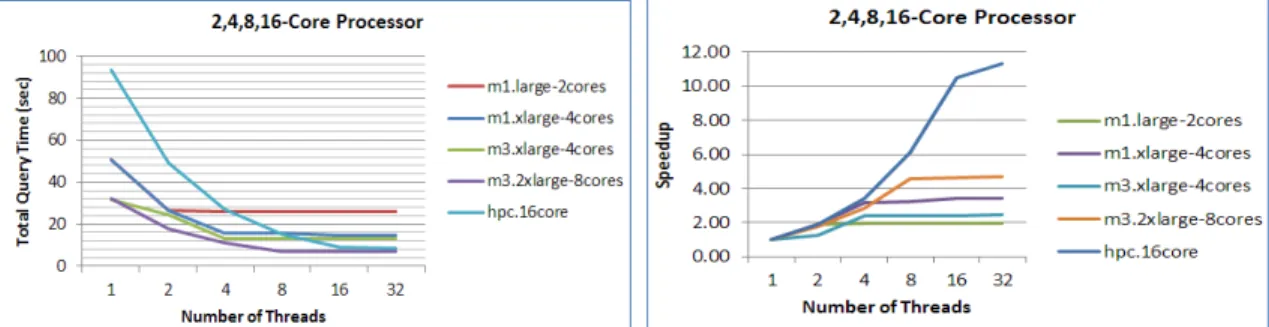
Figure 5.5 Increasing the number of threads on different types of processors . . 36
Figure 5.6 Increasing the number of threads on a 2-core processor . . . 36
Figure 5.7 Increasing the number of threads on a 4-cores processor . . . 36
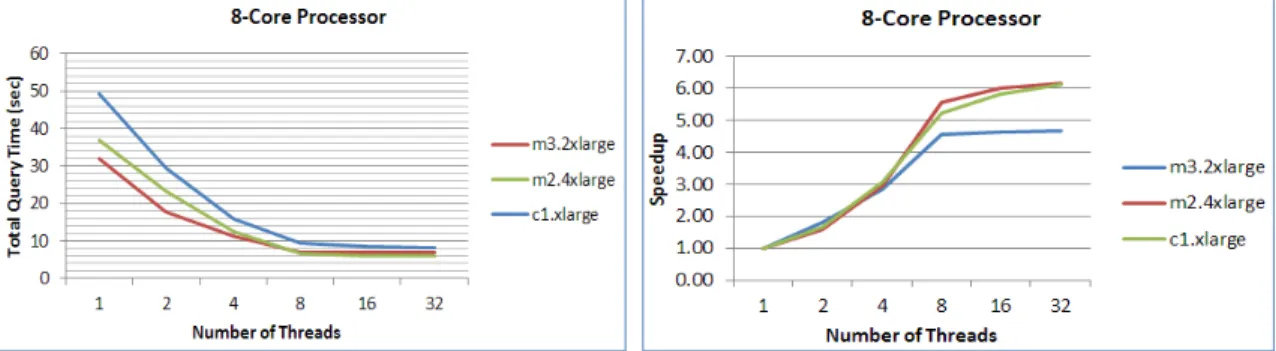
Figure 5.8 Increasing the number of threads on a 8-core processor . . . 37
Figure 5.9 Increasing the number of threads on a 16-core processor . . . 37
Figure 5.10 Increasing the number of insertions from 0 to 1000 . . . 38 vi
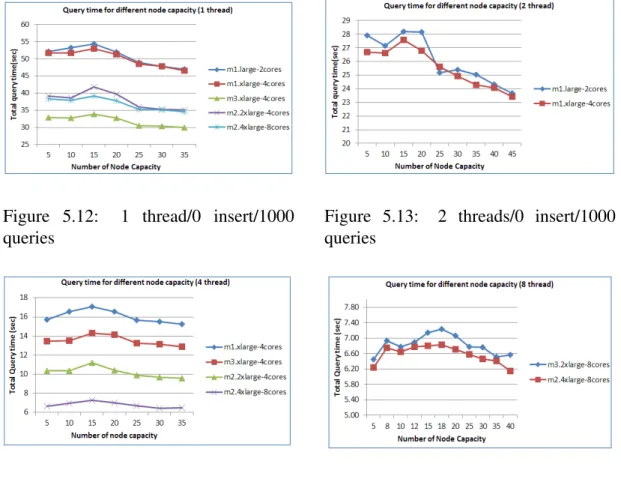
Figure 5.12 1 thread/0 insert/1000 queries . . . 39
Figure 5.13 2 threads/0 insert/1000 queries . . . 39
Figure 5.14 4 threads /0 insert/1000 queries . . . 39
Figure 5.15 8 threads /200 insert/1000 queries . . . 39
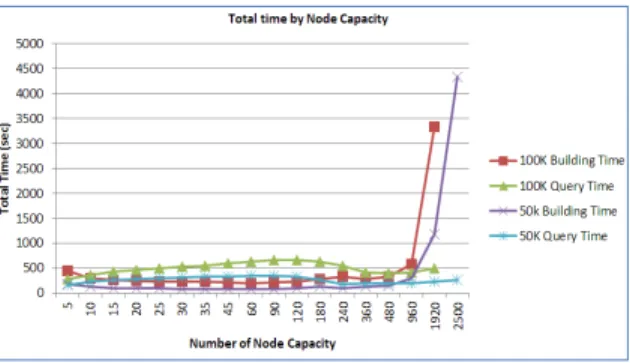
Figure 5.16 100k data Insertion and 1000 query time with 25% coverage (5<= capacity<=960) . . . 40
Figure 5.17 50k data insertion and 1000 query time with 25% coverage (5<= capacity<=960) . . . 40
Figure 5.18 100k data Insertion and 1000 Query with 25% coverage (5<= Capacity<=2500) . . . 41
Figure 5.19 Number of node splits,directory nodes, MDS expansion, . . . 42
Figure 5.20 1 million data insertion and 1000 queries with 25% coverage (10<= capacity<=360) % coverage (5<=capacity<=960) . . . 42
Figure 5.21 1 million data insertion and 1000 queries with 5% coverage (10<= capacity<=480) . . . 42
Figure 6.1 System architecture . . . 46
Figure 6.2 Distributed PDCR tree in master and workers . . . 47
Figure 6.3 Data structure of directory node . . . 48
Figure 6.4 Data structure of data node . . . 48
Figure 6.5 Array structure of data nodes and directory nodes . . . 48
Figure 6.6 MDS IDs in bit representation . . . 50
Figure 6.7 An example of relationship between hierarchy levels of a given di-mension . . . 51
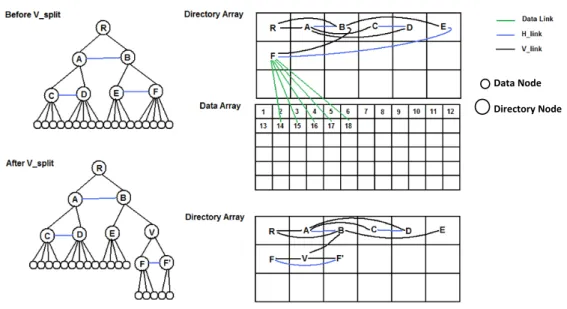
Figure 6.8 Vertical split during a new data insertion . . . 53 vii
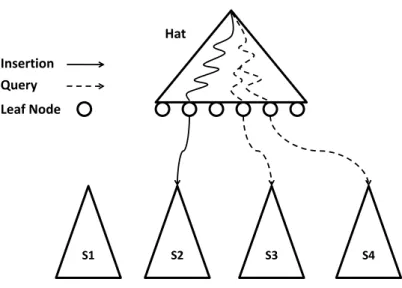
Figure 6.9 PDCR-tree growing from master to a worker: (a) Tree with four data nodes; (b) Vertical node split performed when node A exceeds capacity; (c) the subtree is moved to worker when the depth of tree exceeds cut level; (d) a vertical split performed on node A in worker; (e) subtree 1 and subtree 2 becomes two independent subtrees after
the vertical split and subtree A0is moved to worker 2 . . . 54
Figure 6.10 a subtree becomes independent after vertical node split: (a) Subtree B root with sibling links; (b) Node B has vertical split and creates Node D; (c) Subtree D resulted from vertical split does not have links with neighbor nodes . . . 55
Figure 6.11 Subtree becomes independent to any neighbor nodes . . . 57
Figure 6.12 Global architecture of network communicator . . . 59
Figure 6.13 Subtree migration process . . . 63
Figure 6.14 Examples of query patterns . . . 74
Figure 7.1 Store Sales Fact table and 8 dimensions and each with its hierarchy scheme . . . 78
Figure 7.2 Time for 1000 insertions as a function of the number of dimensions. (N=40M,m=8,k=16) . . . 80
Figure 7.3 Time for 1000 queries with different query coverage, as a function of the number of dimensions. (N=40M,m=8,k=16). . . 80
Figure 7.4 Time for 1000 insertions as a function of the number of workers.(N= 10M,k=16,d=8) . . . 81
Figure 7.5 Time for 1000 queries with different query coverages as a function of the number of workers.(N=10M,k=16,d=8) . . . 81
Figure 7.6 Speedup for 1000 queries with different query coverage as a func-tion of the number of workers.(N=10M,k=16,d=8). . . 81
Figure 7.7 Time for 1000 insertions as a function of the data size (number of items currently stored).(k=16,d=8) . . . 82
of the data size (number of items currently stored).(k=16,d=8) . 82 Figure 7.9 Time for 1000 queries as a function of query coverages in
PDCR-tree Impact of queries having value “*” for different dimensions.(N= 40M,m=8,k=16,d=8,10%<=Coverage<=90%) . . . 83 Figure 7.10 Time for 1000 queries as the query coverage in PDCR-tree Impact
of queries having value “*” for different dimensions.(N=40M,m= 8,k=16,d=8,91%<=Coverage<=99%) . . . 83 Figure 7.11 Time for 1000 queries as a function of query coverages in 1D-Index
Impact of queries having value “*” for different dimensions.(N= 40M,m=8,k=16,d=8,10%<=Coverage<=90%) . . . 84 Figure 7.12 Time for 1000 queries as the query coverage in 1D-Index Impact of
queries having value “*” for different dimensions.(N=40M,m= 8,k=16,d=8,91%<=Coverage<=99%) . . . 84 Figure 7.13 Ratio of 1D-index/PDCR-tree taken for 1000 queries as the query
coverage increases . . . 84 Figure 7.14 Ratio of 1D-index/PDCR-tree taken for 1000 queries as the query
coverage increases . . . 84 Figure 7.15 Time for 1000 queries as a function of query coverage for queries
with multiple “*” values for PDC-tree.(N=40M,m=8,k=16,d=8) 85 Figure 7.16 Time for 1000 queries as a function of query coverages for queries
with multiple “*” values for both PDCR-tree and 1D-index.(N = 40M,m=8,k=16,d=8) . . . 85 Figure 7.17 Time for 1000 queries on different type cloud instances.(N=10M,m=
4,k=16) . . . 86 Figure 7.18 Time for 1000 insertions on different type cloud instances.(N =
10M,m=4,k=16) . . . 86 Figure 7.19 Time for 1000 queries as a function of the number of cut level in
hat.(N=10M,m=4,k=16) . . . 87 ix
Figure 7.20 Time for 1000 insertions as a function of the number of cut level in hat.(N=10M,m=4,k=16) . . . 87 Figure 7.21 Time for 1000 queries as a function of the number of directory node
capacity in hat.(N=10M,m=4,k=16). . . 88 Figure 7.22 Time for 1000 insertions as a function of the number of directory
node capacity in hat.(N=10M,m=4,k=16) . . . 88 Figure 7.23 Time for 1000 queries as a function of the number of directory node
capacity in workers.(N=10M,m=4,k=16) . . . 89 Figure 7.24 Time for 1000 insertions as a function of the number of directory
node capacity in workers.(N=10M,m=4,k=16) . . . 89 Figure 7.25 Time for 1000 queries as a function of the number of directory node
capacity in both hat and workers.(N=10M,m=4,k=16) . . . 90 Figure 7.26 Time for 1000 insertions as a function of the number of directory
node capacity in both hat and workers.(N=10M,m=4,k=16) . . 90
Successful organizations increasingly rely on data analysis to develop new opportunities, guide business strategies and optimize resources. Online analytical processing (OLAP) systems are one of the most powerful technologies to provide the ability to interactively analyze multidimensional data from multiple perspectives. Traditionally, an OLAP system periodically (e.g. weekly) loads its data in batches and then builds static data cubes to answer queries quickly. However, many businesses expect OLAP systems which run in real-time, updating themselves dynamically as new data arrives. For this reason real-time OLAP systems’ performance must be highly optimized.
F. Dehne and H. Zaboli in their work “A Parallel Real-Time OLAP On Multi-Core Pro-cessors” introduced the PDC-tree which works with dimension hierarchies and parallelizes insertions and queries on OLAP systems. In this thesis we designed a new data struc-ture, the PDCR-tree, that extends the PDC-tree to work on distributed systems providing low-latency transactions processing even for very complex queries.
Using a PDCR-tree we demonstrate how to build a real-time OLAP system on a cloud based distributed platform called CR-OLAP. The CR-OLAP can be built using an m+1 machine scalable architecture so as the system load increases, the number of machines, m, can be increased to improve performance. Experiments show the system can process a query with 60% data coverage with on a database with 80 million data tuples with a response time 0.3 seconds or less, well within the parameters of a real-time system.
This project is funded and supported by IBM Research Canada. A research paper about this topic has been accepted by the 2013 IEEE International Conference on Big Data (IEEE BigData 2013).
Acknowledgements
I would like to thank my supervisor, Professor Frank Dehne, and as well as project member Professor Andrew Rau-Chaplin from Dalhousie University. Both these people gave their full support to this research project. I also appreciate the collaboration of Ph.D candidate Hamed Zaboli from Carleton University, and Master student Quan Kong from Dalhousie University. Their contribution to this project was significant. Mr. Zaboli in particular gave his help generously enabling me to quickly understand the theory and practical aspects to this project. I really enjoyed working with all these people.
Introduction
1.1 Introduction
In a fast changing global economy to keep business competitive organizations must react to new opportunities and changes quickly. Decision makers should make their decisions fast based on the right information. Such decision making usually is assisted by computer based Decision Support Systems (DSS), which are also known as Business Intelligence (BI) applications [55]. BI is a set of methodologies or technologies that transform com-pany’s raw data into meaningful information to aid in decision-making quickly. Many organizations collect a large amount of data through day-to-day operations from different information systems, such as Enterprise Resource Planning (ERP) systems, Customer Re-lationship Management (CRM) systems, accounting software and sales tools. Business intelligence applications can turn source data into useable information for organizations to understand business behaviors and make strategic and tactical decisions. For example, Wendy’s restaurants use BI to decide what new products should be added to their menus, and which under-performing stores should be closed. They also use BI to renegotiate con-tracts with food suppliers and identify opportunities to improve inefficient processes [51]. In the past few years, there is an increasing trend to use BI in many companies to identify important trends, analyze customer behaviours, and improve business processes.
One of the key components of BI system is Online Analytical Processing (OLAP). It is a tool that analyzes multi-dimensional business data providing insights supporting business decision making. In other words, OLAP enables users to view their data from different points of view. For example, a user can request data to be analyzed to show the total sales of TVs sold in city A in summer, and compare the sales of TVs sold in city B for the same time frame. The user can also compare the sales of TVs sold in city A in summer with the sales of the same product sold in city A in winter season. Databases configured for OLAP usually use a multidimensional data model. Data attributes such as product, sales region,
2 and time period are treated as separate dimensions, allowing the user to swiftly perform complex analytical reports and ad-hoc queries [49]. OLAP provides the ability to model business problems enabling organizations gain better insight into the data [7].
In this thesis we discuss the limitations of current OLAP systems and propose a parallel OLAP system, which handles queries and insertions concurrently. This architecture allows users to work with real-time data and to do real-time analysis.
1.2 Motivation
OLAP is designed to provide consistently fast query performance to support decision mak-ing. Traditional OLAP is built on summarized tables and materialized views. The data is stored in a relational data warehouse of historical, summarized and consolidated informa-tion from possibly several operainforma-tional systems. Over long periods of time, the database size can become quite large. For businesses like Walmart the data warehouse could contain terabytes or petabytes of data [4]. Summarizing the data to load into the OLAP system requires pre-computations. As a result, it may take minutes or even hours to complete an update or an insertion since it involves aggregating data along data dimensions. In current practice the data is usually updated in batches or on a periodical basis (e.g. weekly). Con-sequently the system is not real-time and the data used for decision support could be out-of-date leading to ineffective decision making [15, 57]. For this reason real-time analysis is required by more and more businesses such as stock exchange analysis, online shopping or financial assessment.
OLAP query performance issues on a large scale data warehouses has drawn the atten-tion of many researchers. Recently hardware has become faster and cheaper and software can perform better by running on new hardware. Applying parallelism is another way to improve software process speed. Parallel computing is popular because it improves perfor-mance by splitting large problems into smaller ones and solving them concurrently [61]. The innovation in computers with multi-cores and multi-processors, clusters with multiple computers, and cloud technologies provide the optimum platforms to support parallelism. Parallel methods and high performance parallel architecture can be applied to develop new real-time systems to support fast decision making.
In this thesis, our goal is to design a parallel OLAP model to handle queries and in-sertions simultaneously on a distributed system framework (e.g. a cluster in cloud). Such a system not only runs fast on small and medium data sets but also has the scalability to handle larger data sets.
1.3 Statement of the Problem
The function of BI and OLAP is to assist complex data analysis in response to business queries. Usually OLAP data is stored into multidimensional data arrays so users can query the data along many dimensions [15]. As business complexity increases, the demands on OLAP also increase.
High performance, in other words, quick response, is expected by users. The process of data loading to OLAP can add much extra information on the source data in order to provide more detailed views from different angles. As a result, the data sets contained in OLAP can be very large in size. Queries against such large volume multidimensional databases will be slow without proper indexing.
Meanwhile, businesses have high demand on real-time analysis and reporting. Users should be able to perform analysis with integrated data source in real time so that the result is not based on outdated information. Usually OLAP systems update their data on a periodical basis (e.g. daily, weekly, even monthly), so the data is often out of date.
Further, system scalability or elasticity is required to support growing data volume. OLAP multi-dimensional data arrays can contain more than 3 dimensions. There is no limit to the number of dimensions that every array can contain. The pre-computation for different levels of aggregation also contributes to a data explosion. It can be very time consuming to load and maintain these huge data models. Without scalability, users will have to invest in expensive hardware to process and accommodate exploding data.
To meet those requirements, many algorithms, models, or frameworks have been dis-cussed or proposed by researchers. We will review some of these approaches, and also provide our own approach to solve the above problems.
4 1.4 Contributions
In this thesis both OLAP databases on multi-core processors using PDC-tree indexes and the extended version using PDCR-tree indexes for distributed cloud environments will be discussed.
The PDC-tree is able to index multi-dimensional databases with hierarchical structures and allows operations (insertions and queries) concurrently on multi-core processors. The system has been developed by our research group members Prof. Frank Dehne and Ph.D. student Hamed Zoboli. In addition to the experiments on 16 and 20 cores PCs presented in the paper “A Parallel Real-Time OLAP On Multi-Core Processors” I also conducted experiments to further evaluate PDC-tree performance on a cloud environment and the impact of system parameters.
The PDCR-tree is an index designed for a distributed system. It not only carries many properties of the PDC-tree to handle parallelism on individual processor, but also distributes multi-dimensional data to multiple processors on the cloud environment so that tasks ex-ecution can be parallelized among multiple machines. We call the system CR-OLAP. It efficiently supports OLAP query processing and data insertion concurrently and ensures that the results for an OLAP query includes all data inserted prior to the query request. Multiple experiments are provided to demonstrate the performance and show CR-OLAP provides the potential to build a real-time OLAP with a distributed system on cloud based architectures.
The project is supported by IBM Centre for Advanced Studies Canada and is conducted with the participation of Prof. Frank Dehne and Ph.D. candidate Hamed Zaboli from Car-leton and Prof. Andrew Rue-Chaplin and Master student Quang Kong from Dalhousie University and myself. We conducted an extensive literature review. Mr. Zaboli provided the main idea behind the solution. We all participated in technical discussion and gave thoughts on details in the design. During the implementation of CR-OLAP, Mr. Zaboli was responsible for the PDCR-tree, Mr. Kong was responsible for the network communicator, and I was responsible for message serialization/de-serialization API, and migration API. In addition I developed code related to MDS Id used in PDCR-tree, such as ID assignment, ID upgrade and ID compare etc. Mr. Kong also developed the Stream-OLAP system which is a one dimensional index (1D-Index) structure for multidimensional database operations.
The Stream-OLAP system provides for comparing base to CR-OLAP experiments. Mr. Zaboli conducted the first 5 experiments of the CR-OLAP provided in the Chapter 7 and I conducted the experiments on evaluating the changing system parameters of the CR-OLAP and Mr. Kong conducted the experiments for the Stream-OLAP system. I also conducted multiple tests provided in Chapter 5 to evaluate the PDC-tree system’s performance in Cloud environments.
1.5 Organization of Thesis
The remainder of this thesis is organized as follows. In Chapter 2, we review background related to OLAP systems and parallel computing on distributed systems. Chapter 3 presents the state of art of OLAP systems and also presents some related work has been done by other researches to solve similar problems. In Chapter 4 we discuss the shortcomings of current OLAP systems that has not been solved by other researches. In Chapter 5, we present the design of parallel real-time OLAP on multi-core processors and the various ex-periments using different cloud environments. Chapter 6 explains our new methodology of parallel real-time OLAP designed for distributed cloud platforms and performance ex-periments are provided in Chapter 7. The final Chapter 8 contains concluding remarks and future work.
Chapter 2
Background
2.1 Introduction
Data is always important to any industry. With the help of business intelligence applica-tions, it becomes easier to manage, store, maintain and classify data. Therefore, organiza-tion can better use the informaorganiza-tion underlying raw data to make business decisions [61]. Many businesses benefit from BI systems. In the following, we will review the concept of BI and its key component OLAP. Since OLAP usually handles large volume of data, we will also give an introduction to parallel computing and its application to processing large data sets.
2.2 Business Intelligence and OLAP 2.2.1 Introduction to Business Intelligence
The term Business Intelligence was first defined in 1958 by IBM researcher Hans Peter Luhn[48] however only starting in the mid 1990s did the BI concept start to gain popular-ity. BI covers software-enabled innovations in performance management, planning, report-ing, queryreport-ing, online analytical processreport-ing, integration with operational systems, predictive analytics and related areas [54, 48]. As it is understood today, BI is computer-based tech-niques used to analyze business data such as sales revenue by products categories or store locations or client types.
The Figure 2.1 demonstrates the components of a BI architecture. It includes ETL (extract, transform and load) engine, data warehouse, OLAP or reporting. BI applications can benefit users to understand the strengths and weaknesses of their organizations, to understand the relationship between different data for better decisions, and to discover opportunities for improvement.
Organizations use Online Transaction Processing (OLTP) based databases to implement 6
CRM ERP Data Base Files Data Warehouse ETL OLAP Cubes report dashboard Ad hoc query
BI back end BIfront end
Figure2.1:businessintelligencearchitecture
theiroperationalsystems.Theseoperationalsystemscontainlargeamountsoftransactions
thatrecordtheday-to-daylifeofthebusinesses. Examplesofsuchoperationalsystems
mightbeorder-entrysystemsorstock-controlsystems. Operationalda
taintheseopera-tionalsystemsdescribesthebusinesses’specificactivities,processesorevents. Byusing
Extracting,TransformationandLoading(ETL)tools,BIretrievesoperationalda
taandre-structuresitwhileloadingtofacilitateanalysisfordecision-making. Thisrestructuring
caninvolvedataoperationssuchassummarization,aggregation(e.g.sum,average,max,
min),ordatajoins.Forexample,operationalsystemdatamaycontainsales quantityand
unitpriceforeachproductbutintheBIsystemextradatalikesalesamoun
tmaybere-quired.Thesalesamountbasedonsalesquantiyandunitpricemustbecalculatedduring
theload;Anotherexample:operationalsalestransactionmayonlycontainstoreid,while
dataistransformedtoBI,cityid,provinceid,regionidmaybeadded.Adatawarehouse
hasaseparatecopyofthedatafordataanalysis,datamining,andreportingactivities,so
thattheseoperationsdonotaffecttheperformanceofcoreoperationalfunctionsofthe
businesses[6].Operationalactivitieshappenveryoften,sothedataisconstantlychanging
andgrowing.Incontrast,adatawarehouseismorestaticforanalysisandupda
8 fetches data from the data warehouses, organizes them in highly complex multidimensional data cubes, and presents it to the users through a user defined format or dashboards [16].
In recent years corporations invested heavily in BI implementations. According to Gart-ner Report BI and Analytics was a $12.2 billion market in 2011 [45]. The big 5 vendors who are SAP, Oracle, SAS, IBM and Microsoft dominated more than 70% market share in 2011. Those numbers are expected to continue increasing in 2013, 2014, and 2015 and according to IDC the amount will reach $50.7 billion in revenue by 2016 [62]. The IBM study of CIO priorities in 2013 also shows Business Intelligence and Analytics is becoming a top technology priority [46].
2.2.2 OLAP and data cube
OLAP is one of the key technologies of a business intelligence framework. It is a powerful tool that enables users to quickly and interactively access multiple views of information. For example, users can request reports about all products sales revenues in Europe over a particular year but users can also drill down to the sales of TVs in September, calculate year-to-date sales or compare the revenue with those of the same products sold in January. OLAP stores data in data cubes models with multiple dimensions. For example, sales by region, sales by sales representative, sales by category, sales by quarter, etc. The OLAP cube consists of dimensions and numeric facts called measures. These dimensions and measures are stored as star or snowflake schema (see figure 2.2) [14]. Measures (e.g. Sales revenue, unit sold, customer count) are derived from the records in the fact table and di-mensions (e.g. customer, product, time) are derived from the dimension tables. Normally OLAP cubes have more than 3 dimensions, and each dimension contains several attributes. For examples, a store dimension can have attributes like country, region, or city; a product dimension can have attributes like brand or category or department. Each cell in a cube contains measures which are appropriately aggregated along its dimensions. The aggrega-tion operaaggrega-tions can be SUM, AVG, MAX, MIN, etc. Figure 2.3 shows a 3 dimensional data cube with Store, Time, and Product dimensions. The value 56 in the cell represents the total number of units of breads sold in L.A on Monday, so the “unit” is a measure and its value in this case is 56.
Figure2.2:Snowflakeschemaformult
i-dimensionaldatabase[14] F[42]igure2.3:a3-dimensionaldatacube
[8].Theyaredefinedasfollows:
•SliceandDice:
UsercanslicethecubeandtakeonespecificsubsetoftheOLAPcubeononed
imen-sionmember,ordicethecubeandgetthesub-cuboidontwoormoredimensions.
Forexample,infigure2.4usersareinterestedinasliceofdatacorrespondingto
Asia.Usercanalsodicethecubetoanalyzethesubsetofdatacorrespondingtocell
phonessoldinNorthAmericainyear2000(Figure2.5).
Figure2.4:asliceofda
tacubecorre-spondingtolocationofAisa[8] respondFigure2ingtoce.5: adiceofdallphonessotacubecorldatNorth
-Americainyear2000[8]
•Drill-down/up:
10 other way around from detail levels to more summarized levels. For example: in fig-ure 2.6 users can drill-down and view all product sales at the store EverMore or drill even further down and see the sales for the specific date 2008/04/05. Alternately users can drill-up to the store dimension’s “state” and date dimension’s “month” to view food products sold at all stores in Florida in April 2008.
Figure 2.6: drill-down data cube to a specific Store ‘EverMore’; (b) drill-down data cube to Store ‘EverMore’ and date ‘20080504’; (c) drill-down data cube to Store ‘EverMore’, month of date ‘April 2008’ and product category ‘Food’ [8]
• Roll-up:
A roll-up involves a data aggregation in one or more dimensions. For example, all sales offices are rolled up to the sales departments, or the sales months are rolled up to the years.
In a data cube each cell is a summary value of users’ interest and is pre-calculated while the cube is being built. If a user asks for the total sales by year and city, those numbers are already available. This design enables OLAP to response users’ queries faster than it otherwise would be able to. For instance, the largest cube in the world is currently 1.4 terabytes and its average response time to any query is 1.2 seconds [35]. This is the big advantage of building a data cube. It has been claimed that OLAP cubes can respond to complex queries in 0.1% of the time of an OLTP relational database [21]. The multidimen-sional structure allows users to study data thoroughly to gain comprehensive and valuable business insights.
2.2.3 Real-time OLAP
OLAP systems do not usually run against OLTP systems or other high-transaction, low-latency databases because analyzing and aggregating on large volumes of historical data consumes extensive time and resources and it can affect the performance of the relational databases. Some businesses, for example financial risk assessment businesses, may require analysis based on current data. Businesses such as these require a Real-Time OLAP (RTO-LAP) that performs analysis on integrated data sources in real-time. However, designing a RTOLAP is difficult since the OLTP data model is very different from the OLAP data model. In such a real-time system query performance becomes a concern since values need to be calculated in real-time instead of being retrieved from pre-computed data sets in a traditional OLAP system.
The definition of RTOLAP may vary from business to business. Some researchers define RTOLAP as a system that any data incorporated into a data warehouse should be made available to the OLAP system as soon as possible. In other words, data added to the warehouse should be available to the system immediately so it can be included in analysis and reports. This is the definition for RTOLAP we use in our research.
2.3 Parallel computing and big data processing
2.3.1 Introduction to parallel computing and its advantages
Parallel computing means executing discrete parts of a computational problem simultane-ously on multiple computing resources. Computer resource can be a single computer with multiple processors, many computers in a network or a combination of both. This compares to using sequential computing, executing discrete parts of a problem in sequence on a sin-gle CPU. The advantage of using parallel computing is to save time and cost. In addition, parallel computing can be used to solve larger and more complex problems such as large scale data processing which is not practical on a single CPU. Parallel computing is not only limited to the local network but can be run on a wide array of resources such as a cluster in a cloud. It provides a more efficient way to solve many difficult science, engineering and business problems. Parallel computing as proven useful for database systems, data mining, and multimedia processing, medical imaging and diagnosis, advanced graphics and virtual
Hardware 100% task Time Hardware Time 50% task Hardware Time 50% task Original System Parallel System 12
Figure2.7:Speedupbyparallelcomputing[10]
realitysystemsetc.
•Parallelcomputingperformancemeasure:speedup
Thegoalofparallelcomputingistohaveperformancespeedup. Withtheaddition
ofmorehardware,thesystemcancompletethesametaskinlesstimethantheor
ig-inalsystem[10].Thefigure2.7showsthespeedup. Whenasinglehardwareneeds
anamountoftimetocompleteatask,withparallelism,twose
tsofthesamehard-wareexecuteconcurrentlyandonlyneedhalftimetocompletethesametasksothe
speedupistwo.Intheory,speedupisdefinedbytheformulaSp=T1/Tpwherepis
thenumberofprocessors,T1istheexecutiontimeofasequentialalgorithmandTp
istheexecutiontimeofaparallelalgorithmwithpprocessors.
Ideally,theoptimalspeedupislinear. Thatis,whenrunningaparallelalgorithm
withlinearspeedup,thespeedcanbedoubledbydoublingthenumberofprocessors.
However,theidealspeedupishardtoreachsinceitcanbeaffectedbytheoverhead
fromsystemsynchronizationandmessagepassing[50]. Mostparallelsystemshave
anear-linearspeedupforsmallnumbersofprocessorsandthenasmoreprocessors
added,thespeedupperformancegainsflattenouttoaconstantvalue.Thediagram
(figure2.8)showssuchrelationship.
•Parallelprocessinghardwarearchitectures
Parallelcomputingarchitecturescanbecategorizedtothefollowinggroups:
Figure 2.8: linear, super linear and sub linear speedup [63]
A multicore processor is a processor having several central processing units (“cores”) on the same chip. Multiple cores can execute multiple instructions at the same time. Symmetric multiprocessing
A symmetric multiprocessor (SMP) contains multiple homogeneous processors and they share one memory and I/O resource and connect through a bus. Each processor can execute different programs and work on different data.
Distributed computing
A distributed system consists of multiple processing elements (also called nodes) that connected by network. Each processing element uses its own operating system and memory and they can execute multiple tasks simultaneously [13, 5]. Each node also acts as an SMP system. The processing elements can be multiple standalone computers. When they are connected by a local network such distributed system can be called a cluster. If the processing elements are multiple processors and they are linked through specialized interconnected hardware, such distributed system is called Massive Parallel Processing (MPP). Typically the number of MPP processors is larger than the members of a cluster. The number of MPP processors can be 100 or even more. Distributed systems can be used in data mining to perform multiple searches of a static database, and they are also useful in artificial intelligence sce-narios to analyze multiple alternatives (e.g in a chess playing program). Unlike SMP
14 and multi-core systems, distributed systems usually have better scalability, since they can be expanded by simply adding new nodes. Multi-core systems are limited by the number of cores availabe and SMP can be limited to the number of processors.
2.3.2 Use of parallel computing on large scale of data processing
In this age of data explosion parallel processing is essential to processing a massive volume of data in a timely manner because it allows data to be divided among the available com-puting resources and processed independently to achieve performance and scalability [52]. In many areas, such as meteorology, complex physics simulations [50], genomics [52], bi-ological and envioronmental research [17], internet search, financial risk assessment and real-time business analysis data volumes can reach terabytes or petabytes in size. It is dif-ficult to work with data sets of this size since regular relational databases, statistics tools, visualization software products are often not scalable to this level. Parallel processing ap-proaches make working with large data sets possible. For example, decoding the human genome can be achieved in one week with parallel computing where without it it could take 10 years [11]. Parallel computing has become popularized by successful commercial prod-ucts for instances MapReduce by Google, Hadoop used by Yahoo, Facebook, DryadLINQ by Microsoft and HPCC by LexisNexis etc.
2.3.3 Parallel computing on cloud platforms
Parallel data processing is also used for cloud computing. Cloud computing platforms be-come popular in the past several years, especially among the small businesses. In cloud computing, resources including hardware and software are delivered as a service over a network. Users can easily reserve nodes and set up a virtual machine or a virtual clus-ter for parallel computing. The emergence of cloud services provides users alclus-ternatives to investing in hardware, software and expertise to set up their own cluster. Not only are cloud services cost-effective but also cloud performance is competitive with the perfor-mance of in-house clusters [64]. In addition to the flexibility and scalability of using cloud computing, cloud based platforms are a cost-effective solution to run parallel applications, especially data-intensive parallel programs that requires scalability.
2.4 Summary
OLAP usually deals with large scale data, and parallel computing has the advantage of improving system performance. To solve the problems currently existing in OLAP we are applying parallel computing to OLAP systems so that the systems are able to provide better responses to user requests while dealing with large quantities of data.
Chapter 3
Review of the State of the Art
3.1 Introduction
We are aiming to design a parallel OLAP system on a distributed cloud platform for real-time analysis. The following is the literature review on related work such as sequential index for OLAP cubes, parallel cube building on parallelism supportive systems and some proposed real-time OLAP systems.
3.2 Sequential indexes for multi-dimensional databases
An OLAP cube is a multi-dimensional data array. In relational databases, balanced trees, B+ trees and hash tables are popular data structures to implement indices to optimize data look-up performance. But those indices show poor performance for multi-dimensional range queries. There are some researches on dynamic indexes for multi-dimensional database. In 1984, A. Guttman first proposed R-tree for indexing spatial data [40]. Spatial objects are described by multiple dimensions. The idea of R-trees is to group nearby objects and represent them with minimum bounding rectangles (MBRs) at each level of the tree. Figure 3.1 shows a two-dimensional space with a R-tree index. R8, R9, R10 are the MBRs for the objects D1, D2, and D3 respectively; R3 includes R8, R9 and R10, so it is the MBR for the three objects D1, D2, and D3. Figure 3.2 shows a three-dimensional space with an R-tree index.
Because all objects are contained in a bounding rectangle, a query can be quickly re-solved through finding the bounding rectangle overlaps between the query and the objects. When inserting an object into the tree, we should consider finding the node which will have the minimal enlargement of its bounding rectangle. If the capacity of a node is full, the node should be split into two nodes and the rectangles also should be distributed between them. A good split should result in minimal rectangle overlap of these two new sets.
Figure3.1:anR-treefor2Drectangles
[12] F3Dcubes[12]igure3.2:VisualizationofanR-treefor
TheR-treeisusedtoindexspecialdatawithmulti-dimension;however,itisnotsuitable
forhighdimensionaldatasetssincetheoverlapoftheboundingboxesincreasesalot
whenthedimensionsgrow. Thiswillcausethesearchprocesstobeinefficientsinceit
requiresaccessinglargenumbersofchildrennodes.ToavoidthisproblemS.Berchtoldet
alproposedtheX-treein[18].TheX-treeisbasedontheR-treebutcontains3typesof
nodes:datanodes,normaldirectorynodes,andsupernodes(seefigure3.3).Thedatanode
containsminimumboundingrectangles(MBRs)withpointerstotheactualdataobjects.
Thedirectorynodecontains MBRsandpointerstosub-MBRs.Supernodesaredirectory
nodesthatcontainoversizeddirectorynodeblocks.
TheX-treecanbeconsideredasahybridofalineararray-likedirectoryandahierarch
i-calR-tree-likedirectory.Inotherwords,thedatasetshavinghighoverlapareorganizedin
alinearstructureandthosehavingnottoomuchoverlapcanbeorganizedinahierarchical
structure. ThemostimportantpartistheinsertionandX-treeproposedanalgorithmto
createoverlap-freesplitduringaninsertion. Whenthenodeoverfilledandthereisnogood
split,asupernodewillbecreated. TheperformancecomparisonbetweentheX-treeand
theR-treeprovedthattheX-treehasconsistentlybetterspeedup.
ADC-tree,proposedbyH.Kriegelin[36],issimilartotheX-tree,butthe MBRis
18
Figure 3.3: Structure of the X-tree
database for OLAP systems. Kriegel states that each dimension of a data cube can be orga-nized in concept hierarchies. Each dimension in a data cube can contain several attributes. These attributes usually can be organized in hierarchical schemas. For example, in the dimension “store”, as well as store ids, there can be columns like “country”, “province”, and “city” which are the attributes describing each store id. The “store” dimension can be organized in a hierarchy as figure 3.4 shows.
We can use an MDS to describe data using its dimensions’ conceptual hierarchy values.
Hierarchy Schema for dimension Store:
Country Province
City Store ID
Conceptual Hierarchy for dimension Store: Canada Ontario Ottawa 3001 All US … … … … … … …
An MDS contains multiple sets of attribute values at different hierarchical levels which describe cube dimensions. Consider the following two data records in a data cube having 3 dimensions: “Store”, “Product”, “Time” and one measure: “Sales”.
([Canada, Ontario, Ottawa, 3001], [Food, Bakery, 225], [2013, March, 30, 123],
$2703.89)
([Canada, Quebec, Montreal, 4001], [Food, Candy, 625], [2013, Feb, 20, 456],$6703.89) The MDS at the lowest level in the concept hierarchy of each dimension is ({3001, 4001}, {225, 625}, {123, 456}). Since the attributes id at the lowest level of a hierarchy usually is a surrogate key in each dimension, an MDS at the lowest level can distinguish each data record from each other. However, an MDS can also use values of higher levels in a concept hierarchy. For the above same data records, the MDS can be ({Ontario, Que-bec}, {Food}, {2013}). The values in each MDS set for a dimension should all belong to the same level in the concept hierarch of this dimension. For example, for the “store” dimension, it is correct to use {Ontario, Quebec} as the MDS, but not Ontario, Canada. Similar to the bounding box in the R-tree, the MDS describes the boundary of data records. The attribute values in a hierarchy also have the property of partial ordering which allows easy insertion and range queries since the leaf of the concept hierarchy is organized as a group.
H. Kriegel’s paper also proposes the algorithms for insertion and range query oper-ations. The insertion traces down from the root of the tree by comparing the MDSs of directory nodes with the MDSs of new data. When the node capacity is reached, the node will be split. Before performing the hierarchy split, the MDSs of the entries and the MDSs of directory nodes have to be adjusted to the same hierarchy level in order to calculate the MDSs’ enlargement and overlaps. It always inserts the node to the group having the minimum MDSs overlaps with others. The range query algorithm finds the MDSs of direc-tory nodes which contain the range query’s MDSs and adds the measure to the result. H. Kriegel’s paper compared the performance of the DC-tree, the X-tree, and the sequential search algorithm. The insertion time is significantly lower for the X-tree since the DC-tree has a higher computational load than the X-tree has. However, the DC-tree provided better performance with range queries especially when the range query’s MDSs were large. The DC-trees are designed specially for OLAP multi-dimensional databases enabling users to
20 execute data insertions and search queries sequentially.
3.3 Buiding data cubes in parallel systems
Many parallel algorithms are developed to support multi-dimensional data cubes in order to reduce the query response time. F. Dehne et al. proposed several methods to build static data cubes on cluster platforms in papers [23, 27, 28, 29, 30, 31, 32]. The main idea of F. Dehne et al’s methods is to provide data partition strategies to assign sub-cubes to different cluster nodes and then to build sub-cubes on each node. S. Goil et al presented parallel al-gorithms to construct data cubes using sort-based and hash-based methods [38]. The exper-iments of S. Goil et al’s methods showed good performance on small data sets. H.Luan et al. [47] proposed an approach called Cache-conscious Cubing (CC-Cubing) which can par-tition multi-dimension data simultaneously with multi-threads to enhance CPU and cache performances. H.Luan et al. claimed that the parallel cash-aware CC-Cubing algorithm improved the performance by 27% comparing it to the single thread CC-Cubing method. D.Jin et al. [43] implemented a parallel algorithm to build data cubes based on dynamically extendible multi-dimensional arrays using the multi-core architectures. The extendible ar-ray can be dynamically extended along any dimension without relocating any existing data. The experiments were performed on a SUN Enterprise 4900 SMP machine with 24 cores processors and obtained near linear speed up and showed good scalability for high dimen-sional data sets. These parallel algorithms are focused on building static data cubes for a better query performance.
3.4 Real-time OLAP systems on cloud architectures
With the emergence of cloud services, many applications are migrated to cloud infrastruc-tures. The strategies and methods for hosting BI applications on cloud architectures is still being researched. BI is a highly resource intensive system requiring large scale parallel processing and significant storage capacities to host the data warehouses. With all the ad-vantages of cloud services such as scalability or no maintenance on hardware infrastructure, cloud is an alternative platform for BI systems.
H. Al-Aqrabi et al. in [16] designed a small BI and OLAP framework model with mas-sive parallel relational database servers to demonstrate that a OLAP system can be taken to cloud hosting. However, the model was built on a simulation environment limited only to certain ideal scenarios, for example, query loads were evenly distributed. In the real practice, it is challenge to evenly distribute loads when the systems involve hundreds of databases. [65] proposed a R-tree and KD-tree combined index structure to improve cube building and query performance. [20] presented ES2, an elastic data storage system in a cloud environment to support both OLAP and OLTP within the same storage. They devel-oped a unified indexing framework including hash indices for exact queries and distributed multi-dimensional indices for multi-dimensional queries. The experiments of ES2 illus-trated the system efficiency and confirmed the benefit of providing distributed indexes and accesses to the data for both OLTP and OLAP queries. However, no benchmark has been provided yet.
Both MapReduce and Hadoop support to process large data sets especially unstructured data in a distributed system which can be scaled up to thousands of machines. Several high level OLAP models have been built on distributed systems using a MapReduce program-ming model or a Hadoop framework to provide data processing and analysis. Paper [34] proposed to convert multidimensional data structures into Pig [53] data and allow using Pig Latin query language to perform OLAP search. Hive [60] is also a data warehouse solution built on a Hadoop framework. It stores data in tables similar to relational databases and supports queries using SQL-like language called HiveQL. It has been used by Facebook for data analysis. epiC is an elastic power-aware data-intensive cloud platform for data analysis operations and online transactions [22]. These studies focused on operations with relational data models using the data-intensive computing technologies. Paper [19] pro-posed to build a distributed cube with a broker architecture on Amazon EC2. This system is able to store, manage, analyze data and answer OLAP queries in a fully elastic man-ner. When the cube storage is increasing, it can be extended to a virtual cube where it can host more regular cubes. The implementation demonstrated near linear speedup for OLAP query response time while increasing the number of cubes. U. Ahmed et al in [15] proposed a real-time temporal OLAP with the TiC-Tree. They redefined the MDS and take advantage of the temporal nature of the data in the dimension of ”Time” to keep values
22 together in time order in the tree nodes. This model provided better group-by and range queries performance.
Problem Statement
4.1 Introduction
With the increasing demands on performing data analysis in real-time on large scale data, more and more researchers pay attentions to improve the performance BI or OLAP. Due to the change of businesses requirements, OLAP systems encounter some challenges. 1) Business data is growing rapidly so the existing OLAP may be lack of storage space soon. It requires adding more infrastructures with large memory for computing data and large disks for storing data. 2) OLAP is not optimized well for handling very large data sets, so it can-not response user requests quickly enough. But, many businesses such as stock exchange businesses require high efficient performance. 3) Many online services are emerged and they also require business analysis in real-time. However, the OLAP systems in a periodi-cal update fashion cannot provide the most up-to-date data for business analysis. Therefore, users are looking for solutions that enable OLAP systems to include the new data once they are available to business intelligence systems instead of doing periodical loading.
In the reviews in Chapter 3, various possible solutions have been discussed and some of them even have been implemented as real products. They are built on different data models, system architectures, and hardware platforms to achieve optimized data analysis performance in different ways. To meet the above requirements, we are aiming to design a real-time OLAP system which can execute new data insertions and OLAP operations (e.g. drill-down, slice, roll-up) concurrently. The system can run on distributed systems such as a cluster on a cloud environment so that it can be scale up to handle the growth of data volume.
Next, we will describe the details of the problems and requirements being concerned in our study.
24 4.2 Problem statement and justification
4.2.1 OLAP data size is increasing dramatically
An OLAP system is designed to provide quick responses to user query requests for the purpose of business analysis. Usually, an OLAP system contains historical data loaded from transaction systems as well as aggregation data pre-computed during data loading. Over time, the data gets exponentially increased. As we discussed in Background Chapter, the data size can be in terabytes or even petabytes. This also requires much larger data storages. Therefore, while the data is growing, the OLAP will require additional storages to maintain all data. Adding extra infrastructures on existing systems can be costly and merging the existing system into the new infrastructures can be also difficult sometimes. If a system allows to be easily expanded, it could not only save large amount investments but also avoid troubles caused by technical problems.
Furthermore, the technologies to handle large data sets will be different from the ones to handle small data sets. The MapReduce programming model and the Hadoop framework are developed to process big data across distributed systems. But they are mostly used for unstructured data for data mining purpose. Several frameworks are suggested to deal with large volumes of data, for examples, Hive, Pig, and epiC [60, 22, 53]. These systems use the MapReduce programming model and execute OLAP queries in relational databases instead of multi-dimensional databases. An elastic OLAP on cloud was proposed in [19] to efficiently utilize cloud computing infrastructures to provide scalability. But it was using its own representation language called OLAP Model Markup Language (OMML) for data cubes, OLAP queries and analytical results.
4.2.2 Query performance is critical
The large data involved in OLAP systems can also hugely impact the performance of OLAP systems. Organizations use OLAP systems to quickly response the market changes, there-fore, response time of OLAP operations and ad-hoc queries is critical for most users. Most OLAP engines have already been optimized for the purpose of business analysis so that they can report on millions of records at a time. However, query efficiency is still a concern
in OLAP systems while they involve large scale data sets. User queries usually are vari-ous so aggregations for certain types of queries may not be pre-calculated in data cubes. Queries against the large scale data sets can be extensively time consuming since they can access billions of data rows and require a lot of data scans, joins and aggregates.
• Using data indexes to optimize multi-dimensional databases operations
The OLAP data is represented in multi-dimensional database. Many cube may con-tain 20, 30 or even more dimensions. In most commercial relational database man-agement systems (RDBMS) such asIBM DB2, Informix,Microsoft SQL Server, Or-acle 8, Sybase ASEandSQLite, A B+-tree is implemented for a table index in order to achieve optimized query performance. This type of tree is designed for searching data according to one attribute so it is not efficient to answer queries concerning mul-tiple attributes. For a multi-dimensional index structure, an R-tree was considered as a good solution [40]. Oracle and DB2 have the extensions that are supporting spatial indexing with the R-trees, but they are mostly used for GIS/CAD applications. However, when the number of dimensions is higher than 5 to 10, the R-tree and its variants like R+-tree, R*-tree are not efficient any more [41]. MBRs in high dimensions could have huge overlaps so it needs to traverse many nodes in the tree to answer a query. The X-tree is also an extension of the R-tree and it is designed for high-dimensional databases but it is also used for spatial objects [18]. The DC-tree is a dynamic index specially designed for data warehouses and its structure allows to handle insertions and range queries sequentially [36].
• Constructing data cubes for parallel queries
With the emergence of multi-core processors, parallelization becomes a popular on-going research and an optional technology to be adopted by developing business intelligence applications. The R-tree was parallelized to improve the performance on multi-dimensional data [59, 56, 25], however the focus of these discussions is still on spatial data but not for the design of OLAP multi-dimensional data structures. Some researchers have worked on parallelizing OLAP cube computing. [38, 39] discussed parallel cube computing for multi-dimensional OLAP using in-memory data cube construction on distributed-memory machines. H. Gao et al in [37] proposed parallel
26 hierarchical cubes that support parallelizing range sum queries but their method was hard to be applied to other type of aggregations. The ParaCube introduced in [66] used a mediator to distribute queries to all sibling cubes and merge all sub queries’ results to a global result. But the authors stated that the system performance was in-fluenced by the conflicts on accessing shared memory when applying such a structure on multi-core platforms.
4.2.3 Data freshness is demanded
Some businesses(e.g online shopping or real-time traffic surveillance) have very high de-mands on data analysis in real-time. They would like to have any data added in OLTP be available to business intelligence systems right away and to be included in reports. The OLAP data are usually imported from external OLTP systems. In the process of load-ing, it involves large computation on the raw data in order to transform them to a mul-tidimensional model. OLAP systems usually get updated periodically because data pre-computation could take very long time to complete while building data cubes. Therefore, most OLAP systems are just an information snapshot at one point in time. The data cubes are not dynamically built. Consequently, the systems are not in real-time and the data used for decision support are possibly out-of-date which can lead to ineffective decision making. These OLAP systems are less valuable for those businesses who need most up to date infor-mation. [15] designed TiC-Tree for a real-time OLAP, but it is primarily used on temporal data. [57, 58] proposed a real-time data warehouse which enabled continuous data integra-tion through an adaptive loading methodology to minimize the impact of OLAP queries. However, this approach focused on incremental data loading to data warehouses and build-ing static OLAP cubes. Jones in [44] stated one problem of usbuild-ing OLAP systems for data analysis in real-time is reformulation of multi-dimensional data cubes. Some researchers also suggested using XML to map OLTP and OLAP to achieve analysis in real-time [24].
In addition, a discussion has been made on the topic of integration of OLTP and OLAP to provide real-time analysis [24]. The author reviewed several related technologies and studied the possibility to use the same database engines for both systems with the object extensions of the SQL3 standard. He also suggested four major approaches to constructing Real-Time Data Warehousing (RTDW) but no performance evaluations on an implemented
system were provided. 4.3 Evaluation of Results
In order to resolve the above issues, we intended to design a parallel OLAP system for real-time analysis on a distributed system with cloud infrastructures. We developed a method to partition data and distribute them to the available computing processors in the system. It enables dispatching requests such as data insertions and range queries to the related nodes so the requests are executed in parallel. The system provides analysis in real-time since it will include most recent data in the results for query requests. To evaluate the performance of our system, “speedup” is the key measurement we used. We expected that the system should achieve near-linear speedup by increasing the number of nodes in a distributed system.
4.4 Summary
In this Chapter, we presented the three main concerns in OLAP systems, such as the system scalability for increasing data size, the response performance for query requests and the data freshness for real-time requirements. Though there are some studies or commercial products available, most of them do not provide complete solutions to all the problems we listed in this chapter. Therefore, we aimed to design an enhanced parallel system to resolve these issues.
Chapter 5
Parallel real-time OLAP on multi-core processors
5.1 Introduction
In this Chapter, we will introduce a parallel real-time OLAP system for multi-core proces-sors. It is designed by F. Dehne and H. Zaboli based on the sequential DC-Tree. The tree data structure provided in the parallel real-time OLAP is called Parallel DC-Tree (PDC-Tree). It enables concurrently executing multiple insertions and multiple range queries on an architecture with multi-core processors [33]. It is claimed to be the first fully real-time OLAP system that has been parallelized and optimized for contemporary multi-core pro-cessors. The evaluation was performed on the platforms with a maximum 20 cores and it shows the system can achieve near linear speedup by increasing the number of cores.
The PDC-tree also provides the foundation for designing a parallel real-time OLAP for distributed systems in a cloud environment. To evaluate the performance of the PDC-tree in a cloud environment, I conducted various experiments on the Amazon cloud EC2 platform as well as the Ontario Research and Education VCL cloud.
In next section, we will review the data structure of the PDC-Tree and present the results from the experiments I performed in the cloud environments.
5.2 Parallel DC-Tree for multi-core processors
The parallel real-time OLAP system introduced in [33] takes the idea of hierarchy struc-tures for multidimensional databases and the directory node strucstruc-tures introduced in the DC-tree. In addition to the DC-tree data structure, the PDC-tree index consists of two ad-ditional parts which are 1) time stamp 2) link to sibling (See figure 5.1 and figure 5.2). The time stamp stores the most recent time when the directory nodes in the tree are modified or created during the process of a node splitting or a node insertion. The “link to sibling” is used to maintain a linear chain between the children of each directory node. These two
fields are important for the system to perform parallel executions. Also the design acquires the lock to only lock the nodes which are currently being updated. The authors provided
Figure 5.1: data structure of a directory node in PDC-tree
Figure 5.2: the structure of PDC-tree
the following algorithms of data insertion and range query operations.
ThePARALLEL OLAP INSERT algorithm tracks down the PDC-tree by checking the MDS in each directory node to find the leaf directory node where the new data item should be inserted. Three cases will be considered.
• When the new data’s MDS is contained in only one directory node’s MDS, the algo-rithm traces down its child directory node.
• When the new data’s MDS is included in more than one directory node’s MDS, the algorithm chooses the smallest subtree to go down.
• When the new data’s MDS has overlap with many directory nodes’ MDSs, choose the directory node that has minimal MDS overlap with its neighbors caused by the MDS enlargement if possible insertion happens.
This step is repeated until the leaf directory node is reached. Then the node will be locked in order to perform data node insertion. If the node capacity has been exceeded with the insertion, it will call the SPLIT algorithm of node splitting. The figure 5.3 (a) demonstrates a node split during a insertion. The directory node D1 is required to be split. A new directory node D4 is created and added as D1’s right sibling node. Meantime D4 copies D1’s old timestamp. The children nodes D2 and D3 are distributed between D1 and D4 so that they have minimal overlap between two groups. After split, D1 updates its timestamp with new time and also updates its MDS and measures. In this process, the
30
(a)
(b)
Figure 5.3: (a) Node split during insertion (b) stacks used for traversing directory node for query [26]
newly added directory node gets the old time and the original directory node gets the new time. The split process starts from the nodes at the bottom of the tree until no further split or the root node is reached.
ThePARALLEL OLAP QUERY algorithm takes the MDS of the given range query as an input. A stack is used to control traversing the tree and to detect the modified directory nodes and new directory nodes raised by parallel insertions so that all the new data inserted in parallel along with query requests can be evaluated as well. Starting from the root the process pushes one directory node to the stack and then evaluates its children nodes. While comparing the MDS of every child directory node and the MDS of the given range query, the MDSs need to be converted to be at the same hierarchy level for each dimension. The MDS in lower hierarchy levels will be converted to an MDS in higher hierarchy levels. Two cases can happen in this step.
• If the child directory node’s MDS is contained in the range query’s MDS, then the child’s measure is added to the results.
• If the child node’s MDS has overlap with the query MDS, then the child will be pushed to the stack.
During the time of searching in a subtree, a directory node A of this subtree could be modified with a new timestamp if a parallel insertion happens. So when A’s corresponded
original directory node Ast ackwith earlier timestamp is popped up from the stack, we know a new data node has been inserted into the substree rooted at A or its siblings’ subtrees if node splits are performed. The directory node A in the tree and its sibling nodes need to be evaluated and their subtrees should be re-visited. Therefore, the algorithm traces node A’s right sibling directory nodes along the right sibling links and pushes any right sibling directory nodes whose timestamp is later than or equal to the timestamp of node Ast ack in the stack as well as the modified directory node A. In figure 5.3 (b), when a query traverses the tree, D1 and its children are pushed into the stack. When evaluating D2 and D3, D1 gets split due to a new insertion. Now D1’s timestamp has been updated. When D1 in the stack is popped up and compared with D1 in the current tree, timestamp of D1 in the stack has earlier time than the timestamp of D1 in the current tree has, therefore, we know a new data has been inserted. D1, D1’s right sibling D4 and D4’s child D3 will be pushed into stack for revisiting so that the newly inserted data can be visited and evaluated. D2, the child of D1, will be also revisited when D1 in the stack is popped from the stack for evaluation again. The steps are repeated until the stack is empty.
The PDC-tree is the extended version of the sequential DC-tree. TimestampandLink to sibling directory nodesare added in the data structure of the PDC-tree in order to detect any newly inserted data. The system acquires a minimal locking schema to execute data insertions and queries in parallel. At most two nodes (current node in process and its parent node) are locked at any point in time to perform insertions or updates. The experiments of this method were performed on machines having up to 20-core processors. The paper provided the results and demonstrated significant performance improvement on executing insertions and range queries in parallel. By increasing the number of cores, the system can achieve close to linear speedup. It has the potential to enable the large scale OLAP to become a real-time system.
5.3 The performance experiments of the PDC-tree on cloud platforms
The Parallel DC-tree was implemented in C++ with OpenMP by Hamed Zoboli. In order to further evaluate the performance of this Parallel DC-tree, I conducted many tests by changing the values of system parameters, for examples, the number of insertions, queries, threads, the size of initial data rows as well as the children capacity of a directory node.
32 The purpose of those tests is to observe the impact of these parameters on the tree behavior and to evaluate the performance of the PDC-tree on cloud frameworks. All the tests are performed on different instances provided by the Amazon web services (AWS) and the Ontario Research and Education VCL cloud (VCL).
5.3.1 Experiments environment and scope • Amazon Elastic Compute cloud
An Amazon Elastic Compute cloud (EC2) is one of the Amazon Web Service (AWS) [3]. EC2 allows users to rent virtual computers (also called instances) to run their own computer applications on. Users can create an EC2 instance with an Amazon Ma-chine Image (AMI). Amazon provides users fully control of their instances. Through web service APIs or accessing the AWS management console, users can boot, stop, resume and terminate any instance as they like. Users also have the root access and can install any software as they want. Amazon provides variety types of instances, operating systems as well as software packages. Several types of EC2 instances were selected to run our experiments on. Table 5.1 is the hardware description of the multi-core instances used in the tests.
M1 and M3 are the standard instances. They are suitable for most general purpose applications; M3 instances have higher CPU performance which are suited better for CPU intensive applications; High-Memory M2 instances contain larger memory sizes for memory-intensive applications such as databases and memory caching ap-plications; High-CPU C1 instances have proportionally more CPU resources than RAM and are well suited for scale out compute-intensive applications. Amazon uses an EC2 Compute Unit (ECU) to measure the CPU capacity. One ECU provides the equivalent CPU capacity of a 1.0-1.2 GHz 2007 Opteron or 2007 Xeon processor [9]. I selected the Ubuntu 12.04 LTS version for the operating system. The source code and the data set were loaded to the cloud machines. I created an AMI of this en-vironment and it was used on every instance for the tests. This provided the same environment for each experiment and limited any unexpected noise from the system and data themselves.
Table 5.1: Specifications of Amazon cloud instances used in our experiments [2] Instance Name Memory(GB) vCPU ECU ECU/Core
M1 Large Instance 7.5 2 4 2
(m1.large)
M1 Extra Large Instance 15 4 8 2 (m1.xlarge)
M3 Extra Large Instance 15 4 13 3.25 (m3.xlarge)
M3 Double Extra Large Instance 30 8 26 3.25 (m3.2xlarge)
High-Memory Extra Large 17 2 6.5 3.25 Instance (m2.xlarge)
High-Memory Double Extra 34 4 13 3.25 Large Instance (m2.2xlarge)
High-Memory Quadruple Extra 68 8 26 3.25 Large Instance (m2.4xlarge)
High-CPU Extra Large Instance 7 8 20 2.5 (c1.xlarge)
Table 5.2: VCL cloud Instances
Instance Name Memory(GB) Cores HPC CentOS 6.3 32 16 Generic Mapping Tools 8 2
• Ontario Research and Education VCL cloud
The other environment is the Ontario Research and Education VCL cloud. This is a cloud environment sponsored by IBM and is used for the research and education purpose for the four universities in Ottawa. There are total seven pre-configured systems and we selected the High Performance Compute (HPC) Centos 6.3 with 16 virtual cores for the experiments and the Generic Mapping Tools API with 2 virtual cores. Each virtual CPU speed is at 2.19 GHz. See Table 5.2.
• Data Set
We used the TPC-DS benchmark, a decision support benchmark standard from Trans-action Processing Performance Council. It includes data schema, data population and
![Table 5.1: Specifications of Amazon cloud instances used in our experiments [2]](https://thumb-us.123doks.com/thumbv2/123dok_us/1562225.2709614/45.918.199.777.182.566/table-specifications-amazon-cloud-instances-used-experiments.webp)
![Figure 5.4: Hierarchy shema and Conceptural Hierarchy for each dimension queries etc. Though the underlying business model of this benchmark is a retail prod-uct supplier, it is designed to represent a modern decision support system [95]](https://thumb-us.123doks.com/thumbv2/123dok_us/1562225.2709614/46.918.188.784.157.567/hierarchy-conceptural-hierarchy-dimension-underlying-business-benchmark-represent.webp)