ISBN 978-92-896-0506-9
Europe 123, 570 01 Thessaloniki (Pylea), GREECE Postal address: PO Box 22427, 551 02 Thessaloniki, GREECE Tel. +30 2310490111, Fax +30 2310490020
E-mail: info@cedefop.europa.eu
www.cedefop.europa.eu
TI-70-07-148-EN-C
This publication provides a detailed technical background and reviews the first skill demand forecast in Europe. It outlines the approach and methods adopted and presents the results for Europe as a whole (EU-25, Norway and Switzerland) as well as for individual countries. It also untangles many data and technical issues and sets out the solutions that were adopted.
The overall aim is to develop a comprehensive system for producing detailed and consistent quantitative projections of future skill needs across Europe. This approach and the set of results provide a sound foundation to take the debate on the changing pattern of demand for skills forward.
FUTURE SKILL NEEDS
IN EUROPE
M E D I U M - T E R M F O R E C A S T BACKGROUND TECHNICAL REPORT
3051 ΕΝ
Free of charge – On request from Cedefop
M E D I U M - T E R M F O R E C A S T
BACKGROUND TECHNICAL REPORT
C
Luxembourg: Publications Office of the European Union, 2009
in Europe:
medium-term forecast
Background
Luxembourg:
Publications Office of the European Union, 2009 ISBN 978-92-896-0506-9
© European Centre for the Development of Vocational Training, 2009 All rights reserved.
Designed by Rooster Design – Greece Printed in the European Union
Cedefop was established in 1975 by Council Regulation (EEC) No 337/75.
Europe 123, 570 01 Thessaloniki (Pylea), GREECE PO Box 22427, 551 02 Thessaloniki, GREECE Tel. +30 2310490111, Fax +30 2310490020 E-mail: info@cedefop.europa.eu www.cedefop.europa.eu
Aviana Bulgarelli, Director Christian Lettmayr, Deputy Director Peter Kreiml, Chair of the Governing Board
Economic crisis, climate change, globalisation, technological change and demographic developments are posing huge challenges to the whole of Europe, offering risks and threats to existing jobs, as well as many new opportunities. Acknowledging the challenge, the 2007 Council resolution on New skills for new jobs (Council of EU, 2007) stressed the need to anticipate the skill needs – and skill gaps – emerging in the European labour market. In the short term, information on emerging skills gaps is crucial, especially as several sectors already face skill shortages. The 2008 Spring European Council called for a comprehensive assessment of skill requirements in Europe up to the year 2020, a request taken up in the June 2008 Council conclusions on anticipating and matching labour market needs, with special emphasis on youth – a jobs and skills initiative. In December 2008, the European Commission launched its communication on New skills for new jobs which will be followed by several actions to match skills better with labour market needs.
Skills are a key driver for European growth, competitiveness and jobs. Information on national skill needs is no longer enough. A European labour market requires European-level information and monitoring. This is even more true in times when Europe and the whole world faces one of the largest economic crisis ever.
The Cedefop medium-term forecast of occupational skill needs in Europe, carried out in 2007, offers for the first time a comprehensive pan-European perspective, providing estimates consistently. These highlight that, while many Member States face particular problems, there are many common features. Globalisation and technological change are expected to continue to have significant impacts on sectoral employment structure and the demands for different types of skills. The continuing shift towards services and the knowledge economy, the catching up process for many countries (shifting patterns of activity and people), implications for occupations and qualifications, including a general increase in the demand for skills with implications for continued investments in skills, education and training, are highlighted. At the same time there are indications of polarisation, with significant growth in employment in some less skilled areas and implications for issues of exclusion and job quality.
The results and methodology presented in this publication represent the most comprehensive and consistent approach to skill projections ever produced for Europe. Although it could not foresee the financial/economic crisis, and even though there are some data problems and questions outstanding, many of the trends identified are robust and not sensitive to the detailed data problems nor to the detailed specifications for models used to explain changing patterns of skill demands with industries. This suggests that such projections can provide valuable and robust information to a broad range of users, from individuals making career choices through to policy-makers operating at the highest strategic level.
From 2010, Cedefop will provide projections not only of skill demand, but also of skill supply, every two years.
Aviana Bulgarelli
Acknowledgements
This report is the result of a team effort and reflects the contributions of all those working on the project, in particular: (a) from Cedefop, Manfred Tessaring and Alena Zukersteinova
for overall coordination and management of the project; (b) from the Institute for Employment Research (IER),
University of Warwick, Rob Wilson for coordinating the core team and producing the expansion demand projections together with Ilias Livanos;
(c) from Cambridge Econometrics, Ben Gardiner, Hector Pollitt and Unnada Chewpreecha for producing the sectoral employment projections;
(d) from the Research Centre for Education and the Labour Market (ROA), Maastricht University, Frank Cörvers and Ben Kriechel for producing the replacement demand projections.
Thanks are also due to expert members of Skillsnet, from individual countries across Europe, who have reviewed and commented on many of the detailed and emerging findings, and provided additional data. They have contributed enormously to the project. The list of experts is provided in Annex.
Cedefop is also grateful to Olga Strietska-Ilina for her valuable contribution and for helpful comments on the project. The comments of Torsten Dunkel from Cedefop are also sincerely acknowledged.
Cedefop has commenced and funded this work. However, the UK Sector Skills Development Agency and the UK Learning and Skills Council also contributed seed corn funding which helped to get the initial ideas underlying this project off the ground.
Finally, thanks are due to Peter Millar of IER who undertook much of the technical analysis required to process the European labour force survey data, and linking this with the results from E3ME.
Acknowledgements 3 Table of contents 4 List of tables 8 List of figures 10 Executive summary 14 Overview 14 Background 14 Modular approach 15
Data sources and preferred employment estimates 16
Key findings 16
Conclusions 19
1. Overview and introduction 20
1.1. Background 20
1.1.1. Introduction 20
1.1.2. Rationale for producing quantitative skills projections 21
1.1.3. General approach 26
1.2. Data issues 29
1.2.1. Labour force surveys versus national
accounts estimates 29
1.2.2. Other data issues 30
1.2.3. Country workbooks 30
1.3. Module 1: macroeconomic and sectoral scenarios 31
1.3.1. E3ME outline and overview 31
1.3.2. Alternative scenarios 33
1.4. Modules 2 and 3: expansion demand by occupation
and qualifications 33
1.4.1. Overview of modules 2 and 3 33
1.4.2. Modelling employment by occupation
and qualification 34
1.5. Module 4: replacement demand 35
2. National accounts versus labour force survey 37
2.1. Introduction 37
2.2. Examining the main differences 38
2.2.1. Methods and data collection 38
2.2.2. Concepts and definitions 39
2.2.2.1. Employment in the LFS 39
2.2.2.2. Employment in NA 40
2.2.2.3. Head count versus job count 40
2.2.2.4. Concepts usually not measured in NA 40
2.2.3. National versus domestic concept 40
2.2.4. Groups not included in the LFS 41
2.2.5. Sectoral and occupational classification 41
2.2.6. Employees of temporary employment agencies 42
2.3. Different aggregate employment levels 42
2.3.1. Differences caused by concept used 42
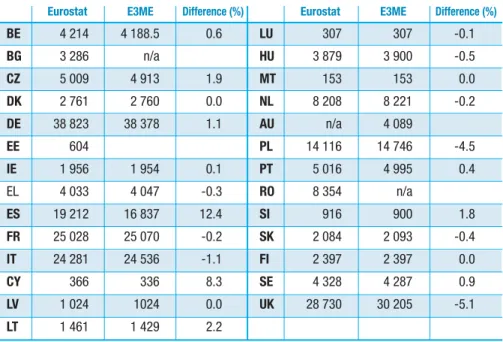
2.3.2. E3ME versus Eurostat estimates 46
2.3.3. NA-LFS differences for sectors 47
2.4. Conclusions 53
3. Macroeconomic and multisectoral scenarios 55
3.1. Introduction 55
3.2. The E3ME 56
3.2.1. General introduction to the E3ME 56
3.2.2. Theoretical background to E3ME 59
3.2.3. E3ME as a regional econometric input-output model 59
3.2.4. E3ME treatment of the labour market 62
3.2.5. Main data sources 64
3.2.6. Technical progress 65
3.2.7. Parameter estimation 65
3.2.8. Employment data 66
3.3. Producing baseline projections 66
3.3.1. Baseline economic forecast 66
3.3.2. Baseline employment projections 68
3.3.3. The role of country experts 69
3.3.4. Defining the scenarios 71
3.4. Summary of results 74
3.4.1. Baseline projections 74
4. Expansion demand and changes in occupational
and qualifications structure 81
4.1. Introduction 81
4.2. Modelling occupational structure in forecasting 82
4.2.1. Most common methods 82
4.2.2. Best practice approaches to modelling
occupational structure 83
4.3. Data available and the ideal specification 88
4.4. Empirical specifications 90
4.5. Data problems implications 93
4.6. Mlogit results for occupations and qualifications 101
4.6.1. Examples of results by selected industries 101
4.6.2. Overview of results for occupations 107
4.6.3. Qualifications results 118
4.7. Comparing methods for projecting shares 122
4.8. Concluding remarks 133
4.9. Algorithm for choice of specification 134
5. Replacement demand module 136
5.1. Introduction 136
5.2. General approach 136
5.3. Data 137
5.3.1. Labour force survey 138
5.3.2. Population forecasts 138
5.3.3. Participation 142
5.4. Methodology 146
5.4.1. Replacement demand components 146
5.4.2. Estimated and projected flows 146
5.5. Challenges 149 5.5.1. Methodological challenges 149 5.5.2. Data challenges 150 5.5.3. Migration 151 5.6. Results 153 5.6.1. Occupations 154 5.6.2. Country workbook 155 5.7. Concluding remarks 155
6. Forecast results 157
6.1. Background 157
6.2. Benchmark macro and sectoral employment scenario 157
6.2.1. Typical national results 157
6.2.1.1. Prospects by sector 158
6.2.1.2. Prospects by occupation and qualification 162
6.2.1.3. Replacement demand 169
6.2.2. Pan-European results 172
6.2.2.1. Prospects by sector 172
6.2.2.2. Prospects by occupation 176
6.2.2.3. Replacement demand 181
6.2.3. Detailed pan-European results by country 184
6.2.3.1. Prospects by sector 184
6.2.3.2. Prospects by occupation 192
6.2.3.3. Replacement demand 197
6.3. Alternative pan-European macro scenarios 200
6.3.1. Background 200
6.3.1.1. Sensitivity by sector 200
6.3.1.2. Sensitivity by occupation 202
6.3.1.3. Sensitivity of replacement demand 205
6.3.2. Sensitivity by qualifications 207
7. Conclusions and the way forward 212
7.1. Summary 212
7.2. Key findings 213
7.3. Policy implications 215
7.4. Outstanding data problems and scope for refinement 217
7.5. Continuing dialogue and country expert input 217
7.6. The way forward 218
Annex – List of contributing country experts 220
References 222
List of tables
1.1 Arguments for and against employment and skill needs
forecasting 22
2.1 NA estimates national concept versus domestic concept 43
2.2 LFS (national) and NA (national) differences in employment
across EU-27 44
2.3 LFS (national) and NA (domestic) differences in employment
across EU-27 (domestic) 45
2.4 2005 E3ME and Eurostat estimates of NA employment 46
2.5 Differences between LFS and NA employment for six broad
sectors of economic activity for each EU-25 Member State 47
3.1 E3ME industry classification 57
3.2 Baseline economic results 68
3.3 Scenario B: optimistic 70
3.4 Scenario C: pessimistic 72
3.5 Model variables changed in the positive and negative
scenarios, 2007-20 73
3.6 Baseline employment (average annual growth rate) 74
3.7 Employment comparison between scenarios 77
4.1 List of variables used 85
4.2 Breaks and discontinuities in the LFS data 95
4.3 Multinomial logistic regression output, printing
and publishing, Greece 103
4.4 Multinomial logistic regression output, banking
and finance, Greece 104
4.5 Multinomial logistic regression output, printing and
publishing, UK 105
4.6 Multinomial logistic regression output, banking and
finance, UK 106
4.7 Occupational structure, all industries, logistic and mlogit,
2006, 2010, 2015, Greece 127
4.8 Occupational structure, all industries, simple extrapolation,
2006, 2010, 2015, Greece 128
4.9 Occupational share, all industries, 2015, Greece 129
5.1 Data availability 145
5.2 Net migration by country 2000-05 152
6.1 Employment trends by broad sector, Greece 159
6.3 Employment trends by industry, changes, Greece 163
6.4 Employment trends (levels) by occupation,
broad group, Greece 164
6.5 Employment trends (shares) by occupation,
broad group, Greece 165
6.6 Employment growth by occupation, broad group, Greece 166
6.7 Employment change by occupation, broad group, Greece 167
6.8 Employment by qualification/level of education, Greece 168
6.9 Replacement demand by occupation, broad group, Greece 170
6.10 Employment trends by broad sector, EU-25+ 173
6.11 Employment trends by industry, EU-25+ 174
6.12 Employment trends by industry, changes, EU-25+ 175
6.13 Employment trends (levels) by occupation,
broad group, EU-25+ 177
6.14 Employment trends (shares) by occupation,
broad group, EU-25+ 178
6.15 Employment trends (growth) by occupation,
broad group, EU-25+ 179
6.16 Employment trends (change) by occupation,
broad group, EU-25+ 180
6.17 Replacement demand by occupation,
broad group, EU-25+ 182
6.18 Changes in employment by country 185
6.19 Changes in employment by country, primary sector
and utilities 186
6.20 Changes in employment by country, manufacturing 187
6.21 Changes in employment by country, construction 188
6.22 Changes in employment by country, distribution
and transport 189
6.23 Changes in employment by country, business
and other services 190
6.24 Changes in employment by country, non-marketed services 191
6.25 Occupational employment by country 2006 (ʼ000) 193
6.26 Projected employment by country and occupation (ʼ000) 194
6.27 Projected employment growth by country and occupation (%) 195
6.28 Projected employment growth (annual %) 196
6.29 Replacement demand by country and occupation (ʼ000) 198
6.30 Total job openings by country and occupation (ʼ000) 199
6.32 Employment trends by broad occupation,
different scenarios, EU-25+ 204
6.33 Replacement demand by broad occupation based on LFS,
EU-25+ 206
6.34 Expansion demand by qualification, different scenarios,
EU-25+ 209
6.35 Total requirements by qualification, scenarios, EU-25+ 211
List of figures
1.1 Overview of the modular approach to skills forecasting
(the framework) 28
3.1 E3ME as a regional econometric input-output model 60
3.2 Baseline employment: average annual growth rate between
2007 and 2015 75
3.3 Baseline employment: average annual growth rate between
2007 and 2015 by main sector 76
3.4 Pessimistic scenario employment: average annual growth
rate between 2007 and 2015 79
3.5 Optimistic scenario employment: average annual growth
rate between 2007 and 2015 80
4.1 Occupational share, all industries, 1993-2006, UK 96
4.2 Occupational share, all industries, 1997-2006,
Czech Republic 96
4.3 Occupational share, all industries, 1997-2006, France 97
4.4 Occupational share, all industries, 1993-2006, Ireland 98
4.5 Occupational share, all industries, 1993-2006, Italy 98
4.6 Occupational share, past trends and projections
for all industries, 1992-2020, France 99
4.7 Occupational share, coal industries, 1993-2006, UK 100
4.8 Occupational share, past trends and projections for retailing,
1970-20, Ireland 100
4.9 Indicative occupational share for top 10 occupations,
all industries, 1993-2015, UK 108
4.10 Indicative occupational share for top 10 occupations,
all industries, 1993-2015, Greece 109
4.11 Indicative occupational share for top 10 occupations,
4.12 Indicative occupational share for top 10 occupations,
all industries, 1993-2015, Poland 111
4.13 Indicative occupational share for top 10 occupations,
banking and finance, 1993-2015, Greece 112
4.14 Indicative occupational share for top 10 occupations,
retailing, 1993-2015, Greece 112
4.15 Indicative occupational share for top 10 occupations,
education, 1993-2015, Greece 113
4.16 Indicative occupational share for top 10 occupations,
construction, 1993-2015, Greece 114
4.17 Indicative occupational share for top 10 occupations,
distribution, 1993-2015, Greece 114
4.18 Indicative occupational share for top 10 occupations,
communications, 1993-2015, UK 115
4.19 Indicative occupational share for top 10 occupations,
communications, 1993-2015, Italy 116
4.20 Indicative occupational share for top 10 occupations,
communications, 1993-2015, Latvia 116
4.21 Indicative occupational share for top 10 occupations,
communications, 1993-2015, Poland 117
4.22 Qualification share, all industries and occupations,
1993-2015, Greece 118
4.23 Qualification share, all industries and occupations,
1993-2015, Ireland 119
4.24 Qualification share, all industries and occupations,
1993-2015, Cyprus 119
4.25 Qualification share, all industries and occupations,
1993-2015, UK 119
4.26 Qualification share, corporate managers, all industries,
1993-2015, Greece 120
4.27 Qualification share, physical, mathematical and engineering
sciences professionals, all industries, 1993-2015, Greece 120
4.28 Qualification share, physical and engineering sciences
associate professionals, all industries, 1993-2015, Greece 121
4.29 Qualification share, office clerks, all industries,
1993-2015, Greece 121
4.30 Qualification share, sales and services elementary
4.31 Occupational structure, constructions, mlogit,
1993-2015, Greece 123
4.32 Occupational structure, constructions, logistic function,
1993-2015, Greece 124
4.33 Occupational structure, constructions, retailing,
1993-2015, Greece 124
4.34 Occupational structure, constructions, retailing logistic
function, 1993-2015, Greece 125
4.35 Occupational structure, constructions, distribution, mlogit,
1993-2015, Greece 125
4.36 Occupational structure, constructions, distribution, logistic,
1993-2015, Greece 126
4.37 Projected occupational share using different methods,
2015, Greece 130
4.38 Projected occupational share using different methods,
managers, 2015, Greece 130
4.39 Projected occupational share using different methods,
professionals, 2015, Greece 130
4.40 Projected occupational share using different methods,
associates professionals, 2015, Greece 131
4.41 Projected occupational share using different methods,
clerks, 2015, Greece 131
4.42 Projected occupational share using different methods,
service workers, 2015, Greece 131
4.43 Projected occupational share using different methods,
trade workers, 2015, Greece 132
4.44 Projected occupational share using different methods,
machinery and plant operators, 2015, Greece 132
4.45 Projected occupational share using different methods,
elementary occupations, 2015, Greece 132
4.46 Occupational change 2006-15, mlogit versus logistic,
Greece 132
5.1 Annual predicted changes in the population 2005-15 139
5.2 Population forecast by age group for 2005, 2010, 2015 140
5.3 Participation rates across countries 143
5.4 Schematic of replacement demand 147
5.5 Total annual net replacement demand by country 154
6.1 Employment trends by broad sector, Greece 158
6.3 Employment trends by qualification/level of education, Greece 169
6.4 Employment trends by broad sector, EU-25+ 172
6.5 Employment trends by broad occupation, EU-25+ 176
6.6 Employment trends by broad sector, different scenarios,
EU-25+ 201
6.7 Employment trends by broad occupation, different scenarios,
EU-25+ 203
6.8 Total requirements by broad occupation, different scenarios,
EU-25+ 207
6.9 Expansion demand by qualification, different scenarios,
EU-25+ 208
6.10 Total requirements by qualification, different scenarios,
Overview
This publication provides a detailed technical background and an overview of the results of the Cedefop Skillsnet project on developing a medium-term forecast of occupational skill needs in Europe, carried out in 2007. It outlines the approach that has been adopted and presents the final results. It also highlights the many data and technical problems that had to be untangled and sets out the solutions that have been adopted.
The overall aim of the project has been to develop a new system for producing detailed and consistent, quantitative projections of future skill needs across Europe. Given the difficulties faced, a certain amount of pragmatism has been required, but this set of results provides a sound foundation to take the debate about the changing pattern of demand for skills in Europe to a new level.
Background
The Lisbon agenda has emphasised the need for Europe to anticipate changing skill needs. Globalisation, technological change and demographic developments (including ageing and migration) are posing huge challenges, offering both risks and opportunities.
The need for regular forward-looking assessments has received further impetus following setting of employment targets and related policies as part of the Lisbon strategy. Such results can help to inform active labour-market policies to retrain the unemployed or reintegrate individuals who are economically inactive; this is also increasingly important given the rising levels of migration flows between countries. Labour mobility between European countries is, if anything, likely to increase further. International labour mobility can help to resolve labour-market bottlenecks and deal with surpluses. Information on future skill needs in Europe can help, therefore, to orientate and guide policy, and inform individuals about developments. Many countries are undertaking this kind of work. This project offers a pan-European perspective, providing estimates consistently for all Members States.
While it is generally accepted that, in a market economy, it is not possible to predict the future precisely, the need to make strategic plans and choices which can influence the future paths of the economy and labour market is widely accepted. Such plans need to be guided by robust labour-market information and intelligence, including a forward-looking element. This needs to be based on regular, systematic and quantitative approaches to forecasting and scenario development. Skills are a key part of the infrastructure of the economy, and the choices made by both policy-makers and individuals about investment in education and skills can help to determine the path the economy takes. These choices need to be guided by good labour-market information and intelligence.
A range of approaches to assessing future skill needs is required. These need to encompass both quantitative and qualitative methods and to serve a range of audiences such as policy-makers, stakeholders, social partners, practitioners and individuals. This project is concerned with developing quantitative models and projections. The results are aimed at all these audiences, across all Member States (plus some associated members). The present analysis covers EU-25 (before the accession of Bulgaria and Romania) plus Norway and Switzerland referred to henceforth as EU-25+.
Modular approach
The project has adopted a modular approach to anticipating Europeʼs future skill needs, involving four main elements. These include a multisectoral macroeconomic model, occupational and qualifications expansion demand modules and a replacement demand module. The advantage of a modular approach is that it promotes independent development and improvement of the different parts of the system. In combination, the modules provide a general framework for regular quantitative projections of changing skill needs. This initial phase of the project has involved developing the basic database and tools required to produce a comprehensive and consistent set of skill projections for all EU-25 Member States. It is based on data from Eurostat sources, adopting common methods and models. Together the database and models constitute the framework.
The framework has been designed to facilitate further development and customisation. In particular, it allows for refinement of the modelling approaches used for projecting occupational, qualification structures and replacement demand. It also allows for improvement or replacement of data
for particular countries or sectors where there are concerns about data quality and robustness. The present results began a process of dialogue with experts from other countries who have much greater knowledge about employment trends in their own countries. This framework provides an opportunity for such knowledge to be built in to future assessments efficiently and transparently.
Data sources and preferred employment
estimates
A key issue addressed in the project is the best data to be used to measure employment structure in Europe in a common framework. Historically, most countries have invested considerable resources in developing data for their national accounts (NA). In many respects such estimates of employment are to be preferred as they are consistent with other key economic indicators such as output and productivity. More recently, greater emphasis has been placed on estimates of employment based on the European labour force survey (LFS). These have the considerable advantage of being broadly consistent across countries and providing a measure of employment structure by skill (occupation and qualification) that is not available from the NA-based estimates.
The numbers presented by sector, as used in the multi-sectoral macroeconomic model, are based on Eurostat NA, rather than the LFS-based estimates that some are more familiar with. There are some significant discrepancies between these two sources which remain unresolved. However, the framework developed allows for alternative data and assumptions to be incorporated with relative ease. Therefore, two sets of results have been developed to benchmark sectoral estimates, one based on NAs, the other on LFS data. The main emphasis in this report is on the former, although it also compares the two. In broad terms, the implications for changing patterns of skills are not that different between the two alternatives.
Key findings
The analysis confirms that Europe has experienced continuing shifts away from the primary sector (especially agriculture) and traditional manufacturing industries towards services and the knowledge-intensive economy in general, and that these trends are likely to continue to be a key feature over the coming
decade. This applies within individual countries and in how things are changing between European countries. Although many of the new Members States still rely to a much greater extent on agriculture and manufacturing for employment, it is clearly changing rapidly. It is partly an internal process, particular to each country, but it also reflects shifting patterns of activity and people across borders as capital and labour adjust to the political and economic changes. In some countries this is leading to changes in the opposite direction as some activities in manufacturing have been transferred eastwards and southwards within Europe. Overall, the results of this forecast suggest that these patterns of change will continue in the immediate future, and that these will be more of an evolutionary rather than revolutionary nature. Substantial change is in prospect with over 13 million additional jobs being created between 2006 and 2015 in EU-25+. This is despite the loss of well over two million jobs in the primary sector and almost half a million in manufacturing. Distribution, transport, hotels and catering together are projected to see employment grow by 3.5 million over the next decade, while non-marketed services are expected to increase by only slightly less. Business and miscellaneous services has the best prospects, with almost nine million additional jobs being created between 2006 and 2015.
The projected sectoral changes taking place will have significant implications for occupational skills needed in the future. These will be reinforced by changes in the way work is organised and jobs are performed within sectors. The main implications are continuing growth in demand for many highly- and medium-skilled workers but also for some lower-skilled occupations. Almost 40 % of people are currently employed in higher level jobs such as management, professional work of one kind or another or technical support of those activities. These areas are all expected to experience increased demand over the next decade. In contrast, jobs requiring traditional agricultural skilled workers, several other craft and related skills and clerical skills will decline in number. There will, however, be significant expansion in the numbers of jobs for many service workers, especially in retail and distribution, and also for some elementary occupations requiring little or no formal skills.
This has been characterised as polarisation in the demand for skills. It raises concerns about job quality and mismatch, and related problems of social equality and exclusion for many of Europeʼs citizens. The structural and other changes taking place will, if these trends continue, create many jobs at higher levels but also large numbers at the lower end of the job spectrum, with low pay and poor terms and conditions. This will pose significant problems for
policy-makers concerned with issues of equity and social cohesion. The study emphasises that even in those areas where employment levels are expected to fall there will nevertheless be significant job openings and needs for education and training. This affects both sectors and occupations.
Despite the structural changes projected, primary and manufacturing sectors will remain viable sources of jobs and crucial components of the economy. Similarly, there are significant replacement demand by occupation (to replace those leaving for retirement or other reasons) even for those occupations where employment levels are projected to fall sharply. It is important that policy-makers, education and training providers and individual citizens are aware that many of those occupations likely to face job losses will remain viable sources of employment and make important contributions to the economy for many years to come.
The nature and skill requirements of these jobs will change and their development should be analysed. This includes the formal qualifications typically required to undertake such jobs. While there is no simple one-to-one relationship between occupation and qualification, it is possible to explore how these are changing over time. The analysis focuses on three levels (high, medium and low qualifications). The results highlight the general increase in qualification levels across most jobs. At the broadest level the projected changes are even more dramatic than for occupations. In total, the net employment increase in Europe of over 13 million jobs between 2006 and 2015 comprises increases of almost 12.5 million jobs at the highest qualification level (ISCED 5 and 6) and almost 9.5 million jobs at medium level (ISCED 3 and 4), offset by a sharp decline of 8.5 million jobs for those with no or few formal qualifications (ISCED 0 to 2). In part, these changes reflect the expected continued growth in supply of people who have acquired formal qualifications. While some have argued that there is the possibility of oversupply in some areas, there is also considerable evidence of increasing needs for, and even shortages of, formal qualifications in many areas.
Conclusions
The projections presented in this publication are the final results. Often the data used are still subject to some uncertainty; this reflects the general problems of pushing the LFS-based information to the limits in terms of the amount of detail it can reveal. As the results are reported in this publication, a completely revised set of workbooks containing the data for each country has been produced. These have been made available to country experts to enable them to comment in detail on the results. They represent the most comprehensive and consistent set of skill projections ever produced for Europe
There are still many data problems and questions outstanding. These are especially severe for the smaller countries where the sample sizes in the LFS are often inadequate to provide robust estimates. Even for many of the larger countries there are problems with the data which can probably only be addressed by detailed dialogue between country experts and the relevant statistical authorities.
Despite these reservations, many of the trends emerging from the analysis are robust and not sensitive to the detailed problems of many of the data used, nor the detailed specifications for models used to explain changing patterns of skill demand with industries. This suggests that such projections can provide valuable information to a broad range of users, from individuals making career choices through to policy-makers operating at the highest strategic level.
Such pan-European projections are not a substitute for what is being done nationally. Rather, they can complement this, offering for the first time a broad and consistent overview for the whole of Europe. While this might not be able to compete with what is being done for some countries, (where it is based on many years investment in data, systems and knowledge), it can provide a common framework within which these more detailed analyses can be compared.
IER, University of Warwick
1.1.
Background
1.1.1. Introduction
This publication provides a detailed technical background and summary of the results of the Cedefop Skillsnet project on developing a medium-term forecast of occupational skill needs in Europe. It outlines the approach that has been adopted and presents the final results. It also highlights the many data and technical problems that had to be untangled and sets out the solutions that have been adopted.
The overall aim of the project has been to develop a new system for producing detailed and consistent, quantitative projections of future skill needs across Europe. Given the difficulties faced, a certain amount of pragmatism has been required, but this set of results provides a sound foundation to take the debate about changing pattern of demand for skills in Europe to a new level.
The publication is divided into seven chapters. The first chapter provides an overview and introduction to the whole project, including the rationale for producing quantitative skills projections. It discusses a key issue which the project has had to address on what are the best data to use to measure changing employment structure.
Detailed data issues are discussed in Chapter 2. In particular, there is the issue of employment estimates based on national accounts (NA) and those based on the labour force survey (LFS). The chapter explores differences in concepts, definitions and numbers of employment in these two data sets.
Chapter 3 provides a detailed overview of module 1, the macroeconomic model, and the results it produces. This includes a discussion on developing alternative scenarios. A criticism often made of quantitative projections is that they focus too much on a single point forecast. One way of dealing with this
(1) This chapter would not have been possible without the contribution of all the other team members,
criticism is to present a range of alternative views which can encompass the most likely outcomes.
Chapter 4 focuses on modules 2 and 3, which deal with the modelling of expansion demand. Different approaches to modelling the changing occupational and qualification patterns within sectors are discussed in detail. This considers the ideal theoretical approach to such issues, and the limitations posed by data availability and other problems.
Chapter 5 deals with the topic of replacement demand. It is argued that these are at least as important as expansion demand. However, it is also recognised that there are many problems in producing robust estimates. Again data limitations constrain what is feasible. Replacement demand is dealt with in module 4. This chapter sets out discussion of the overall approach to these issues, the problems and pitfalls faced by the research team and how these have been tackled.
Chapter 6 presents the final series of results from the project. These draw on the most recent macroeconomic scenarios from E3ME (energy-environment-economy model for Europe), in combination with other assumptions from each of the other modules. The discussion in this section also considers the sensitivity of the results to various other assumptions, including the choice of NA versus LFS sectoral employment estimates.
The last chapter sets out conclusions from the project, some outstanding issues and possible next steps of future work.
1.1.2. Rationale for producing quantitative skills projections
The Lisbon agenda has stressed the need to place more emphasis on anticipating changing skill and competence needs in Europe. Climate change, globalisation, technological change and demographic developments (including migration) are posing huge challenges. These represent risks and threats, but also opportunities. Identifying key trends and providing accurate and timely labour-market information and intelligence to those making choices and decisions is crucial to identifying possible new jobs for Europe, and jobs under threat from structural change. The most recent revision to the Integrated employment guidelines(Council of EU, 2005) states that anticipating future skill needs should be a top priority if Europe is to respond successfully to the challenges it faces, both externally (to compete successfully in world markets) and internally (to ensure that all its population shares the benefits of economic growth) (European Commission, 2007). The Council resolution of 15 November 2007 (Council of EU, 2007), recently adopted, has launched large-scale activity on new skills for new jobs, as well as reemphasising the need to
improve the labour-market information and intelligence available to help guide the decisions of Member State policy-makers and individual citizens.
Nobody can predict the future precisely, but everyone can plan to make the most of the opportunities they face, and to avoid the worst problems. Projections can serve as an early warning fostering strategies to prevent or alleviate future problems. Such individual strategic plans and choices will shape the future path taken by Europe as a whole. These plans and choices need to be guided by robust labour-market information and intelligence. The key question, therefore, is not whether we should try to anticipate the future, but rather how to go about it. Rather than relying on luck and individualsʼ own (possibly ill-informed) judgements, the philosophy underlying this project is that we should apply transparent, systematic scientific and quantitative methods consistently across Europe. This needs to be pan-European because problems are not confined within narrow national borders. The increasing mobility of labour across national boundaries, resulting from the formation of the single market and related issues such as migration, emphasise the need for a pan-European perspective.
The case for and against quantitative employment projections has been debated for many years. Table 1.1 discusses some pros and cons associated with employment and skill forecasts; it also highlights some of their limitations. However, the revealed preferences of governments and many other organisations across the world, who have invested considerable resources in such activities, suggest that they meet a real need.
Table 1.1. Arguments for and against employment and skill needs forecasting
Against
National employment planning is irrelevant because markets will respond of their own accord to ensure that the correct skills are produced.
The fixed coefficient approach is invalid since it ignores the possibilities of substituting skills and wage adjustments. Inaccuracies in the assumptions will be compounded, making the projections of little value.
For
The evidence of market failures (unemployment or skill shortages) and long time lags in training may lead to imbalances or mismatch in labour markets which could be prevented by policies including quantitative forecasts.
Skill substitution processes and wage structures change slowly. Improvements in methodology allow for explicit consideration of substitution in forecasting models.
Forecasting inaccuracy applies to any economic or other projection; employment forecasts are not significantly more inaccurate than others. Besides, there is evidence that
decision-Skill demand forecasts focus solely on economic conside -rations without reference to wider social implications.
Past imbalances (e.g. over-qualification, unemployment, shorta ges) are ignored and may be carried forward into the projections.
The approach does not allow for interaction between skill supply and demand factors.
Forecasts, once made public, could change the behaviour of actors and thus invalidate them -selves.
Forecast categories are more or less large aggregates and cannot be used for specific decision-making (e.g. individual choice of education and training).
makers have found these useful. These forecasts are not deterministic but indicate possible developments and thus ways to shape the future. Further, the modelling of alternative scenarios/variants with different assumptions should indicate a plausible range of future developments.
Other disciplines have been introduced (e.g. in qualitative approaches). Interpreting results should bear in mind that economic development is only one influence among others. Quantitative and qualitative approaches are complements, not substitutes.
Although methodologies have been improved, this remains a crucial point. However, to consider imbalances within forecasts (if these are generally considered as useful), would imply the need to predict qualitative imbalances in the longer term. This would require assumptions which are as disputable as any others. This is a challenge to forecasters to improve methodologies. First attempts have been made to do this. One of the problems is that adaptations to future imbalances will change both skill supply and demand and require endless iterations of the calculation which may – dependent on the elasticities on both sides – lead to long-term equilibrium or exploding imbalances. If it is a policy goal to inform the public on possible future developments (risks or opportunities), forecast results should not be kept secret. However, results should be interpreted (by the media in particular) carefully. They should be presented as possible and not as inevitable futures, dependent on the underlying assumptions used to generate them. They should be treated as just one information set among many others. If a forecast warns against undesired developments and respective actions are taken, it may be desirable for the forecast to turn out to be incorrect if undesired outcomes are avoided.
Forecasts are only one information set among others for individual training and occupational decisions, illustrating general trends in labour markets and thus helping to reduce uncertainty. They cannot predict the employment prospective for an individual, but can be used as one information tool for individual guidance, such as pointing to the high risks of renouncing qualified education and training or by illustrating job opportunities in certain fields. Only in centrally planned economies can uncertainty be removed, at the expense of individual freedom, self-responsibility and social change.
Against
Source: Cedefop (2001) with modifications by Cedefop and the present authors.
As the employment guidelines emphasise, there is an urgent need for regular and continuous anticipation, which all Member States need to take seriously. The present project is not a substitute for what needs to be done by individual States but for the first time it presents a consistent attempt to assess skill needs across the whole of Europe.
Anticipation is not a one-off exercise. It needs to be a continuous and regular process. Only if this is the case can it properly inform policy-makers and citizens about the changes they are likely to face. Economic restructuring is itself a normal and continuous process, some sectors change more rapidly than others. We cannot ʻhold back the economic tidesʼ that cause this continual change, but we can help our citizens and other decision-makers to learn to ʻsurf the wavesʼ by anticipating likely future developments. Other aspects are also important. Ageing and poorly qualified workforces militate against innovation, learning, networking and anticipation, but early warning and involvement of the social partners can help to oil the wheels of change. It is not practical to pick winners, but it is possible to create an environment conducive to change and which deals with the inevitable casualties. We need to create systems that encourage flexibility and adaptability, as well as entrepreneurship and innovation, and enable industries, companies (and individuals) to reinvent themselves and to contribute to shaping the future. For example, sectors that might appear to be ʻdead ducksʼ can often have a second lease of life by restructuring themselves and developing new angles and niches at the higher end of the value-added spectrum. Anticipation is needed to foresee the problems and to act in good time, devising strategies, technologies, etc., to cope, often right down the supply chain. This is often best handled at a sub-country or regional level. There is a need for regions to be proactive but with a strong sectoral focus. Safeguarding jobs often requires diversification. It also requires approaches to anticipation that recognise the importance of economic links.
There is no single solution to the question of how to anticipate: a multifaceted approach is required. Quantitative and qualitative approaches to anticipation are complements not substitutes or alternatives. Qualitative approaches, such as qualitative inquiry and scenario development, case studies and the like, are needed to gain more insight into underlying processes and to aspects which lie beyond numerical and statistical modelling. Examples are ʻsoft skillsʼ and competences, perceptions, interpersonal interactions, mentalities, expectations, etc., which influence the behaviour of people. Quantitative methods, such as those using the types of formal models adopted here, are typically based on empirical evidence from past behaviour, using
econometric analysis and statistically significant relationships (not simply extrapolations). Such quantitative approaches can present a consistent view of one possible future that can be useful to a wide audience.
In combination, the two broad approaches can provide a comprehensive picture of future possibilities useful to different users. It is not just policy-makers who require this kind of information but also other stakeholders such as social partners, practitioners and individuals. Together, and in combination, qualitative and quantitative approaches offer the best hope of providing different audiences with the information they need to make rational and optimal choices. Skills are a key part of the economic infrastructure and the choices made by the various actors in the labour market will help to determine the path the economy takes.
Such projections should not be seen as deterministic nor prescriptive; structural changes and their implications for changing skill needs cannot be mechanistically predicted. Neither qualitative scenarios nor quantitative forecasts should be seen as precise predictions; they are more about preparation for what might come. From a policy perspective they are, themselves, ʻenablersʼ of future opportunities. Questioning and discussing possible futures is a way of building them (make choices and shaping actions) and emphasises the need to assess and modify forecasts regularly and continuously.
With the methods deployed in this project it is possible to identify the main employment trends in Europe: where jobs may be created, as well as anticipating job losses caused by restructuring. Emphasis should not be put on where jobs are disappearing, as lobbying from sectors in decline may result in a biased view. A falling tree makes a loud crash, while there is little sound as the forest grows.
Anticipating skill needs is not a panacea. Policies relating to trade rules, finance, etc., are also crucially important to ensuring that Europe can compete effectively in the 21st century (as are intellectual capital and property rights). But anticipating changing skill needs, together with other aspects of economic and sectoral development, can help policy-makers and others to recognise where skills are the crucial factor.
Therefore, the prime aim of anticipating changing skill needs is to build capacity, improve the capability to undertake such work across Europe in a regular way, and improve understanding of the main drivers of change.
1.1.3. General approach
This section sets out a systematic approach to analysing the future skill needs of EU Member States, using common models and data sources. It establishes a general framework that can act as a starting point for further development.
The aim was to deliver the following main objectives:
(a) to develop a robust and consistent occupational database and related projection models which permitting benchmark projections by occupation, sector and qualifications across EU-25 (as of 2006, before the accession of Bulgaria, Romania) plus Norway and Switzerland (2). These countries
are referred to as EU-25+.
(b) to develop a full set of projections using these models and data looking up to 10 years ahead and also include a range of alternative scenarios using the database and tools established.
(c) to present these results in such a way as to initiate and assist systematic dialogue with other country experts and stakeholders.
The project was carried out by Cedefop in cooperation with a research team involving the Warwick Institute for Employment Research (IER), Cambridge Econometrics and the Research Centre for Education and the Labour Market, Maastricht (ROA). Each group was responsible for particular aspects of the project. These are distinguished as separate modules and chapters of this publication.
Previous reviews (Wilson et al., 2004) suggest that best practice worldwide in quantitative skill projections involves large scale, multi-sectoral models. These provide essential understanding of how structural economic and technological changes affect the demand for skills. The typical quantitative modelling approach, therefore, involves three main elements.
The first key component is a multi-sectoral macroeconomic model of some kind, usually built around a Leontief input-output table, which considers the links between sectors. Such models are usually estimated using complex and sophisticated econometric methods. The key outputs from these models, as far as the present project is concerned, are consistent projections of employment levels by sector. In addition to providing projections of sectoral employment, such models can be used for a many other purposes, including more general macroeconomic policy analysis. This may be significant for future use of the new framework which this project has delivered.
(2) It is hoped that the models can be extended to include the most recent accession countries in the
The second key component is a module, or set of modules, which translate the employment projections from the multi-sectoral model into implications for the demand for skills. These elements vary considerably across countries. Most commonly, this aspect is much less sophisticated, mainly caused by the more limited nature of data available on skills. Usually, the focus of attention is limited to occupational employment structures within sectors. The trends in such structures are often analysed using simple techniques rather than more sophisticated econometric methods. Forecasts of expansion demand (net changes in occupational employment which can be negative) are based on an analysis of changing occupational patterns of employment within sectors.
The third key component relates to replacement demand. On the demand side of the labour market, expansion demand resulting from future changes in employment levels should be distinguished from replacement demand caused by retirement and various types of mobility (when workers leave the employed work force for whatever reason).
The project has adopted a modular approach to exploring skill needs focusing on the key component elements set out above (Figure 1.1). Four separate modules can be distinguished:
(a) module 1: a set of multi-sectoral macroeconomic forecasts, based on the preferred macroeconomic model (E3ME);
(b) module 2: an occupational expansion demand model (EDMOD), based on LFS data;
(c) module 3: a qualifications expansion demand module (QMOD), based on similar data sources;
(d) module 4: a replacement demand module (RDMOD).
Module 1 is based on the existing and well-established pan-European multi-sectoral macroeconomic model (E3ME), developed by Cambridge Econometrics and its partners around Europe. This is described in greater detail in Chapter 3, along with the underlying assumptions made about the main external influences on the economy and the labour market. The model delivers a set of consistent sectoral employment projections. In addition, two alternative scenarios are considered to show the sensitivity of the outcomes to different assumptions.
Module 2 (EDMOD) builds upon previous work in individual countries. It focuses on the factors influencing occupational structure within sectors. It delivers a comprehensive and consistent set of expansion demand estimates, based on LFS data from Eurostat.
Module 3 (QMOD) focuses on the implications for formal qualifications, adopting similar procedures and data to EDMOD. The data available on
qualifications are even weaker than for occupations, with many problems of consistency across countries and over time, as well as many gaps. Problems of consistency in classification across countries are more severe here than in any other area. Modules 2 and 3 are described in detail in Chapter 4.
Module 4 (RDMOD) again on builds on previous research efforts to deliver a set of replacement demand estimates. Without estimates of replacement needs, projections of expansion demands are of little value. However, data on some aspects of replacement demand are in many respects weaker than those on occupational employment structure. Nevertheless, the analysis conducted in Chapter 5 suggests that sufficient information exists to provide at least a broad indication of the likely scale of replacement demand.
In combination, the four modules deliver a comprehensive and consistent detailed picture of job openings across Europe. Job openings are defined as the sum of expansion and replacement demand.
Figure 1.1. Overview of the modular approach to skills forecasting (the framework)
The advantages of a modular approach are that it facilitates independent development and improvement of individual parts of the system. In combination, the modules represent a general framework, within which it is easy to plug in alternative assumptions and parameters. The results are brought together in a set of country workbooks. These include a detailed and consistent set of historical data and a benchmark projection. Country workbooks and their accessibility are discussed in Section 1.2.3.
The aim of the present project is not to substitute for national forecasts, nor to seek to criticise or undermine them. It is to present an alternative view, set within a much broader European context that puts the national results into perspective. The longer-term aim is to work with country experts to reach consensus on historical patterns and the main underlying trends.
1.2.
Data issues
1.2.1. Labour force surveys versus national accounts estimates
The labour force surveys (LFS) conducted across the union provide an invaluable source of information on industry by occupation employment. They have the advantage of being conducted much more frequently than a typical census. They also adopt much more standardised sets of questions and systems of classification. While there are still some differences across countries, this source provides a broadly consistent set of data which can be used for producing occupational employment projections within the industries identified in macroeconomic models such as E3ME.
However, as described in more detail in Chapter 2, the LFS is not without its faults. In many respects estimates of employment based on NAs are more robust and more compatible with other economic indicators.
The LFS data from Eurostat are sample data. For many countries the time series are short and the number of respondents within a particular cell is often low. This means that the estimates of occupational structure within sectors are neither precise nor robust. These problems are even more serious when it comes to making estimates of replacement demand, which asks even more from the data. Nevertheless, these are often the only data available. Besides, they have become well established in analytical discourse, with the result that some are now more familiar with these estimates than those based on the NAs. Following detailed debate about the merits of the two sets of estimates at the technical workshop, no consensus could be reached on this question. It was therefore decided to produce two sets of estimates. The first are based on the levels of employment by sector from the NAs as in E3ME. The occupational estimates are constrained to match the sectoral totals from E3ME, while the occupational shares within sectors reflect the LFS data. An alternative set of results has been produced linked to the same benchmark scenario, but constrained to be consistent with the sectoral estimates in the published LFS data. These results, along with the outcomes from alternative macroeconomic scenarios, are discussed in Chapter 6.
1.2.2. Other data issues
Several other issues relating to data comparability and quality have emerged in the course of the project; these are discussed in more detail in Chapters 2 and 4. They include variations in estimates in different vintages of both LFS and NA data sets, and also differences between the published LFS data and those available in the microdata sets provided by Eurostat for the econometric analysis.
Many of these data series are from the same source but differ as a result of being collected, collated and published at different times. In consequence there are several different versions of each of the data sets available at any one time and considerable care is required to avoid spurious comparisons.
The main problems with the data relate to the quality of the detailed information by sector, occupation and qualification. There are particular problems of missing data, and changing systems of classification resulting in gaps or short time series of consistent estimates for analysis. Even where estimates do exist there are some concerns about precision and robustness. Work to improve the quality of these data should be a priority for future work.
1.2.3. Country workbooks
The project involved producing a series of separate country workbooks, plus a European overview, in a standard format. Each workbook includes historical data and a benchmark set of projections, including expansion and replacement demands for both occupations and qualifications. They also include facilities to enable users to customise results, including the ability to:
(a) incorporate alternative industry employment assumptions (history and projections), instead of the E3ME scenario;
(b) use alternative industry by occupation data (such as that derived from own country data), including alternative projections;
(c) adopt alternative qualification assumptions;
(d) adopt alternative replacement demand assumptions.
Initial versions of these workbooks were distributed to experts in each country in 2007 to enable them to assist in validating the data for each country. The final versions of the workbooks include a facility to allow users to experiment with alternatives, which can then be fed back to Cedefop and the core research team to develop and improve the basic forecasts.
Further details about the workbooks are available on request from the Cedefop Skillsnet coordination team (skillsnet-team@cedefop.europa.eu).
1.3.
Module 1: macroeconomic and sectoral
scenarios
1.3.1. E3ME outline and overview
Most countries have some national macroeconomic modelling work and often this includes multi-sectoral and multi-regional subcomponents. There have been a few attempts to develop cross-country models within Europe. Perhaps the most widely used is E3ME, developed by Cambridge Econometrics and partners around Europe. This is the model used to drive the current set of projections.
E3ME is an energy-environment-economy (E3) model of Europe. The economy element includes a detailed treatment of sectoral employment within an input-output framework. The model has been used for general macro analysis and for more focused analysis of environment policies, as well as employment forecasting. Its pan-European coverage is ideal for this project, providing a detailed industry analysis for each country/region within Europe. Further details are given in Chapter 3.
E3ME combines the features of an annual short- and medium-term sectoral model estimated by formal econometric methods with the detail and some of the methods of the computable general equilibrium models. It is essentially a dynamic simulation model estimated by econometric methods.
The main endogenous variables in E3ME are determined from functions estimated on historical data about the economy. The econometric techniques used to specify the functional form of the equations are the concepts of cointegration and error-correction.
Compared to other models targeted at achieving the same goals, the advantage of the E3ME lies in three main areas:
(a) model disaggregation: the detailed nature of the model allows it to represent complex scenarios, in particular scenarios which are differentiated according to sector and country. Similarly, the impact of any measure can be represented in a detailed way;
(b) econometric pedigree: the econometric grounding of the models gives it better capability in representing and forecasting performance in the short to medium term. It, therefore, provides information which is closer to the time horizon of many policy-makers than pure computable general equilibrium models;
(c) E3 links: an interaction (two-way feedback) between the economy, energy demand/supply and environmental emissions is an undoubted advantage
over other models which may either ignore the interaction completely or only assume a one-way causation.
In summary, the characteristics of E3ME are such that the model is: (a) elaborated at European level rather than nationally, with national
economies treated as regions of Europe;
(b) dealing with energy, the environment, population and the economy in one modelling framework;
(c) designed from the outset to address issues of central importance for employment, economic, energy and environmental policy at the European level;
(d) capable of providing short- and medium-term economic and industrial forecasts for business and government;
(e) based on a system of dynamic equations estimated on annual data and calibrated to recent outcomes and short-term forecasts;
(f) focused on the contribution of research and development, and associated technological innovation, on the dynamics of growth and change.
As with any model, E3ME has some disadvantages and limitations. While one of the main advantages of using the E3ME is its inbuilt structure of the NAs, there are also disadvantages to using a fixed structure for the analysis. In particular, there is little flexibility in the definitions of the countries and sectors modelled and, while E3ME provides a detailed sectoral breakdown of each EU-25 economy, this may miss key sectors of interest. For example, the communications industry, as defined in the model and at the NACE 2-digit level, includes both postal services and telecoms, which are largely separate and have different employment trends and skills requirements. In addition, the resources required to add Romania and Bulgaria to the modelʼs classifications were too great to fit into the timescale of this project.
The other major disadvantage in combining detailed economic and labour-market analysis is that the two branches of research are dependent on different data sources and are based on different definitions of employment. There are often significant differences between NAs and European LFS data series, at both the macroeconomic and sectoral levels. A key consideration in the project was how best to handle these discrepancies to produce an accurate and robust set of model results.
As an econometric model, E3MEʼs parameters are estimated empirically, using historical time series data covering the period 1970-2004. This means that behavioural relationships in the forecast are determined by past trends. There may be cases where this is not appropriate, in particular in the new Member States where data series are shorter (1993-2004) and cover a period
of transition. To compensate partially for this, E3ME uses a system of shrinkage estimation for its long-term parameters. This assumes that there is long-term convergence between the new Members States and the previous EU-15.
1.3.2. Alternative scenarios
E3ME has also been set up to explore alternative scenarios. A key focus of the final phase of the project was on developing a range of alternative macroeconomic and related scenarios. This includes a broad assessment of the sensitivity of outcomes to some key external drivers, thus providing a tool to answer various policy-oriented questions about the role of skills in Europeʼs strategic development.
The benchmark projections are seen as part of a coherent European perspective rather than being based on national projections and inputs. The use of the macroeconomic model sets the macroeconomic context for the overall skill projections. E3ME provides consistent predictions of sectoral employment growth, considering factors such as GDP growth, as well as the underlying changes in the components of aggregate demand, demographic changes, etc. These scenarios are described in more detail in Chapter 3.
1.4.
Modules 2 and 3: expansion demand by
occupation and qualifications
1.4.1. Overview of modules 2 and 3Modules 2 and 3 are based on data on occupational employment structure by industry plus information on qualifications held from the European LFS. This avoids the problems of incomparable systems of classification if country specific data were used. The data used are all drawn from LFS information harmonised by Eurostat.
Occupational employment patterns are only one way of measuring skills. From the point of view of training, and especially formal educational planning, the types of qualifications typically required are also important. Some (but by no means all) countries include a qualification dimension in their quantitative projections. A review of the data available suggests that it is possible to create employment matrices by occupation cross-classified by qualification from the LFS. However, there are problems in comparability across countries in how qualifications are coded within the LFS.
Even with only weak data for qualifications it is possible to begin to explore implications for qualifications (levels of education), although to ensure broad comparability this is limited to just three bread levels:
Low qualification at most lower secondary (ISCED 0-2) Medium qualification upper secondary (ISCED 3-4) High qualification tertiary (ISCED 5-6)
Ideally, in the longer term this approach would also be extended to include a much more comprehensive and explicit analysis of the supply side. There are some significant data limitations in many countries. For the present, therefore, such development lies outside the remit of this project.
Another key issue is separating out supply from demand issues. The present exercise focuses on changing patterns of those in employment without any reference to supply side developments.
1.4.2. Modelling employment by occupation and qualification
Previous research on expansion demand and occupational structure is limited, especially at a detailed level. There is even less work on modelling qualifications from a demand perspective. There is a large gap between the ideal theoretical model and the typical specifications used in most national skills projections.
The main reason for this is probably data limitations. Where detailed data have been available, researchers have exploited them. However, the paucity of information often resulted in simple approaches based on time series methods with single variable (the occupational share) rather than multivariate, behavioural approaches. Judgement is often the key element rather than any formal model (see the approach adopted by the Bureau of Labor Statistics in the US).
The ideal approach based on economic theories of what determines demand for skill would relate occupational and qualification structure to a range of economic and other determinants, including:
(a) technology; (b) cyclical indicators; (c) price (wage) indicators;
In practice, many such models revert to simple extrapolative procedures (using linear or non-linear methods) with time as the only independent variable acting as a proxy for technological change and other factors.
These issues are discussed in more detail in Chapter 4. A range of more and less sophisticated explanatory models have been explored covering both occupation and qualification dimensions. The focus is on employment patterns (shares) within sectors. Chapter 4 describes both the data issues with which the project has had to grapple, as well as further refinement of the models used to explain changing employment structure by occupation and qualification.
The most robust results are obtained for some of the simplest models, involving some form of trend rather than more sophisticated models with behavioural content. Given the problems with the current data this is probably not too surprising. As the data are extended and improved it may be possible to add in more economic content to this part of the modelling.
1.5.
Module 4: replacement demand
1.5.1. General approach
In addition to analysing changes in overall occupational employment levels, replacement needs arising from retirements, net migrati