California Children’s Services Program Analysis Final Report Paul H. Wise, MD, MPH Vandana Sundaram, MPH Lisa Chamberlain, MD, MPH Ewen Wang, MD Olga Saynina, MS Jia Chan, MS Kristen Chan, MASc Beate Danielsen, PhD Jeffrey Gould, MD, MPH
i Table of Contents EXECUTIVE SUMMARY ... 1 BACKGROUND ... 8 PURPOSE ... 8 METHODS ... 8
A. Analysis of claims data for CCS-enrolled children ... 8
B. Analysis of CPQCC data for neonates ... 11
RESULTS ... 13
A. Analysis of CCS claims data for CCS-enrolled children ... 13
B. Analysis of CPQCC data for neonates ... 78
LIMITATIONS ... 85
SUMMARY ... 85
A. Analysis of claims data for CCS-enrolled children ... 85
B. Analysis of CPQCC data for neonates ... 86
C. Summary ... 86
Tables Table 1. Demographic characteristics of CCS enrolled children by age group, fiscal year ... 13
(FY) 2009 (n=158,074) ... 13
Table 2a. Eligible diagnosis among children age < 1 year ... 14
Table 2b. Eligible diagnosis among children age >= 1 year ... 14
Table 3a. Utilization among CCS enrolled children age < 1 year by eligible diagnosis, FY 2009 ... 17
Table 3b. Utilization among CCS enrolled children age >= 1 year by eligibility diagnosis, FY 2009... 18
Table 4a. CCS eligible diagnoses among children age < 1 year who were readmitted within 30 days of a prior hospitalization ... 21
Table 4b. County of residence for children age < 1 year who were readmitted within 30 days of a prior hospitalization ... 21
Table 5a. Reasons for readmission by days to readmission among children age < 1 year ... 23
Table 5b. Reasons for readmission compared with prior admission reason by days to readmission among children age < 1 year ... 24
Table 6a. CCS eligible diagnoses among children age >= 1 year who were readmitted within 30 days of a prior hospitalization ... 25
Table 6b. County of residence for children age >=1 year who were readmitted within 30 days of a prior hospitalization ... 25
Table 7a. Reasons for readmission by days to readmission among children age >= 1 year ... 27
Table 7b. Reasons for readmission compared with prior admission reason by days to readmission among children age >= 1 year ... 28
Table 8a. Fee-for-service expenditures among CCS enrolled children age < 1 year by eligible diagnosis, FY 2009 ... 30
Table 8b. Fee-for-service expenditures among CCS enrolled children age >= 1 year by eligible diagnosis, FY 2009 ... 31 Table 9. Percentage of total utilization* and fee-for-service expenditures† by county, FY 2009 36
ii
Table 10a. Variation in FFS expenditures and distribution of expenditures per child by county
among children age < 1, FY 2009 ... 39
Table 10b. Variation in FFS expenditures and distribution of expenditures per child by county among children age >= 1, FY 2009 ... 41
Table 11a. Variation in inpatient utilization by county among children age < 1 year, FY 2009 .. 44
Table 11b. Variation in inpatient utilization by county among children age >= 1 year, FY 2009 47 Table 12. Distribution of total expenditure among most expensive children ... 50
Table 13a. Demographic characteristics of most expensive children age < 1, FY 2009 ... 51
Table 13b. Demographic characteristics of most expensive children age >= 1, FY 2009 ... 52
Table 14a. Variation in FFS expenditures and distribution of expenditures per child by county among children age < 1 in the top 10% of most expensive children, FY 2009 ... 56
Table 14b. Variation in FFS expenditures and distribution of expenditures per child by county among children age < 1 in the top 1% of most expensive children, FY 2009 ... 58
Table 15a. Variation in inpatient utilization by county among children age < 1 year in top 10% of most expensive children, FY 2009... 59
Table 15b. Variation in inpatient utilization by county among children age < 1 year in top 1% of most expensive children, FY 2009... 61
Table 16a. Variation in FFS expenditures and distribution of expenditures per child by county among children age >= 1 in the top 10% of most expensive children, FY 2009 ... 64
Table 16b. Variation in FFS expenditures and distribution of expenditures per child by county among children age >= 1 in the top 1% of most expensive children, FY 2009 ... 66
Table 17a. Variation in inpatient utilization by county among children age >= 1 year in top 10% of most expensive children, FY 2009 ... 68
Table 17b. Variation in inpatient utilization by county among children age >= 1 year in top 1% of most expensive children, FY 2009 ... 70
Table 18. CCS eligible conditions by gestational age for CPQCC infants born in 2009 ... 79
Table 19. CCS eligible conditions by birth weight for CPQCC infants born in 2009 ... 80
Table 20. CCS eligible conditions by center level ... 81
Figures Figure 1. Utilization patterns of CCS-enrolled children by age at visit, FY 2009 ... 15
Figure 2. Utilization among children for select conditions, FY 2009 ... 19
Figure 3. Initial, subsequent hospitalizations and time to subsequent hospitalizations among CCS enrolled children, FY 2009 ... 20
Figure 4. Total expenditures among CCS-enrolled children for fee-for-service claims, FY 2009 ... 32
Figure 5a. Total expenditures by age group, FY 2009 ... 32
Figure 5b. Inpatient expenditures by age group, FY 2009 ... 32
Figure 6a. Percent of total expenditures and percent of all children less than one year of age for eligible conditions with largest expenditures, FY 2009... 33
Figure 6b. Percent of total expenditures and children age >= 1 year for eligible conditions with largest expenditures, FY 2009 ... 33
Figure 7a. Expenditures among children < 1 year of age for select eligible conditions, FY 200934 Figure 7b. Expenditures among children >= 1 year of age for select eligible conditions, FY 2009 ... 34
iii
Figure 9. Proportion of children included in the top 10% of most expensive children by county, FY 2009 ... 54 Figure 10. Distribution of total expenditure by expenditure type and per child expenditures by county among children age >=1 in the top 10% most expensive children, FY 2009 ... 73 Figure 11. Initial, subsequent hospitalizations and time to subsequent hospitalizations among children age < 1, FY 2009 ... 76 Figure 12. Initial, subsequent hospitalizations and time to subsequent hospitalizations among children age >= 1, FY 2009 ... 77 Figure 13a. Gestational age distribution for infants born with a CCS eligible condition ... 82 Figure 13b. Birth weight distribution for infants born with a CCS eligible condition ... 82 Figure 14a. Gestational age distribution for infants who acquired a CCS eligible condition in NICU ... 83 Figure 14b. Birth weight distribution for infants who acquired a CCS eligible condition in NICU ... 83 Figure 15a. Gestational age distribution for infants without a CCS eligible condition ... 84 Figure 15b. Birth weight distribution for infants without a CCS eligible condition ... 84
1
EXECUTIVE SUMMARY
The California Children’s Services (CCS) Program is a joint State/county program providing medical case management and authorization of services for California children with special health care needs who meet specific medical, residential and financial eligibility requirements. These services are provided to children enrolled in Medi-Cal and Healthy Families but may also be provided to children who are uninsured or who have private insurance when their health-related expenditures exceed a designated level of family income (CCS-only clients). In this manner, the CCS program plays a crucial role in ensuring access to essential health care services for a large number of children with serious, chronic diseases in California.
However, growing concerns for the overall cost of the CCS program and perceived opportunities for greater efficiency and improved services have generated increased interest in exploring alternative delivery and payment options for the program. Under CCS program rules, covered services are confined only to those required to treat the child’s CCS eligible condition which can create complex administrative barriers to highly coordinated care. In addition, CCS services are “carved out” from traditional managed care plans which can also lead to inefficiencies and obstacles to comprehensive service delivery.
Under California’s new section 1115 waiver for hospital financing and uninsured care, the Department of Health Care Services has an opportunity to create innovative models and pilot programs to test new approaches to caring for children enrolled in the CCS program. This effort underscored the need for a stronger analytic foundation for considering different reform options. Among the most critical issues is the underlying distribution of utilized services and associated costs among CCS enrollees, particularly the relative concentration of costs among the most severely ill children.
The purpose of this project was to provide the California Department of Health Care Services (DHCS) and stakeholders of the California Children’s Services (CCS) program – including consumer groups representing children with special health care needs, health care providers, county CCS programs, and managed care plans – with analytic insight to inform deliberations regarding CCS reform and guidance for pilot efforts to improve care and reduce costs for children receiving care through CCS program.
Methods
The analysis for this project was separated into two components: (a) analysis of claims data for CCS-enrolled children and (b) analysis of the CPQCC data for neonates.
A. Analysis of claims data for CCS-enrolled children
Data
We received from the California Department of Health Care Services (DHCS) of patient-level data pertaining to all paid CCS authorized claims, non-CCS authorized claims, and
managed care encounters for fiscal years 2007 to 2009 (7/1/2006 to 6/30/2009). Claims data were abstracted from the Management Information System / Decision Support System
(MIS/DSS). The datasets included demographic information, geographic information, diagnoses, procedures and reimbursement information for each claim for every eligible child. The claims
2
dataset included all paid claims for a child and could include claims from different sources such as EDS, Department of Developmental Services, Delta Dental, CHDP etc. Since it was not possible to identify which claims were specific to the CCS eligible condition we included all claims in our analysis of utilization and only fee-for-service claims in our analysis of
expenditures.
We also received separate data that included the CCS eligible diagnosis, eligibility start and end dates each child which were abstracted from the CMS Net system. The CMS Net system is a statewide eligibility, case management, and service authorization application integrated with the Medi-Cal Eligibility Data System (MEDS) and the California Medicaid Management
Information system (CA MMIS). Analysis
An analytic team comprising of physicians and data analysts analyzed the CCS claims datasets. Decisions regarding the analysis were discussed by team members at regular meetings.
Since the claims dataset did not specify the CCS eligible conditions we linked the claims data to the data on eligibility to conduct analysis on the basis of the presumed CCS eligible condition. Eligibility diagnosis was the primary diagnosis listed on the registration form at the time the data were abstracted from CMS Net.
We performed frequency calculations on all variables and conducted validation checks of the data. During this process, we identified data issues that were discussed and resolved with DHCS. Other issues, for example, missing discharge dates and provider specialty are being investigated by DHCS and will be addressed in the next phase of the report.
We examined the prevalence of the CCS eligible conditions for all children across all three years of data by specialty group and examined utilization and expenditure patterns based on specialty group (see definition below) and by age at first visit for children with claims in fiscal year 2009.
We constructed density plots using a similar method to construct a Lorenz curve to show the distribution of total expenditures per child among CCS-enrolled children. Analyses were
conducted using Statistical Analysis Software (SAS). Definitions
Eligible diagnosis: we defined medical condition of the child based on the CCS eligible
diagnosis and not the diagnosis reported in the claims data. We used the primary diagnosis code (ICD 9 code) to define the medical condition; where the primary diagnosis code was missing, we used the secondary diagnosis code. We grouped ICD9 codes by specialty group: two physicians reviewed and reclassified the ICD 9 codes into specialty of care groups; V-codes were
reclassified into specialty groups. We used these specialty groups for further analyses of utilization and expenditures.
Utilization measures: we calculated the following utilization measures for CCS eligible children who had a claim in fiscal year 2009. We summarized the measure by specialty group:
(i) Hospitalizations: we calculated the total number of hospitalizations that occurred in FY 2009. A new admission date that was at least two days after the previous discharge date was considered a new hospitalization; a transfer to another hospital was considered part of the same
3
(ii) Total bed days: we calculated the total number of bed days for a child that was in the hospital in FY 2009 and that was discharged by the end of FY 2009. If a child had multiple
hospitalizations, we summed the bed days for each hospitalization to calculate the total bed days. Children with total bed days greater than 365 reflect hospitalizations where children were
admitted prior to FY 2009 but were still hospitalized and discharged in FY 2009.
(iii) Emergency department (ED) use: we used the procedure code variable to identify claims for emergency department visits. An emergency department visit could have occurred on the same day as an admission or as a visit that did not result in an admission.
(iv) Outpatient, physician/provider, dental, EPSDT: we defined each new service date on the claim form as a new visit for each of these measures. An outpatient claim typically represented a procedure where as a provider claim represented the involvement of a provider (e.g. a radiologist that was reading a radiology film, nurse, physician etc.)
(iv) Outpatient prescriptions: we defined a new outpatient prescription as any new drug or device, new service date or new claim number that was not part of an inpatient hospitalization. This captured any refills or any new prescriptions. Injections or drugs that were provided during an outpatient visit were included in the outpatient analyses and not as a prescription.
(v) Readmissions: we defined a readmission as any admission to the hospital subsequent to a discharge in fiscal year 2009 for a prior hospitalization. Transfers to another hospital were not considered a readmission. Time to readmission was calculated as the days between the discharge date of a hospitalization and the admission date of a subsequent hospitalization within fiscal year 2009.
Expenditures: we summed the Medi-Cal reimbursement amount for all fee-for-service claims (inpatient, outpatient, provider, outpatient prescription, ED use) by child and by specialty group for FY 2009. Fee-for-service claims were defined based on the following criteria provided by DCHS:
Program code (identifies the fiscal intermediary processing the claim) = 09 (EDS) and source code (identifies the source of the payment for the claim)=19 (Medi-Cal), 24 (Healthy Families) or 26 (CCS only).
(i) Inpatient expenditures: any services that were provided during an inpatient stay were included in the calculation of the inpatient expenditure (with the exception of the use of the emergency department on the same day as an admission).
(ii) Emergency department use: the expenditure for ED use only captures the Medi-Cal
reimbursement amount for the claim representing the use of the ED. Other procedures or services provided during the ED visit, were captured either as inpatient expenditures (for ED visits
resulting in an admission) or outpatient/provider expenditures (for ED visits not resulting in an admission)
Inclusion/exclusion
We restricted our analyses to claims within the CCS eligibility period. We excluded the following: 1) claims where a child’s claim was filed under the mother’s eligibility (1.5%); 2) children where a child resided in a long-term care or sub-acute care facility (3%); 3) children with an unknown eligible diagnosis (1%); 4) claims with a missing discharge data for the inpatient admission (1%). When analyzing data for the most expensive children, we excluded children that resided in a carved-in county (4%).
4
For our analysis on expenditures, we only included fee-for-service claims. The vast majority of the data, even from the Medi-Cal managed care plans, is required to be submitted to DHCS; however, there is no verification of the accuracy of the data. Expenditure data from other claim types are either not available or are unreliable since there is no requirement for these data to be submitted.
B. Analysis of CPQCC data for neonates
To facilitate Quality Improvement, the California Perinatal Quality Improvement Collaborative (CPQCC) collects clinical data prospectively using an expanded version of the Vermont Oxford Dataset. Membership is offered to all California neonatal intensive care
hospitals. In the study period 2009, we estimate that greater than 90% of California’s high acuity neonates were cared for in the 131 member neonatal intensive care units (NICUs). CPQCC conducts yearly data abstractor trainings. Each record has extensive range and logic checks at the time of data collection and prior to data closeout and records with excessive missing data are audited. During 2009 CPQCC collected data on 14171 high acuity infants admitted at <= 28 days of life. High acuity was defined as all infants with a birth weight less than 1500 grams as well as all infants greater than 1500 grams who met at least one of the following criteria; death while in hospital, acute neonatal transport, surgery requiring general anesthesia, endotracheal ventilation for > 4 hours, and/or early onset sepsis. Because an infant at a CPQCC NICU who requires a higher level of care may be transferred to another CPQCC NICU, the hospitalization records of each infant are linked to create a patient level dataset that includes information on the status of the infant from the time of first admission to death, discharge to home, or transfer from the NICU to another setting for feeding and growing. We conducted analysis of the CCS
eligibility status of neonatal admissions to CPQCC in 2009.
This analysis was based on the patient level dataset for 2009. The CPQCC data forms were reviewed by DHCS and the following items identified the CCS eligible infants. The population born with a CCS eligible condition was defined by using:
• Data from item 49, Presence of Congenital Anomalies • Data from item 39, Presence of a PDA
The population with CCS eligible conditions acquired during the stay in the NICU was identified using:
• Data from items 40 (NEC), 41(GI perforation), 42 (ROP), 45 (IVH), 46 (CPVL) 47 (seizures) and 48 (HIE) and evidence of chronic lung disease (oxygen at 36 weeks adjusted gestational age, OR discharged on oxygen at 34 or 35 wks adjusted gestational age)
• And as surrogates –the following surgery codes in Appendix E of the CPQCC database manual.
o Head & Neck – S109 o Thorax – S213
o Abdominal and GI – S304, 307-11, 316- 317, 32l -324, 327, and 333 o Central Nervous System – S901-903
We characterized the percentage of NICU infants who had a CCS eligible condition, for any condition and for each condition. This analysis was performed for all NICU infants and for infants stratified by gestational age and for infants stratified by birth weight. Figures were
5
created showing gestational age (GA) and birth weight distributions for NICU infants born with a CCS eligible condition, infants who acquired a condition, and infants without an eligible condition.
We also examined the percentage and type of CCS condition by the NICUs level of care. CPQCC members include both California Children’s Services (CCS) designated and non-CCS designated NICUs. CCS designates level of care on a voluntary basis. In general, intermediate NICUs do not provide prolonged mechanical ventilation, community NICUs provide full ventilation but not complex surgery, and regional NICUs provide a full range of services including complex surgery and ECMO.
Limitations
Because of delays in acquiring the full dataset for children residing in Los Angeles
county, the findings presented in this interim report use only partial data for Los Angeles county. We are currently working with the State and Los Angeles county to obtain and analyze the complete dataset for Los Angeles.
Utilization data are available for all children in the CCS dataset. However, data on expenditures are limited to fee-for-service expenditures only which results in the exclusion of expenditures for managed care encounters. The expenditure analyses include all services for children who were only enrolled in Medi-Cal, which account for the vast majority of children in the CCS program. For children in managed care, Healthy Families or CCS only, this expenditure analysis is restricted to services associated with the CCS condition. For the five counties that “carve in” CCS services within their managed care plan, expenditure analyses could not be conducted; however, utilization data are available and presented in this report.
Results
A. Analysis of claims data for CCS-enrolled children
The main results of our analyses were:
The majority of CCS-enrolled children were >= 1 year of age. In fiscal year 2009, 16% of children were age < 1 year and 84% of children were age >= 1 year. Utilization and expenditure patterns differed considerably between these two groups of children.
A large proportion of the children appeared to be highly vulnerable with serious medical conditions. Most of the children had either Medi-Cal or Healthy Families eligibility; among children age < 1 one year the leading eligible diagnoses were cardiac and NICU-related conditions; for older children it was neurology and ENT. Thirty-six percent of infants had at least one hospitalization in the year. Nine percent had two or more hospitalizations; 16% had subsequent hospitalizations occurring within one week. 48% and 55% of readmissions among children age < 1 year and age >= 1 year respectively, occurred within 30 days of discharge. During the year, 6% of children age < 1 year and 17% of children age >= 1 year had four or more readmissions within 30 days of a discharge (a detailed review of these discharges does not suggest a coding error). For children age < 1 year, most of the readmissions within 30 days were for a different diagnoses compared to the reason for the previous hospitalization. For older children, most of the readmissions were for the same diagnoses.
In fiscal year 2009, there was disproportionate use of service type by children based on age; children less than one year were a small proportion of the patient population (16%)
6
but accounted for the highest inpatient utilization (36%). Among older children,
outpatient services and prescriptions accounted for the highest percentage of utilization. Among children less than one year of age, inpatient bed days accounted for the highest
percentage of utilization among all four leading conditions; the length of stay per hospitalized child varied substantially by condition.
Among all children, inpatient services accounted for 60% of total expenditures, followed by outpatient prescriptions at 17%.
Total expenditures were highest among children < 1 year of age with inpatient
expenditures accounting for most of the cost; children < 1 year of age accounted for 39% of all inpatient expenditures.
When examined by condition, 7 conditions accounted for 77% to 80% of expenditures and about 60% of children. There was substantial variation in total expenditures and per child expenditures by condition.
Among children age >= 1, although inpatient utilization was lower than outpatient utilization, inpatient expenditures accounted for a large proportion of total expenditures. When we examined expenditures by child, we found that most of the children had fairly
low expenditures in the year; however, a small percentage of children had high
expenditures. Ten percent of children accounted for approximately 75 percent of total expenditures.
Among children age < 1, expenditures among the most expensive children were accounted for mostly by inpatient expenditures; however, there was considerable variation by county in the inpatient expenditures per child. While in some counties the high inpatient expenditures per child could be explained by longer bed-days per
hospitalization, in other counties this was not the case. Children in the top 1% of the most expensive children were admitted and readmitted more frequently and within a shorter time frame than children in the top 10% of expensive children.
Among children age >= 1 year, the contribution of expenditure types varied by county. In some counties, high total expenditures per child were accounted for primarily by
inpatient expenditures, while in other counties a mix of inpatient, pharmacy and outpatient expenditures contributed toward total expenditures. In counties where inpatient expenditures accounted for a large percent of total expenditures and where inpatient expenditures per child were high (e.g. Santa Clara), long bed-days only partially explained these high costs. Admissions, readmissions and time to readmission showed similar patterns to those among children age < 1 year; children in the top 1% had higher admissions and readmissions and more children were readmitted within a shorter time compared with children in the top 10% groups.
B. Analysis of CPQCC data for neonates
Our main results of the CPQCC data analysis were:
53% of NICU admissions had CCS eligible conditions. 45% were born with a PDA and or a congenital anomaly.
16% of NICU admissions had a condition at birth and an acquired condition. Another 8% acquired a CCS eligible condition during their admission.
ROP and IVH were the most prevalent acquired conditions and were seen with highest frequency in the very immature infants. Surgical conditions were seen in both premature and term infants.
7
Summary
These analyses suggest that children enrolled in the CCS program are highly heterogeneous in both the nature and severity of their medical conditions. This, in turn, suggests that great care should be exercised in implementing any one single delivery or financing structure. In addition, the findings of this report underscore the inherent vulnerability of a significant portion of
children enrolled in the CCS program and that any revisions to the current program should be carefully monitored to ensure that the desired improvements are actually being realized.
However, the findings of this report also suggest that many opportunities may exist for improved care delivery and cost reduction. The geographic variation in utilization patterns as well as the intense concentration of utilized services among a relatively small portion of the enrollees could provide essential guidance for major changes to program functioning and financing.
8
BACKGROUND
The California Children’s Services (CCS) Program is a joint State/county program providing medical case management and authorization of services for California children with special health care needs who meet specific medical, residential and financial eligibility requirements. These services are provided to children enrolled in Medi-Cal and Healthy
Families but may also be provided to children who are uninsured or who have private insurance when their health-related expenditures exceed a designated level of family income (CCS-only clients). In this manner, the CCS program plays a crucial role in ensuring access to essential health care services for a large number of children with serious, chronic diseases in California. However, growing concerns for the overall cost of the CCS program and perceived opportunities for greater efficiency and improved services have generated increased interest in exploring alternative delivery and payment options for the program. Under CCS program rules, covered services are confined only to those required to treat the child’s CCS eligible condition which can create complex administrative barriers to highly coordinated care. In addition, CCS services are “carved out” from traditional managed care plans which can also lead to inefficiencies and obstacles to comprehensive service delivery.
Under California’s new section 1115 waiver for hospital financing and uninsured care, the Department of Health Care Services has an opportunity to create innovative models and pilot programs to test new approaches to caring for children enrolled in the CCS program. This effort underscored the need for a stronger analytic foundation for considering different reform options. Among the most critical issues is the underlying distribution of utilized services and associated costs among CCS enrollees, particularly the relative concentration of costs among the most severely ill children.
PURPOSE
The purpose of this project was to provide the California Department of Health Care Services (DHCS) and stakeholders of the California Children’s Services (CCS) program – including consumer groups representing children with special health care needs, health care providers, county CCS programs, and managed care plans – with analytic insight to inform deliberations regarding CCS reform and guidance for pilot efforts to improve care and reduce costs for children receiving care through CCS program.
METHODS
The analysis for this project was separated into two components: (a) analysis of claims data for CCS-enrolled children and (b) analysis of the CPQCC data for neonates.
A. Analysis of claims data for CCS-enrolled children
Data
In mid-September 2010, we received from the California Department of Health Care Services (DHCS) three datasets of patient-level data pertaining to all CCS authorized claims, non-CCS authorized claims, and managed care encounters for each fiscal year 2007 (7/1/2006 to
9
6/30/2007), 2008 (7/1/2007 to 6/30/2008) and 2009 (7/1/2008 to 6/30/2009). The datasets included demographic information, geographic information, diagnoses, procedures and
reimbursement information for each claim for every eligible child. Each dataset had, on average, 16 million observations.
The datasets were created in the following manner: DHCS identified a list of CCS-eligible children for the three fiscal years using the eligibility table in the Management Information System / Decision Support System (MIS/DSS). MIS/DSS is a data repository updated from the operational systems used throughout the Department of Health Care Services and the State. The data is loaded into regions such as Eligibility, Paid and Denied Claims, Pharmacy, Health Insurance Plans, and Provider information to be accessed by MIS/DSS users for reporting purposes. All paid claims data were abstracted from MIS/DSS for this list of CCS-eligible children.
The claims dataset included all paid claims for a child and could include claims from
different sources such as EDS, Department of Developmental Services, Delta Dental, CHDP etc. Since it was not possible to identify which claims were specific to the CCS eligible condition (there is no variable that allows this determination; the TAR variable does not provide sufficient information to identify such claims) we included all claims in our analysis of utilization and only fee-for-service claims in our analysis of expenditures.
We also received separate datasets that included the CCS eligible diagnosis, eligibility start and end dates each child. Eligibility start and end dates were abstracted from MIS/DSS. CCS eligible diagnosis was abstracted from the CMS Net system. The CMS Net system is a statewide eligibility, case management, and service authorization application integrated with the Medi-Cal Eligibility Data System (MEDS) and the California Medicaid Management
Information system (CA MMIS) that currently serves approximately 180,000 clients of the California Children’s Services (CCS) Program. There are more than 1200 users of CMS Net including 58 statewide county CCS programs, 3 CCS Regional Offices. CMS Net ensures DHCS compliance with California Health and Safety Code Section 123822, providing centralized billing and payment for county authorized CCS provider claims.
Analysis
An analytic team comprising of physicians and data analysts analyzed the CCS claims datasets. Decisions regarding the analysis were discussed by team members at regular meetings.
Since the claims dataset did not specify the CCS eligible conditions we linked the claims data to the data on eligibility to conduct analysis on the basis of the presumed CCS eligible condition. Eligibility diagnosis was the primary diagnosis listed on the registration form at the time the data were abstracted from CMSNet.
We performed frequency calculations on all variables and conducted validation checks of the data. During this process, we identified data issues that were discussed and resolved with DHCS. Other issues, for example, missing discharge dates and provider specialty are being investigated by DHCS and will be addressed in the next phase of the report.
We examined the prevalence of the CCS eligible conditions for all children across all three years of data by specialty group for children less than one year of age and by children >= one year of age at entry into the CCS program. We examined utilization and expenditure patterns based on specialty group (see definition below) and by age at visit for children with claims in fiscal year 2009.
10
We constructed density plots to show the distribution of total expenditures per child using a similar method used to construct a Lorenz curve. Analyses were conducted using Statistical Analysis Software (SAS).
Definitions
Eligible diagnosis: we defined medical condition of the child based on the CCS eligible
diagnosis and not the diagnosis reported in the claims data. We used the primary diagnosis code (ICD 9 code) to define the medical condition; where the primary diagnosis code was missing, we used the secondary diagnosis code. We grouped ICD9 codes by specialty group: two physicians reviewed and reclassified the ICD 9 codes into specialty of care groups; V-codes were
reclassified into specialty groups. We used these specialty groups for further analyses of utilization and expenditures.
Age at visit: for analysis on utilization and expenditures, we calculated the age at first visit during fiscal year 2009 and grouped children according to those who were less than one year at first visit and those who were greater or equal to one year.
Race/ethnicity: we utilized the classification system provided to us by DHCS. For children with multiple values for race/ethnicity we defined a new category of “mixed” race.
County: for children that reported more than one county of residence (n=6334), we selected the first county of residence. We grouped counties as carved-in (Napa, Yolo, Solano, Santa Barbara, San Mateo) or carved-out (remaining counties).
Hospitalizations: a transfer to another hospital was considered part of the same hospitalization Utilization measures: we calculated the following utilization measures for CCS eligible children who had a claim in fiscal year 2009. We summarized the measure by specialty group:
(i) Hospitalizations: we calculated the total number of hospitalizations that occurred in FY 2009. A new admission date that was at least two days after the previous discharge date was considered a new hospitalization.
(ii)Total bed days: we calculated the total number of bed days for a child that was in the hospital in FY 2009 and that was discharged by the end of FY 2009. If a child had multiple
hospitalizations, we summed the bed days for each hospitalization to calculate the total bed days. Children with total bed days greater than 365 reflect hospitalizations where children were
admitted prior to FY 2009 but were still hospitalized and discharged in FY 2009.
(iii) Emergency department (ED) use: we used the procedure code variable to identify claims for emergency department visits. An emergency department visit could have occurred on the same day as an admission or as a visit that did not result in an admission.
(iv) Outpatient, physician/provider, dental, EPSDT: we defined each new service date on the claim form as a new visit for each of these measures. An outpatient claim typically represented a procedure where as a provider claim represented the involvement of a provider (e.g. a radiologist that was reading a radiology film, nurse, physician etc.)
(iv) Outpatient prescriptions: we defined a new outpatient prescription as any new drug or device, new service date or new claim number that was not part of an inpatient hospitalization.
11
This captured any refills or any new prescriptions. Injections or drugs that were provided during an outpatient visit were included in the outpatient analyses and not as a prescription.
(v) Readmissions: we defined a readmission as any admission to the hospital subsequent to a discharge in fiscal year 2009 for a prior hospitalization. Transfers to another hospital were not considered a readmission. Time to readmission was calculated as the days between the discharge date of a hospitalization and the admission date of a subsequent hospitalization within fiscal year 2009.
Expenditures: we summed the Medi-Cal reimbursement amount for all fee-for-service claims (inpatient, outpatient, provider, outpatient prescription, ED use) by child and by specialty group for FY 2009. Fee-for-service claims were defined based on the following criteria provided by DCHS:
Program code (identifies the fiscal intermediary processing the claim) = 09 (EDS) and source code (identifies the source of the payment for the claim)=19 (Medi-Cal), 24 (Healthy Families) or 26 (CCS only).
(i) Inpatient expenditures: any services that were provided during an inpatient stay were included in the calculation of the inpatient expenditure (with the exception of the use of the emergency department on the same day as an admission).
(ii) Emergency department use: the expenditure for ED use only captures the Medi-Cal
reimbursement amount for the claim representing the use of the ED. Other procedures or services provided during the ED visit, were captured either as inpatient expenditures (for ED visits
resulting in an admission) or outpatient/provider expenditures (for ED visits not resulting in an admission)
Inclusion/exclusion
We restricted our analyses to claims within the CCS eligibility period. We excluded the following: 1) claims where a child’s claim was filed under the mother’s eligibility (1.5%); 2) children where a child resided in a long-term care or sub-acute care facility (3%); 3) children with an unknown eligible diagnosis (1%); 4) claims with a missing discharge data for the inpatient admission (1%). When analyzing data for the most expensive children, we excluded children that resided in a carved-in county (4%).
For our analysis on expenditures, we only included fee-for-service claims. The vast majority of the data, even from the Medi-Cal managed care plans, is required to be submitted; however, there is no verification of the accuracy of the data. Expenditure data from other claim types are either not available or are unreliable since there is no requirement for these data to be submitted.
B. Analysis of CPQCC data for neonates
To facilitate Quality Improvement, the California Perinatal Quality Improvement
Collaborative (CPQCC) collects clinical data prospectively using an expanded version of the Vermont Oxford Dataset. Membership is offered to all California neonatal intensive care
hospitals. In the study period 2009, we estimate that greater than 90% of California’s high acuity neonates were cared for in the 131 member neonatal intensive care units (NICUs). CPQCC conducts yearly data abstractor trainings. Each record has extensive range and logic checks at the time of data collection and prior to data closeout and records with excessive missing data are audited. During 2009 CPQCC collected data on 14171 high acuity infants admitted at <= 28
12
days of life. High acuity was defined as all infants with a birth weight less than 1500 grams as well as all infants greater than 1500 grams who met at least one of the following criteria; death while in hospital, acute neonatal transport, surgery requiring general anesthesia, endotracheal ventilation for > 4 hours, and/or early onset sepsis. Because an infant at a CPQCC NICU who requires a higher level of care may be transferred to another CPQCC NICU, the hospitalization records of each infant are linked to create a patient level dataset that includes information on the status of the infant from the time of first admission to death, discharge to home, or transfer from the NICU to another setting for feeding and growing. We conducted analysis of the CCS
eligibility status of neonatal admissions to CPQCC in 2009.
This analysis was based on the patient level dataset for 2009. The CPQCC data forms were reviewed by DHCS and the following items identified the CCS eligible infants.
The population born with a CCS eligible condition was defined by using: • Data from item 49, Presence of Congenital Anomalies
• Data from item 39, Presence of a PDA
The population with CCS eligible conditions acquired during the stay in the NICU was identified using:
• Data from items 40 (NEC), 41(GI perforation), 42 (ROP), 45 (IVH), 46 (CPVL) 47 (seizures) and 48 (HIE) and evidence of chronic lung disease (oxygen at 36 weeks adjusted gestational age, OR discharged on oxygen at 34 or 35 wks adjusted gestational age)
• And as surrogates –the following surgery codes in Appendix E of the CPQCC database manual.
o Head & Neck – S109 o Thorax – S213
o Abdominal and GI – S304, 307-11, 316- 317, 32l -324, 327, and 333 o Central Nervous System – S901-903
We characterized the percentage of NICU infants who had a CCS eligible condition, for any condition and for each condition. This analysis was performed for all NICU infants and for infants stratified by gestational age and for infants stratified by birth weight. Figures were created showing gestational age (GA) and birth weight distributions for NICU infants born with a CCS eligible condition, infants who acquired a condition, and infants without an eligible condition.
We also examined the percentage and type of CCS condition by the NICUs level of care. CPQCC members include both California Children’s Services (CCS) designated and non-CCS designated NICUs. CCS designates level of care on a voluntary basis. In general, intermediate NICUs do not provide prolonged mechanical ventilation, community NICUs provide full ventilation but not complex surgery, and regional NICUs provide a full range of services including complex surgery and ECMO.
13
RESULTS
A. Analysis of CCS claims data for CCS-enrolled children Who are the CCS-enrolled children?
Table 1. Demographic characteristics of CCS enrolled children by age group, fiscal year (FY) 2009 (n=158,074) Age < 1 Age >= 1 N % N % Age group < 1 25024 100.0 - - 1 to 4 - - 36959 27.78 5 to 9 - - 31000 23.3 10 to 14 - - 31927 24 15 to 18 - - 26152 19.66 19 to 21 - - 7012 5.27 Gender Female 10235 40.9 53588 40.28 Male 11974 47.9 62709 47.13 Unknown 2815 11.3 16753 12.59 Race/Ethnicity White 1117 4.46 19074 14.34 Black 626 2.5 9108 6.85 Hispanic 5957 23.81 67767 50.93 American Indian 24 0.1 376 0.28 Asian/PI 393 1.57 6213 4.67 Other 194 0.78 1442 1.08 Mixed 1143 4.57 13012 9.78 Unknown 15570 62.22 16058 12.07 Residence county Carved-in 1042 4.2 4802 3.6 Carved-out 24000 95.8 128248 96.4 Eligibility Medi-Cal 23534 94.05 108077 81.23 Healthy Families 446 1.78 9708 7.3 CCS-only 295 1.18 2384 1.79 Mixed 749 2.99 12881 9.68
*Mixed eligibility refers to children who moved from Medi-Cal, Healthy Families and CCS-only eligibility during the year.
14
Of the 158,074 children included in our analyses, 16% were less than one year of age at their first visit and about 48% were male. Most of the children lived in a carved-out county. Among children age < 1 year, 24% were Hispanic (62% had an unknown race) and 94% had Medi-Cal eligibility. Among children age >= 1, 51% were Hispanic and 81% had Medi-Cal eligibility. (Table 1).
The leading eligible diagnoses for children less than one year of age were for cardiac conditions, NICU-related conditions, and ENT (Table 2a). For older children the leading eligible diagnoses were neurology disorders, ENT and cardiac conditions (Table 2b).
Table 2a. Eligible diagnosis among children age < 1 year Eligible diagnosis N % Cardiology/Cardiothoracic Surgery 4873 19.47 NICU 4481 17.91 ENT 2417 9.66 Other 2174 8.69
General Pediatrics/ Behavior & Development 2077 8.3 Orthopedics 1410 5.63 Neurology/Neurosurgery 1395 5.57 Urology 1264 5.05 Ophthalmology 862 3.44 External/Injury 606 2.42 Gastroenterology 590 2.36 Endocrine 584 2.33 Hematology/Oncology 466 1.86 Surgery 355 1.42 Genetic 339 1.35 Speech/Visual/Hearing Loss 277 1.11 Infectious diseases 252 1.01 Pulmonary 240 0.96 Dermatology 187 0.75 Rheumatology 83 0.33 Nephrology 55 0.22 Obstetrics-Gynecology 26 0.1 Dental 11 0.04
Table 2b. Eligible diagnosis among children age >= 1 year Eligible diagnosis N % Neurology/Neurosurgery 23538 17.7 ENT 18333 13.8 Cardiology/Cardiothoracic Surgery 16234 12.2 External/Injury 13287 9.99 Endocrine 11778 8.85 Hematology/Oncology 8814 6.62 Orthopedics 8571 6.44 Ophthalmology 7054 5.3 Urology 4680 3.52 Gastroenterology 3496 2.63 Other 2709 2.04 Rheumatology 2142 1.61 NICU 2051 1.54 Nephrology 1898 1.43 Infectious diseases 1446 1.09 Pulmonary 1444 1.09 Genetic 1222 0.92
General Pediatrics/ Behavior & Development 1154 0.87 Dental 1088 0.82 Dermatology 976 0.73 Speech/Visual/Hearing Loss 557 0.42 Surgery 417 0.31 Obstetrics-Gynecology 126 0.09 Psychiatry 35 0.03
15
What services do the CCS-enrolled children utilize?
Our following results describe the utilization and expenditure patterns of the CCS-enrolled children for fiscal year 2009.
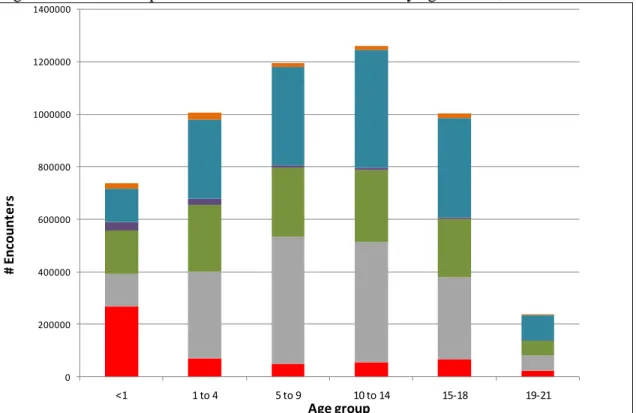
Figure 1 shows the utilization pattern of CCS-enrolled children in fiscal year 2009 by age at visit. Children less than one year of age had the largest number of total bed days which
accounted for 36% of total utilization as compared to 6% among older children. Outpatient procedures and provider visits accounted for 40% of utilization among children less than one year and 58% among older children. Outpatient pharmacy fills accounted for 17% of utilization among children less than one year and 34% among older children.
Figure 1. Utilization patterns of CCS-enrolled children by age at visit, FY 2009
0 200000 400000 600000 800000 1000000 1200000 1400000 <1 1 to 4 5 to 9 10 to 14 15-18 19-21 # E n co u n te rs Age group
Utilization among CCS enrolled children, FY 2009
Total bed days Outpatient procedures Provider claims EPSDT claims Outpatient pharmacy fills ED visits Note: Age is based on age at visit for the first visit in fiscal year 2009
EPSDT=Early Periodic Screening, Diagnosis, and Treatment Program; ED=emergency department
Tables 3a and 3b show the utilization of services by children for each specialty group and by age of visit in fiscal year 2009. Most of the children were >= one year of age and the most prevalent eligible conditions differed by age group.
In fiscal year 2009, there were 25,024 children less than one year of age and 36% of these children had at least one hospitalization for any eligible condition. On average, for most
conditions, of those who were hospitalized, the average number of hospitalizations was one (Table 3a); children with gastroenterology, hematology/oncology and nephrology disorders had an average of two hospitalization per year. The average bed-days per child varied by condition, from a minimum of 7.6 days for injury to a maximum of 53 days for nephrology (Table 3a). The number of outpatient procedures, provider visits and outpatient prescriptions per child also varied dramatically by condition.
16
There were 133,050 children greater than or equal to one year (older children) in the CCS program in fiscal year 2009 (Table 3b). Of these children, 17% had at least one hospitalization and for most conditions, there was one hospitalization per child; there were two or more
hospitalizations per child among children with rheumatology, and genetic conditions and nearly three hospitalizations per child for children with hematology/oncology condition. The average length of stay varied by condition from a minimum of 3.4 days per child for dental conditions to a maximum of 25.7 days per child for hematology/oncology. There was also substantial variation in the use of outpatient procedures, provider visits and outpatient prescriptions per child across the eligible conditions.
17
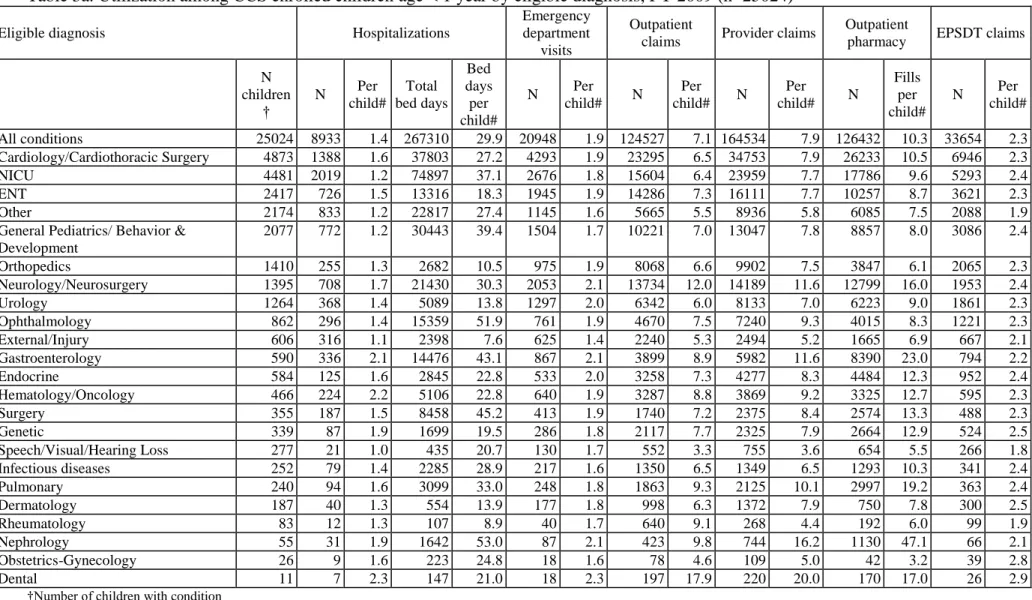
Table 3a. Utilization among CCS enrolled children age < 1 year by eligible diagnosis, FY 2009 (n=25024)
Eligible diagnosis Hospitalizations
Emergency department
visits
Outpatient
claims Provider claims
Outpatient
pharmacy EPSDT claims
N children † N Per child# Total bed days Bed days per child# N Per child# N Per child# N Per child# N Fills per child# N Per child# All conditions 25024 8933 1.4 267310 29.9 20948 1.9 124527 7.1 164534 7.9 126432 10.3 33654 2.3 Cardiology/Cardiothoracic Surgery 4873 1388 1.6 37803 27.2 4293 1.9 23295 6.5 34753 7.9 26233 10.5 6946 2.3 NICU 4481 2019 1.2 74897 37.1 2676 1.8 15604 6.4 23959 7.7 17786 9.6 5293 2.4 ENT 2417 726 1.5 13316 18.3 1945 1.9 14286 7.3 16111 7.7 10257 8.7 3621 2.3 Other 2174 833 1.2 22817 27.4 1145 1.6 5665 5.5 8936 5.8 6085 7.5 2088 1.9
General Pediatrics/ Behavior & Development 2077 772 1.2 30443 39.4 1504 1.7 10221 7.0 13047 7.8 8857 8.0 3086 2.4 Orthopedics 1410 255 1.3 2682 10.5 975 1.9 8068 6.6 9902 7.5 3847 6.1 2065 2.3 Neurology/Neurosurgery 1395 708 1.7 21430 30.3 2053 2.1 13734 12.0 14189 11.6 12799 16.0 1953 2.4 Urology 1264 368 1.4 5089 13.8 1297 2.0 6342 6.0 8133 7.0 6223 9.0 1861 2.3 Ophthalmology 862 296 1.4 15359 51.9 761 1.9 4670 7.5 7240 9.3 4015 8.3 1221 2.3 External/Injury 606 316 1.1 2398 7.6 625 1.4 2240 5.3 2494 5.2 1665 6.9 667 2.1 Gastroenterology 590 336 2.1 14476 43.1 867 2.1 3899 8.9 5982 11.6 8390 23.0 794 2.2 Endocrine 584 125 1.6 2845 22.8 533 2.0 3258 7.3 4277 8.3 4484 12.3 952 2.4 Hematology/Oncology 466 224 2.2 5106 22.8 640 1.9 3287 8.8 3869 9.2 3325 12.7 595 2.3 Surgery 355 187 1.5 8458 45.2 413 1.9 1740 7.2 2375 8.4 2574 13.3 488 2.3 Genetic 339 87 1.9 1699 19.5 286 1.8 2117 7.7 2325 7.9 2664 12.9 524 2.5 Speech/Visual/Hearing Loss 277 21 1.0 435 20.7 130 1.7 552 3.3 755 3.6 654 5.5 266 1.8 Infectious diseases 252 79 1.4 2285 28.9 217 1.6 1350 6.5 1349 6.5 1293 10.3 341 2.4 Pulmonary 240 94 1.6 3099 33.0 248 1.8 1863 9.3 2125 10.1 2997 19.2 363 2.4 Dermatology 187 40 1.3 554 13.9 177 1.8 998 6.3 1372 7.9 750 7.8 300 2.5 Rheumatology 83 12 1.3 107 8.9 40 1.7 640 9.1 268 4.4 192 6.0 99 1.9 Nephrology 55 31 1.9 1642 53.0 87 2.1 423 9.8 744 16.2 1130 47.1 66 2.1 Obstetrics-Gynecology 26 9 1.6 223 24.8 18 1.6 78 4.6 109 5.0 42 3.2 39 2.8 Dental 11 7 2.3 147 21.0 18 2.3 197 17.9 220 20.0 170 17.0 26 2.9
†Number of children with condition
#Calculated based on the number of children with the measure within the condition (e.g. hospitalizations per child for neonatology refers to the total number of hospitalizations for neonatology divided by the number of children with a neonatology condition who had at least one hospitalization)
18
Table 3b. Utilization among CCS enrolled children age >= 1 year by eligibility diagnosis, FY 2009 (n=133,050)
Eligible diagnosis Hospitalizations
Emergency department
visits
Outpatient claims Provider claims Outpatient
pharmacy EPSDT claims
N children † N Per child # Total bed days Bed days per child# N Per child# N Per child# N Per child# N Fills per child# N Per child# All conditions 133050 22294 1.6 262884 11.8 77170 1.6 1643650 15.4 1074239 9.2 1599786 23.6 43706 1.3 Neurology/Neurosurgery 23538 4175 1.5 50249 12.0 15824 1.8 675277 31.2 389542 18.1 552348 35.8 7129 1.3 ENT 18333 1124 1.2 6472 5.8 6519 1.6 221829 15.1 106411 6.7 88166 12.0 6636 1.3 Cardiology/Cardiothoracic Surgery 16234 1680 1.4 15779 9.4 7906 1.6 115796 10.0 91925 6.1 113358 16.1 6816 1.4 External/Injury 13287 4374 1.1 36068 8.2 8998 1.3 71802 7.5 50941 4.8 39423 9.6 2852 1.3 Endocrine 11778 1756 1.4 11433 6.5 6801 1.7 107752 11.1 71185 6.9 268228 29.8 2994 1.3 Hematology/Oncology 8814 2560 2.9 65897 25.7 7820 1.8 97114 12.8 90969 11.3 113582 22.0 2092 1.3 Orthopedics 8571 1225 1.2 7507 6.1 3580 1.6 69306 10.0 50917 6.5 36863 11.3 2979 1.3 Ophthalmology 7054 266 1.1 1646 6.2 2586 1.5 49321 9.9 39516 6.0 32474 10.8 2606 1.3 Urology 4680 644 1.3 3857 6.0 2659 1.7 28371 7.5 23117 5.4 21113 10.5 2057 1.4 Gastroenterology 3496 1229 1.6 15500 12.6 3444 1.8 32263 12.2 26149 8.8 66688 32.2 974 1.3 Other 2709 498 1.5 8260 16.6 1650 1.7 31355 15.0 21611 9.5 27193 23.8 971 1.4 Rheumatology 2142 369 2.0 4969 13.5 1329 1.8 19099 10.3 16654 8.6 35422 25.1 492 1.3 NICU 2051 196 1.5 2233 11.4 1421 1.7 19023 12.0 13370 7.9 21295 21.4 1531 1.5 Nephrology 1898 616 1.9 8891 14.4 1521 1.7 25091 15.1 23111 13.6 47871 35.7 457 1.2 Infectious diseases 1446 341 1.5 6721 19.7 957 1.6 18593 15.2 12094 9.7 30994 33.0 395 1.3 Pulmonary 1444 569 1.7 10497 18.4 1378 1.8 14224 12.5 15103 12.4 50234 46.3 501 1.4 Genetic 1222 189 2.0 2371 12.5 818 1.9 22230 20.5 13797 12.6 26294 31.0 462 1.4 General Pediatrics/ Behavior &
Development 1154 82 1.3 696 8.5 678 1.6 4815 6.2 3970 4.3 4155 8.4 818 1.6 Dental 1088 80 1.1 275 3.4 167 1.4 2883 7.7 1810 4.3 1375 6.5 156 1.3 Dermatology 976 140 1.7 1475 10.5 500 1.6 7840 9.5 6454 7.5 11283 22.8 369 1.3 Speech/Visual/Hearing Loss 557 10 1.1 57 5.7 152 1.6 3721 8.1 1274 3.5 1373 6.0 180 1.2 Surgery 417 130 1.5 1807 13.9 383 1.8 4389 13.9 3651 10.6 9431 45.6 201 1.5 Obstetrics-Gynecology 126 29 1.2 174 6.0 55 1.5 867 10.4 509 4.8 555 10.7 32 1.3 Psychiatry 35 12 1.0 50 4.2 24 1.1 689 26.5 159 6.1 68 6.8 6 1.2
†Number of children with condition
#Calculated based on the number of children with the measure within the condition (e.g. hospitalizations per child for neurology refers to the total number of hospitalizations for neurology divided by the number of children with a neurology condition who had at least one hospitalization)
19
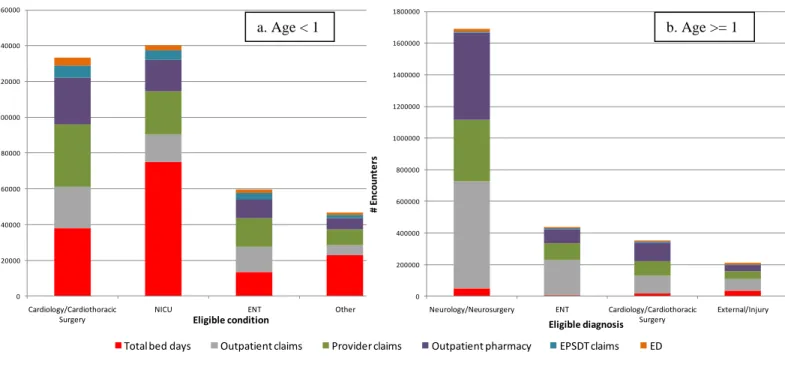
Utilization of services showed similar patterns when examined by the most prevalent eligible diagnoses. Among children age < 1 year, total utilization was highest among children with a NICU-related condition, followed by cardiac conditions, ENT and other (Table 3a; Figure 2a). Inpatient bed days accounted for the highest percentage of utilization in NICU, cardiac and other conditions, followed by outpatient services and outpatient pharmacy fills. For children with ENT eligible diagnosis, outpatient services accounted for the highest percentage of utilization followed by total bed-days and outpatient pharmacy fills (Table 3a; Figure 2a).
Among older children, utilization was highest among children with a neurological disorder followed by ENT, cardiac conditions and injury. Outpatient services and pharmacy fills accounted for most of the utilization among all four conditions (Table 3b; Figure 2b). Figure 2. Utilization among children for select conditions, FY 2009
Initial and subsequent hospitalizations
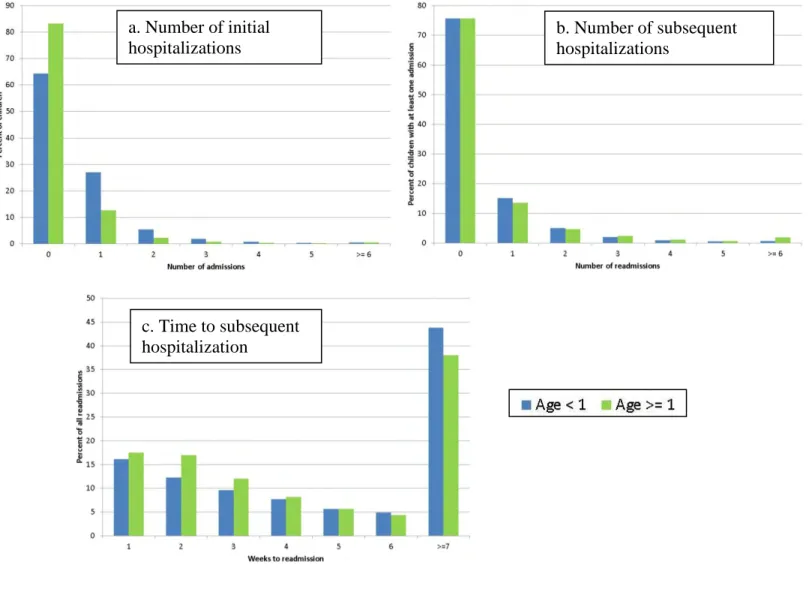
Among children age < 1 year, 4,114 (36%) had at least one hospitalization; nine percent had two or more hospitalizations (Figure 3a). Among children with one hospitalization, most had lengths of stay of two or three days.
There were a total of 12,461 hospitalizations; 3,528 (28%) of these hospitalizations were readmissions. The mean number of days between admissions was 57 (range: 1 to 349). Among children with more than one admission, most had one subsequent hospitalization (readmission) (Figure 3b, Table 4a). Readmissions occurred within one week for 16% of children, with most occurring within 2 or 3 days. Most readmissions occurred after 7 weeks (Figure 3c).
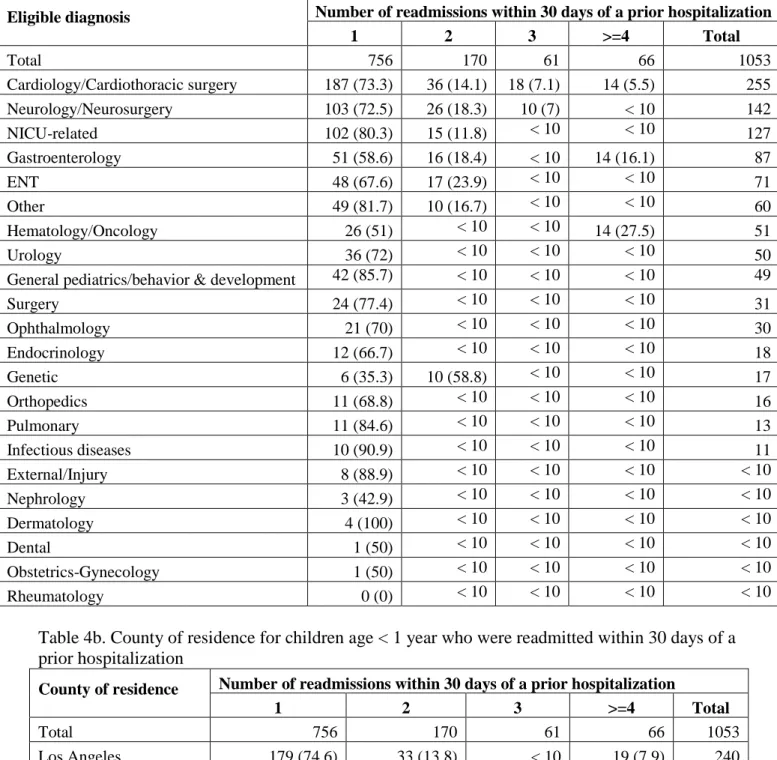
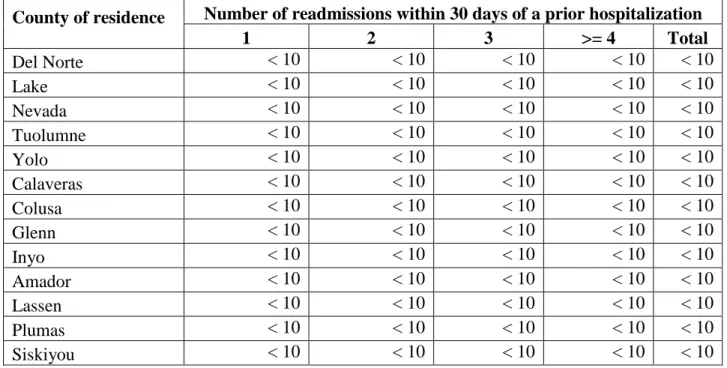
1,053 (26%) children had readmissions within 30 days of discharge from a prior hospitalization for a total of 1,681 (48%) readmissions within 30 days. Table 4a shows the eligible diagnosis and Table 4b shows the county of residence for children with a readmission within 30 days of a prior discharge. Children with cardiology, neurology and NICU-related eligible diagnoses had the highest number of readmissions within 30 days (Table 4a). Children from Los Angeles, San Diego and Fresno counties had the highest number of readmissions
0 20000 40000 60000 80000 100000 120000 140000 160000 Cardiology/Cardiothoracic Surgery
NICU ENT Other
# E n co u n te rs Eligible condition
Utilization, Age < 1, Select Conditions
Total bed days Outpatient claims Provider claims Outpatient pharmacy EPSDT claims ED
0 200000 400000 600000 800000 1000000 1200000 1400000 1600000 1800000
Neurology/Neurosurgery ENT Cardiology/Cardiothoracic Surgery External/Injury # E n co u n te rs Eligible diagnosis
Utilization, Age >=1, Select conditions
Total bed days Outpatient claims Provider claims Outpatient pharmacy EPSDT claims ED
0 200000 400000 600000 800000 1000000 1200000 1400000 1600000 1800000
Neurology/Neurosurgery ENT Cardiology/Cardiothoracic
Surgery External/Injury # E n co u n te rs Eligible diagnosis
Utilization, Age >=1, Select conditions
Total bed days Outpatient claims Provider claims Outpatient pharmacy EPSDT claims ED
b. Age >= 1 a. Age < 1
20
within 30 days (Table 4b). Most children had a single readmission within 30 days; 6% of children had 4 or more readmissions within 30 days (detailed review of these readmissions does not suggest a coding error)
Figure 3. Initial, subsequent hospitalizations and time to subsequent hospitalizations among CCS enrolled children, FY 2009 a. Number of initial hospitalizations b. Number of subsequent hospitalizations c. Time to subsequent hospitalization
21
Table 4a. CCS eligible diagnoses among children age < 1 year who were readmitted within 30 days of a prior hospitalization
Eligible diagnosis
Number of readmissions within 30 days of a prior hospitalization
1 2 3 >=4 Total Total 756 170 61 66 1053 Cardiology/Cardiothoracic surgery 187 (73.3) 36 (14.1) 18 (7.1) 14 (5.5) 255 Neurology/Neurosurgery 103 (72.5) 26 (18.3) 10 (7) < 10 142 NICU-related 102 (80.3) 15 (11.8) < 10 < 10 127 Gastroenterology 51 (58.6) 16 (18.4) < 10 14 (16.1) 87 ENT 48 (67.6) 17 (23.9) < 10 < 10 71 Other 49 (81.7) 10 (16.7) < 10 < 10 60 Hematology/Oncology 26 (51) < 10 < 10 14 (27.5) 51 Urology 36 (72) < 10 < 10 < 10 50
General pediatrics/behavior & development 42 (85.7) < 10 < 10 < 10 49
Surgery 24 (77.4) < 10 < 10 < 10 31 Ophthalmology 21 (70) < 10 < 10 < 10 30 Endocrinology 12 (66.7) < 10 < 10 < 10 18 Genetic 6 (35.3) 10 (58.8) < 10 < 10 17 Orthopedics 11 (68.8) < 10 < 10 < 10 16 Pulmonary 11 (84.6) < 10 < 10 < 10 13 Infectious diseases 10 (90.9) < 10 < 10 < 10 11 External/Injury 8 (88.9) < 10 < 10 < 10 < 10 Nephrology 3 (42.9) < 10 < 10 < 10 < 10 Dermatology 4 (100) < 10 < 10 < 10 < 10 Dental 1 (50) < 10 < 10 < 10 < 10 Obstetrics-Gynecology 1 (50) < 10 < 10 < 10 < 10 Rheumatology 0 (0) < 10 < 10 < 10 < 10
Table 4b. County of residence for children age < 1 year who were readmitted within 30 days of a prior hospitalization
County of residence
Number of readmissions within 30 days of a prior hospitalization
1 2 3 >=4 Total Total 756 170 61 66 1053 Los Angeles 179 (74.6) 33 (13.8) < 10 19 (7.9) 240 San Diego 69 (75) 12 (13) < 10 < 10 92 Fresno 59 (76.6) 13 (16.9) < 10 < 10 77 San Bernardino 53 (68.8) 15 (19.5) < 10 < 10 77 Riverside 47 (64.4) 16 (21.9) < 10 < 10 73 Orange 53 (74.6) < 10 < 10 < 10 71 Kern 23 (65.7) < 10 < 10 < 10 35
22
County of residence
Number of readmissions within 30 days of a prior hospitalization
1 2 3 >=4 Total Santa Clara 25 (71.4) < 10 < 10 < 10 35 Sacramento 25 (73.5) < 10 < 10 < 10 34 San Joaquin 22 (68.8) < 10 < 10 < 10 32 Alameda 25 (80.6) < 10 < 10 < 10 31 Tulare 17 (58.6) < 10 < 10 < 10 29 Monterey 18 (72) < 10 < 10 < 10 25 Ventura 18 (85.7) < 10 < 10 < 10 21 Contra Costa 16 (84.2) < 10 < 10 < 10 19 Stanislaus < 10 < 10 < 10 < 10 18 San Francisco < 10 < 10 < 10 < 10 13 San Mateo < 10 < 10 < 10 < 10 12 Sonoma < 10 < 10 < 10 < 10 12 Imperial < 10 < 10 < 10 < 10 10 Santa Cruz < 10 < 10 < 10 < 10 10 Santa Barbara < 10 < 10 < 10 < 10 < 10 Madera < 10 < 10 < 10 < 10 < 10 Kings < 10 < 10 < 10 < 10 < 10 Shasta < 10 < 10 < 10 < 10 < 10 Butte < 10 < 10 < 10 < 10 < 10 El Dorado < 10 < 10 < 10 < 10 < 10 Merced < 10 < 10 < 10 < 10 < 10
San Luis Obispo < 10 < 10 < 10 < 10 < 10
Marin < 10 < 10 < 10 < 10 < 10 Solano < 10 < 10 < 10 < 10 < 10 Sutter < 10 < 10 < 10 < 10 < 10 Yuba < 10 < 10 < 10 < 10 < 10 Placer < 10 < 10 < 10 < 10 < 10 Tuolumne < 10 < 10 < 10 < 10 < 10 Glenn < 10 < 10 < 10 < 10 < 10 Lassen < 10 < 10 < 10 < 10 < 10 Mendocino < 10 < 10 < 10 < 10 < 10 Tehama < 10 < 10 < 10 < 10 < 10 Humboldt < 10 < 10 < 10 < 10 < 10 Modoc < 10 < 10 < 10 < 10 < 10 Mono < 10 < 10 < 10 < 10 < 10 Napa < 10 < 10 < 10 < 10 < 10 Nevada < 10 < 10 < 10 < 10 < 10
23
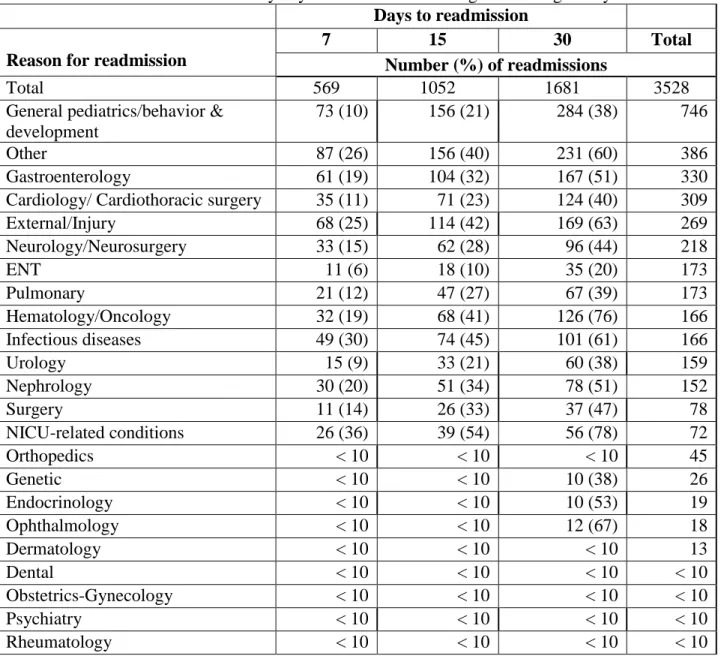
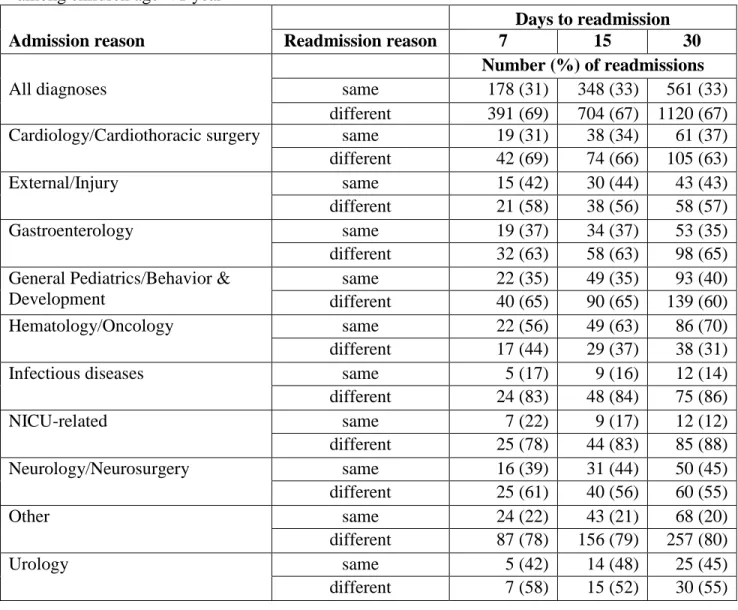
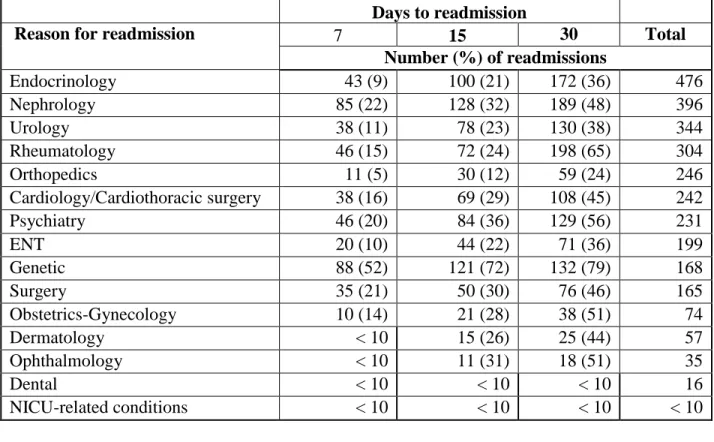
Tables 5a and 5d show the reasons for readmission within 7, 15 and 30 days of a prior
admission for children age < 1. Readmissions were most frequent for general pediatrics/behavior and development, other, gastroenterology, cardiology and external/injury diagnoses (Table 5a) Table 5b shows the distribution of whether the reason for readmission was the same or different from the reason for the prior admission for the top ten reasons for admission. For example, for readmissions occurring within 30 days of a prior admission, 40 percent of admissions for general pediatrics/behavior and development had readmissions for the same reason, but 60 percent of admissions for general pediatrics had a different readmission diagnosis. Similarly 37 percent of cardiology admissions readmissions for cardiology, but percent had a different readmission diagnosis (Table 5d). For all admission diagnoses, 33% of readmissions within 30 days were for the same reason as the prior admission.
Table 5a. Reasons for readmission by days to readmission among children age < 1 year
Days to readmission
Reason for readmission
7 15 30 Total
Number (%) of readmissions
Total 569 1052 1681 3528
General pediatrics/behavior & development
73 (10) 156 (21) 284 (38) 746
Other 87 (26) 156 (40) 231 (60) 386
Gastroenterology 61 (19) 104 (32) 167 (51) 330
Cardiology/ Cardiothoracic surgery 35 (11) 71 (23) 124 (40) 309
External/Injury 68 (25) 114 (42) 169 (63) 269 Neurology/Neurosurgery 33 (15) 62 (28) 96 (44) 218 ENT 11 (6) 18 (10) 35 (20) 173 Pulmonary 21 (12) 47 (27) 67 (39) 173 Hematology/Oncology 32 (19) 68 (41) 126 (76) 166 Infectious diseases 49 (30) 74 (45) 101 (61) 166 Urology 15 (9) 33 (21) 60 (38) 159 Nephrology 30 (20) 51 (34) 78 (51) 152 Surgery 11 (14) 26 (33) 37 (47) 78 NICU-related conditions 26 (36) 39 (54) 56 (78) 72 Orthopedics < 10 < 10 < 10 45 Genetic < 10 < 10 10 (38) 26 Endocrinology < 10 < 10 10 (53) 19 Ophthalmology < 10 < 10 12 (67) 18 Dermatology < 10 < 10 < 10 13 Dental < 10 < 10 < 10 < 10 Obstetrics-Gynecology < 10 < 10 < 10 < 10 Psychiatry < 10 < 10 < 10 < 10 Rheumatology < 10 < 10 < 10 < 10
24
Table 5b. Reasons for readmission compared with prior admission reason by days to readmission among children age < 1 year
Days to readmission
Admission reason Readmission reason 7 15 30
Number (%) of readmissions
All diagnoses same 178 (31) 348 (33) 561 (33)
different 391 (69) 704 (67) 1120 (67) Cardiology/Cardiothoracic surgery same 19 (31) 38 (34) 61 (37) different 42 (69) 74 (66) 105 (63) External/Injury same 15 (42) 30 (44) 43 (43) different 21 (58) 38 (56) 58 (57) Gastroenterology same 19 (37) 34 (37) 53 (35) different 32 (63) 58 (63) 98 (65)
General Pediatrics/Behavior & Development same 22 (35) 49 (35) 93 (40) different 40 (65) 90 (65) 139 (60) Hematology/Oncology same 22 (56) 49 (63) 86 (70) different 17 (44) 29 (37) 38 (31) Infectious diseases same 5 (17) 9 (16) 12 (14) different 24 (83) 48 (84) 75 (86) NICU-related same 7 (22) 9 (17) 12 (12) different 25 (78) 44 (83) 85 (88) Neurology/Neurosurgery same 16 (39) 31 (44) 50 (45) different 25 (61) 40 (56) 60 (55) Other same 24 (22) 43 (21) 68 (20) different 87 (78) 156 (79) 257 (80) Urology same 5 (42) 14 (48) 25 (45) different 7 (58) 15 (52) 30 (55)
Among children age >= 1 year, 10,262 (17%) had at least one hospitalization; four percent had two or more hospitalizations (Figure 3a). Among children with one hospitalization, most had lengths of stay of two or three days.
There were a total of 34,415 hospitalizations; 12,122 (35%) of these hospitalizations were readmissions. The mean number of days between admissions was 53 (range 1 to 359). Among children with more than one admission, most had one subsequent hospitalization (readmission) (Figure 3b, Table 6a). Readmissions occurred within one week for 18% of children, with most occurring within 2 or 3 days. Most readmissions occurred after 7 weeks (Figure 3c).
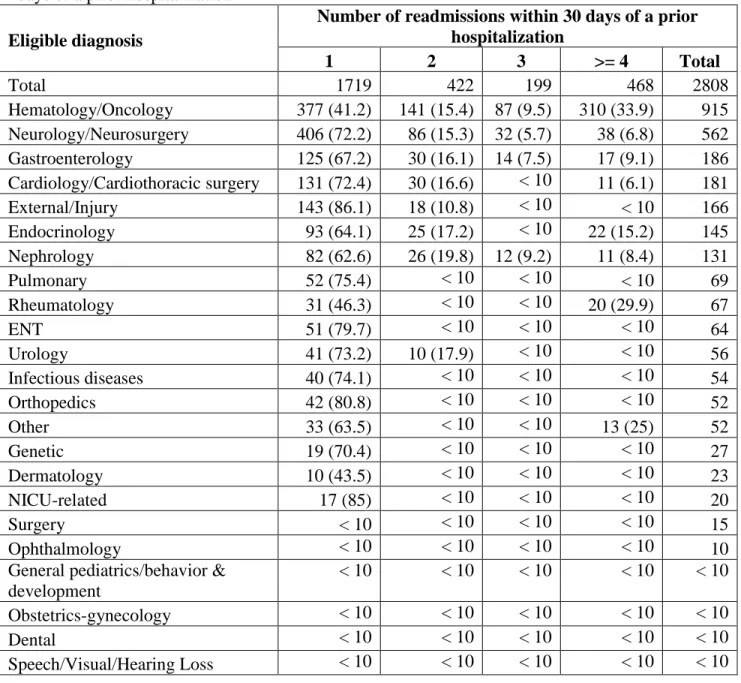
2,808 (27%) children had readmissions within 30 days of a prior hospitalization for a total of 6,635 (55%) readmissions within 30 days of a prior admission. Table 6a shows the eligible diagnosis and Table 6b shows the county of residence for children with a readmission within 30 days of a prior discharge. Children with hematology/oncology, neurology and gastroenterology eligible diagnoses had the highest number of readmissions within 30 days (Table 6a). Children from Los Angeles, San Bernadino and San Diego counties had the highest number of
25
17% had four or more readmissions within 30 days (detailed review of these does not suggest a coding error) (Table 6b).
Table 6a. CCS eligible diagnoses among children age >= 1 year who were readmitted within 30 days of a prior hospitalization
Eligible diagnosis
Number of readmissions within 30 days of a prior hospitalization 1 2 3 >= 4 Total Total 1719 422 199 468 2808 Hematology/Oncology 377 (41.2) 141 (15.4) 87 (9.5) 310 (33.9) 915 Neurology/Neurosurgery 406 (72.2) 86 (15.3) 32 (5.7) 38 (6.8) 562 Gastroenterology 125 (67.2) 30 (16.1) 14 (7.5) 17 (9.1) 186 Cardiology/Cardiothoracic surgery 131 (72.4) 30 (16.6) < 10 11 (6.1) 181 External/Injury 143 (86.1) 18 (10.8) < 10 < 10 166 Endocrinology 93 (64.1) 25 (17.2) < 10 22 (15.2) 145 Nephrology 82 (62.6) 26 (19.8) 12 (9.2) 11 (8.4) 131 Pulmonary 52 (75.4) < 10 < 10 < 10 69 Rheumatology 31 (46.3) < 10 < 10 20 (29.9) 67 ENT 51 (79.7) < 10 < 10 < 10 64 Urology 41 (73.2) 10 (17.9) < 10 < 10 56 Infectious diseases 40 (74.1) < 10 < 10 < 10 54 Orthopedics 42 (80.8) < 10 < 10 < 10 52 Other 33 (63.5) < 10 < 10 13 (25) 52 Genetic 19 (70.4) < 10 < 10 < 10 27 Dermatology 10 (43.5) < 10 < 10 < 10 23 NICU-related 17 (85) < 10 < 10 < 10 20 Surgery < 10 < 10 < 10 < 10 15 Ophthalmology < 10 < 10 < 10 < 10 10
General pediatrics/behavior & development
< 10 < 10 < 10 < 10 < 10 Obstetrics-gynecology < 10 < 10 < 10 < 10 < 10
Dental < 10 < 10 < 10 < 10 < 10
Speech/Visual/Hearing Loss < 10 < 10 < 10 < 10 < 10 Table 6b. County of residence for children age >=1 year who were readmitted within 30 days of a prior hospitalization
County of residence
Number of readmissions within 30 days of a prior hospitalization
1 2 3 >= 4 Total
Total 1719 422 199 468 2808
Los Angeles 387 (63.2) 106 (17.3) 38 (6.2) 81 (13.2) 612