2014 International Conference on Machine Learning and Cybernetics, ICMLC2014, Lanzhou, China, 13-16 July 2014
A HOUGH TRANSFORM BASED BICLUSTERING ALGORITHM FOR GENE
EXPRESSION DATA
CUONG TO1, TIEN THANH NGUYEN1, ALAN WEE-CHUNG LIEW1
1
School of Information and Communication Technology, Griffith University, Australia E-MAIL: [email protected], [email protected], [email protected]
Abstract:
In pattern classification, when the feature space is of high dimension or patterns are “similar” on a subset of features only, the traditional clustering methods do not have good performances. Biclustering is a class of methods that simultaneously group on two dimensions and has many applications to different fields, especially gene expression data analysis. Because of simultaneous classification on both rows and columns of a data matrix, the biclustering problem is inherently intractable and computationally complex. One of the most complex models in biclustering problem is linear coherent model. Several biclustering algorithms based on this model have been proposed in recent years. However, none of them is able to perfectly recognize all linear patterns in a bicluster. In this work, we propose a novel algorithm based on Hough transform that can find all linear coherent patterns and apply it to gene expression data.
Keywords:
Biclustering; Linear coherent patterns; Additive and multiplicative models; Hough transform
1. Introduction
DNA microarray technologies allow us to measure expression levels for thousands of genes in various biological conditions. The raw data of a microarray experiment is an image which is then converted into a numeric matrix called gene expression matrix. Each row and column of a gene expression matrix presents gene and condition, respectively. We already knew that many genes have more than one function, and a group of genes can shows similar expression under several conditions but not the others. Therefore, traditional clustering methods do not perform well in these cases. Biclustering performs simultaneous grouping on two dimensions and is able to find subset of genes that show similar expression behavior over a subset of condittions.
Several models [1, 2] have been proposed in biclustering such as constant (values, rows, columns) models, additive model, multiplicative model, and linear
model. For the constant models [3, 4], all elements of a sub-matrix are a constant value. In the additive [5, 6] or multiplicative model [7–9], one column is obtained by adding a value to other column or is a factor multiple of other column. The general linear model, first proposed in [27, 11], represents the relationship between two columns as a linear equation and it can be considered the general form of the models mentioned above. So the complexity of the general linear model is also the highest. Several algorithms based on the general linear model have been proposed recently [2, 10-13, 27]. Specifically, Gan et al. [27, 11] were the first to formulate the biclustering problem as the detection of hyperplanes in high-dimensional space, and they proposed to apply Hough transform to find biclusters. The attractiveness of this formulation is that it is theoretically possible to detect all biclusters of the general linear type in a dataset as Hough transform does not depend on iterative optimization. The major weakness, however, is the extremely high computation cost when Hough transform is performed in high dimension space. In [11], the computation cost is made manageable by partitioning the data matrix into several smaller parts for biclustering, and the results are later merged to form the final biclusters. Later works proposed various strategies to address this weakness. For example, Zhao [10] used Hough transform to detect genes satisfying general linear model in pair of columns (column space) and then divide them into different patterns using additive and multiplicative pattern plot before combining them; GSGBC [12] first used Hough transform to find 2D linear coherent biclusters in column space and then applied graph spectrum analysis to obtain larger biclusters; Wang [13] used Hough transform to find 2D linear coherent patterns in column space and merge small biclusters into larger ones using hypergraph technique[13].
In gene expression data, the general linear model is biologically meaningful [2, 11]. Therefore, the number of biclustering algorithms based on the general linear model has increased significantly in recent years. In this study, we
propose a two-phase algorithm that can find all linear coherent patterns. At the first phase, the proposed algorithm finds all linear relationships on a pair of columns. The merging process creates larger sets of columns at the second phase. The rest of this paper is outlined as follow: the basic concepts and the proposed algorithm are described in Section 2; experiments and evaluations are given in Section 3 and finally, conclusions are drawn in Section 4.
2. Method
2.1. Hough transform for line detection
The Hough transform (HT) is a method that detects lines and curves in images through a voting process in the parameter space [28, 15]. In the Cartesian coordinate system, an equation of a line is given by
y = kx + b (1)
Given a set of point {(x1, y1), (x2, y2), …}, we would
like to find a line (parameters k and b) that has the best fit to the given set of point. The basic idea of HT is dividing the range values of the parameters k and b into two dimensions grid (called accumulator). Therefore, each cell of accumulator corresponds with a pair values of (k, b) in the parameter space. For each point (xi, yi), the accumulator cell it falls into is computed and voted on. Hence, the value of each accumulator cell gives the number of points being on the corresponding line. Cells that received enough votes denote lines that are present in the image.
To avoid the problem of parameterization of vertical line using (1), the polar coordinate system is often used, i.e., the equation of a line in the polar coordinate system is defined as
r = x.cos(θ) + y.sin(θ) (2) where r is the distance from the origin to the line; θ is
the angle between the line and the x-axis. 2.2. The proposed algorithm
If the Hough transform is used to detect a straight line and the number of accumulator cells (grid) in each dimension is A, the complexity of the Hough transform is A2. In general, the complexity of Hough transform for n dimensional hyperplane is An. So, the computational time of Hough transform for n dimension space is infeasible because the complexity is exponentially increasing. In order to overcome this problem, Zhao et al. [10] used Hough transform to find all straight lines in column-pair space (n = 2) and then applied a union-intersection
operation to merge sub-biclusters into larger biclusters. The difference between our algorithm and [10] is in the second phase. In our algorithm, instead of a union-intersection operation, we find all possible higher dimension spaces through intersection operation.
The proposed algorithm takes as input an expression matrix, A(m×n), where rows represent genes and columns describe conditions and output a set of biclusters that are linearly coherent. A bicluster is a sub-matrix (G, C) ⊆A, where G and C are sets of genes (rows) and conditions (columns), respectively. The proposed algorithm is a two-phase process. In the first phase, the Hough transform is used to find all rows which have linear relationships on pairs of columns in matrix A. In the second phase, these pairs of columns are then merged to obtain larger set of columns on which the linear coherence occurs.
2.2.1 Phase 1
We apply Hough transform to find rows which have linear relationships in pairs of columns in matrix A. Besides counting the number of votes for an accumulator cell, we also keep a record of the points (rows) that contribute to the vote of a cell. The result of this phase is a set of pairs of columns and list of points on which the linear relationships occur:
{R1,2, R1,3, R1,4, …, R2,3, R2,4, …, Ri,j, …, Rn–1,n} (3) where Ri,j = {points | their relationships are linear between columns i and j }.
The number of Hough transform required for this phase is n(n–1)/2. So, as the number of columns n in matrix A increases, the complexity of this phase is O(n2). As the Hough transform on pairs of columns is independently performed, parallel computing can be applied to reduce the computational time at this phase. 2.2.2 Phase 2
The 2nd phase is a merging process based on the results that Ri,j are set of points on the same lines. This process finds all points having linear relationships on at least three columns. The merging process is based on the two properties.
Property 1: If the two columns have linear
relationship with another column at the same point, the relationship of the three columns is linear at this point. Proof:
Given the linear relationship between columns ci and cj
ci = kijcj + bij (4) and between columns ci and cl
we can easily infer the linear model between columns cj and cl as ij ij il l ij il j k b b k k − + = c c (6)
Property 2: Given a set of columns having linear
relationship at the same point, all nonempty subsets of this set must have the linear relationship.
Proof: we use induction proof to prove.
From the 1st phase we obtain Ri,j as the set of points on which two columns i and j are linearly related.
Let n = 3 (we prove that the 2nd property holds with a
set of 3 columns)
If the column h has the linear relationship with both columns i and j at the same points, the following set must be nonempty (Ri,j,h≠∅): h j i j i h j h i, R , R, R,, R ∩ ∩ = (7)
Because Ri,j,h is nonempty, all its subsets Ri,h , Rj,h and Ri,j are also nonempty.
Let n = 4: If the column l has the linear relationship
with three columns {i, j, h} at the same points, the following set must be nonempty (Ri,j,h,l≠∅):
l h j i h j i l h l j l i, , , , , , , , R R R R R ∩ ∩ ∩ = (8)
We can easily obtain that all subsets of Ri,j,h,l are also nonempty. i,j,h l h l i h i l h i l h l j h j l h j l j l i j i l j i R and R R R R R R R R R R R R , , , , , , , , , , , , , , , ∩ ∩ = ∩ ∩ = ∩ ∩ = (9)
Assume the 2nd property hold as n = k, we prove that
it is also satisfied as n = k + 1.
Assume the set of columns {i, j, h, l, …, k} has the linear relationships at the same points. If the column (k+1) has the linear relationship with a set of columns {i, j, h,
l, …, k} at the same points the following set must be
nonempty (Ri,j,h,l,…,k, k+1≠∅): 1 , , , , , , , , , , 1 , 1 , R R R Rik+ ∩∩ kk+ ∩ i jhlk = i jhlkk+ (10) and we easily obtain all subsets of Ri,j,h,l,…,k, k+1 are also nonempty. So, the 2nd property has just been proven.
Base on the two properties mentioned above, the 2nd phase can find all points having linear relationships on a set of columns. The pseudo-code of merging process is shown in Figure 1.
The 2nd phase is generally not a time-consuming task because it is based on intersection operation and linear coherent patterns are sparse.
3. Experiments
The two gene expression datasets, namely Yeast (Yeast Saccharomyces cerevisiae cell cycle) [16] and diffuse large-B-cell lymphoma [17] were used to evaluate the performance of the proposed algorithm and the following biclustering methods such as FABIA [9], ISA 2 [18], xMOTIF [19], Cheng–Church [20], Spectral biclustering [21], Plaid Model [22] were also compared. The Yeast dataset contains 2884 genes measured at 17 instances and the diffuse large-B-cell lymphoma was used to predict the survival after chemotherapy and contains 180 samples of 661 genes.
In Hough transform, each cell (ri, θi) that received enough votes denote lines. In other words, if the number of points in the cell (ri, θi) is greater than a predefined threshold, this is a line. In our experiments, this threshold was assigned to 12. Because the goal of the proposed algorithm is to find all linear biclusters, there are no limitations on bicluster size. These parameters were determined as optimal during processing of two gene expression datasets.
In order to assess the bicluster results of the two above biological data, we applied Gene Ontology (GO) [23] and Kyoto Encyclopedia of Genes and Genomes (KEGG) pathway [24]. The goal of the Gene Ontology Consortium is to produce a dynamic, controlled vocabulary that can be applied to all eukaryotes even as knowledge of gene and protein roles in cells is accumulating and changing and three independent ontologies are being constructed: biological process, molecular function and cellular component [23]. Among the existing tools for GO and KEGG pathway, we selected GO-TermFinder [25] and ClueGO [26].
Input: A = {R1,2, R1,3, R1,4, …, R2,3, R2,4, …, Ri,j, …, Rn–1,n} Output: RS: sets of points having linear relationships on at least three columns. B = A; RS = ∅; While B ≠∅ Begin new_set = ∅; For i = 1 to |B| Begin For j = i+1 to |B| Begin c = bi∩ bj;
If c ≠∅ and c ∉ new_set then Begin
Add c into new_set;
Figure 1. Pseudo-code of merging process (|B| is cardinality of set B; bi is
an element of set B)
All bicluster results found by the biclustering algorithms were enriched to three GO functional categories, namely biological process (GO BP), molecular function (GO MF), cellular component (GO CC), and KEGG pathway. For Yeast dataset, the biclusters obtained from the proposed algorithm and six existing biclustering methods that were enriched by three GO categories and KEGG pathway are shown in Tables 1–5. In this dataset, Spectral biclustering and Plaid Model did not give any biclusters.
TABLE 1.NUMBER OF BICLUSTERS FOUND BY SEVEN METHODS FOR YEAST DATASET
Methods Number of biclusters
The proposed algorithm 6
xMOTIF 10 Spectral biclustering 0 Plaid Model 0 Cheng–Church 10 ISA 2 4 FABIA 10
TABLE 2.NUMBER OF BICLUSTERS ENRICHED BY GOBP
Methods p-value = 0.05 p-value = 0.01
The proposed algorithm 6 6
xMOTIF 2 0 Spectral biclustering 0 0 Plaid Model 0 0 Cheng–Church 1 1 ISA 2 4 4 FABIA 7 6
TABLE 3.NUMBER OF BICLUSTERS ENRICHED BY GOMF
Methods p-value = 0.05 p-value = 0.01
The proposed algorithm 6 6
xMOTIF 1 0 Spectral biclustering 0 0 Plaid Model 0 0 Cheng–Church 0 0 ISA 2 4 4 FABIA 7 6
TABLE 4.NUMBER OF BICLUSTERS ENRICHED BY GOCC
Methods p-value = 0.05 p-value = 0.01
The proposed algorithm 6 6
xMOTIF 1 1 Spectral biclustering 0 0 Plaid Model 0 0 Cheng–Church 2 1 ISA 2 4 4 FABIA 6 6
TABLE 5.NUMBER OF BICLUSTERS ENRICHED BY KEGG PATHWAY
Methods p-value = 0.05 p-value = 0.01
The proposed algorithm 6 6
xMOTIF 2 2 Spectral biclustering 0 0 Plaid Model 0 0 Cheng–Church 0 0 ISA 2 4 4 FABIA 10 5
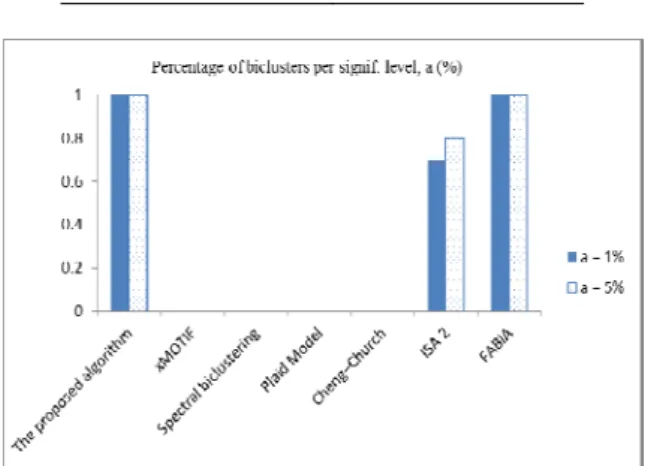
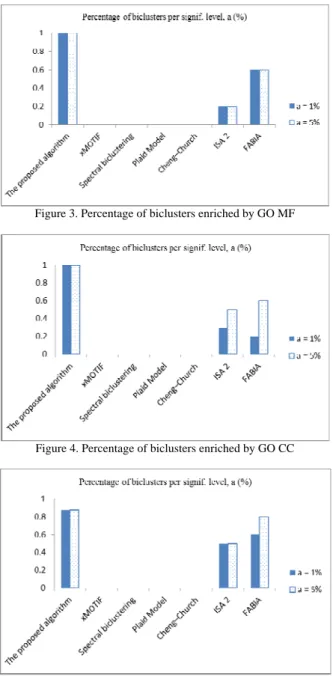
The biclusters of diffuse large-B-cell lymphoma dataset given by several biclustering methods are listed in Figures 2–5 and Table 6. For this dataset, xMOTIF did not give any biclusters, and Cheng–Church considered whole database as a bicluster. While Spectral clustering and Plaid Model gave only one bicluster that was not significantly enriched by GO and KEGG pathway.
TABLE 6.NUMBER OF BICLUSTERS FOUND BY SEVEN METHODS FOR LYMPHOMA DATASET
Methods Number of biclusters
The proposed algorithm 16
xMOTIF 0 Spectral biclustering 1 Plaid Model 1 Cheng–Church 0 ISA 2 10 FABIA 5
Figure 2. Percentage of biclusters enriched by GO BP End
End
Add new_set into RS; B = new_set; End
Figure 3. Percentage of biclusters enriched by GO MF
Figure 4. Percentage of biclusters enriched by GO CC
Figure 5. Percentage of biclusters enriched by KEGG pathway 4. Conclusions
We have presented a geometric-based biclustering approach that is based on using the Hough transform. Our method finds all patterns which have linear relationship on a pair of columns and then merge columns iteratively to obtain linear models on higher dimension spaces. The proposed algorithm was verified by two real gene expression datasets and was compared with several well-known biclustering methods. The results obtained from the proposed algorithm were found to be significantly
enriched when evaluated using three GO categories and KEGG pathway.
References
[1] Madeira, S.C., Oliveira, A.L.., “Biclustering algorithms for biological data analysis: a survey”, IEEE Transactions on Computational Biology and Bioinformatics, 1, pp. 24–45, 2004.
[2] Zhao H., Liew A.W.C., Wang D.Z., Yan H., “Biclustering Analysis for Pattern Discovery: Current Techniques, Comparative Studies and Applications”, Current Bioinformatics, 7(1), pp. 43-55, 2012. [3] Li, G., Ma, Q., Tang, H., Paterson, A.H., Xu, Y.,
“QUBIC: a qualitative algorithm for analyses of gene expression data”, Nucleic Acids Research 37, e101, 2009.
[4] Serin, A., Vingron, M., “DeBi: discovering differentially expressed biclusters using a frequent itemset approach”, Algorithms for Molecular Biology 6:18, 2011.
[5] Huang, Q., Tao, D., Li, X., Liew, A.W.C., “Parallelized evolutionary learning for detection of biclusters in gene expression data”, IEEE/ACM Transactions on Computational Biology and Bioinformatics, 9, pp. 560–570, 2012.
[6] Huang, Q., Lu, M., Yan, H., “An evolutionary algorithm for discovering biclusters in gene expression data of breast cancer”, IEEE Congress on Evolutionary Computation, pp. 829–834, 2008. [7] Divina, F., Aguilar–Ruiz, J.S., “Biclustering of
expression data with evolutionary computation”, IEEE Transactions on Knowledge and Data Engineering, 18, pp. 590–602, 2006.
[8] Chakraborty, A., Maka, H., “Biclustering of gene expression data using genetic algorithm”, Proceeding of the IEEE Symposium on Computational Intelligence in Bioinformatics and Computational Biology, pp. 1–8, 2005.
[9] Hochreiter, S., Bodenhofer, U., Heusel, M., Mayr, A., Mitterecker, A., Kasim, A., Khamiakova, T., Van Sanden, S., Lin, D., Talloen, W., Bijnens, L., Göhlmann, H.W., Shkedy, Z., Clevert, D.A., “FABIA: factor analysis for bicluster acquisition”, Bioinformatics, 26, pp. 1520–1527, 2010.
[10] Zhao, H., Liew, A.W.C., Xie, X., Yan, H., “A new geometric biclustering algorithm based on the Hough transform for analysis of large-scale microarray data”, Journal of Theoretical Biology, 251, pp. 264–274, 2007.
biclusters in gene expression data based on high-dimensional linear geometries”, BMC Bioinformatics, 9: 209, 2008.
[12] Wang, D.Z., Yan, H., “A graph spectrum based geometric biclustering algorithm”, Journal of Theoretical Biology, 317, pp. 200–211, 2013.
[13] Wang, Z. Yu, C.W., Cheung, R.C.C., Yan, H., “Hypergraph based geometric biclustering algorithm”, Pattern Recognition Letters, 33, pp. 1656–1665, 2012.
[14] Goldenshluger, A., Zeevi, A., “The Hough transform estimator”, Ann. Stat., 32, pp. 1908–1932, 2004. [15] Illingworth, J., Kittler, J., “A survey of the Hough
transform”, Comput. Vision Graphics Image Process, 44, pp. 87–116, 1988.
[16] Tavazoie, S., Hughes, J.D., Campbell, M.J., Cho, R.J., Church, G.M., “Systematic determination of genetic network architecture”, Nat Genet., 22, pp. 281–285, 1999.
[17] Rosenwald, A., et al., “The use of molecular profiling to predict survival after chemotherapy for diffuse large-B-cell lymphoma”, New Engl. J. Med., 346, pp. 1937–1947, 2002.
[18] Ihmels, J., Bergmann, S., Barkai, N., “Defining transcription modules using large-scale gene expression data”, Bioinformatics, 20, pp. 1993–2003, 2004.
[19] Murali, T.M., Kasif, S., “Extracting conserved gene expression motifs from gene expression data”, Pacific Symposium on Biocomputing, 8, pp. 77–88, 2003. [20] Cheng, Y., Church, G.M., “Biclustering of expression
data”, Proceedings of the Eighth International Conference on Intelligent Systems for Molecular Biology, pp. 93–103, 2000.
[21] Kluger, Y., Basri, R., Chang, J.T., Gerstein, M., “Spectral biclustering of microarray data: coclustering genes and conditions”, Genome Research, 13, pp. 703–716, 2003.
[22] Turner, H., Bailey, T., Krzanowski, W., “Improved biclustering of microarray data demonstrated through systematic performance tests”, Computational Statistics and Data Analysis, 48, pp. 235–254, 2005. [23] Ashburner, M., Ball, C.A., et al., “Gene Ontology:
tool for the unification of biology”, Nature Genetics, 25, pp. 25–29, 2000.
[24] Kanehisa, M., Goto, S., “KEGG: Kyoto Encyclopedia of Genes and Genomes”, Nucleic Acids Res., 28, pp. 27–30, 2000.
[25] Boyle, E.I., Weng, S., Gollub, J., Jin, H., Botstein, D., Cherry, J.M., Sherlock, G., “GO::TermFinder--open source software for accessing Gene Ontology information and finding significantly enriched Gene Ontology terms associated with a list of genes”, Bioinformatics, 20, pp. 3710–3715, 2004.
[26] Bindea, G., Mlecnik, B., et al., “ClueGO: a Cytoscape plug-in to decipher functionally grouped gene ontology and pathway annotation networks”, Bioinformatics, 25, pp. 1091–1093, 2009.
[27] Gan X., Liew A.W.C., Yan H., “Biclustering gene expression data based on a high dimensional geometric method”, Proceedings of the Fourth International Conference on Machine Learning and Cybernetics (ICMLC 2005), Guangzhou, China, 18 – 21 August 2005, 6:3388-93.
[28] Duda, R.O., Hart P.E., “Use of the Hough transformation to detect lines and curves in pictures”, Comm. ACM, 15, pp. 11–15, 1972