The effect of effectiveness:
Donor response to aid effectiveness in a direct mail fundraising experiment1
Dean Karlan Daniel H. Wood
Yale University
Innovations for Poverty Action M.I.T. Jameel Poverty Action Lab
Clemson University
June, 2015
Abstract
We test how donors respond to new information about a charity’s effectiveness. Freedom from Hunger implemented a test of its direct marketing solicitations, varying letters by whether they include a discussion of their program’s impact as measured by scientific research. The base script, used for both treatment and control, included a standard qualitative story about an individual beneficiary. Adding scientific impact information has no effect on average likelihood of giving or average gift amount. However, we find important heterogeneity: large prior donors both are more likely to give and also give more, whereas small prior donors are less likely to give. This pattern is consistent with two different types of donors: warm glow donors who respond negatively to analytical effectiveness information, and altruism donors who respond positively to such information.
Keywords: aid effectiveness; charitable fundraising; warm glow; pure altruism JEL Codes: D64, H41, L31, O12
1 The authors thank Freedom from Hunger for conducting these experiments, and for undertaking the original project on business training which underlies this project. They thank Michael Kremer for many conversations and inputs into this project. Karlan thanks the National Science Foundation for support, and the Henry E. Niles Foundation for funding for the business training research. We thank Michael Price and two anonymous referees for feedback which greatly improved the paper.
1. Introduction
Understanding why people choose to donate to charity is difficult; people give for different and multiple reasons. However, if asked, donors typically like the idea of giving to effective charities. Are such statements cheap talk, or are donors’ behaviors consistent with this stated preference? Organizations that believe donors will not respond favorably may underinvestment in impact assessment (Pritchett 2002). Here we put forward evidence, albeit on a small scale, that some donors respond favorably to evidence from randomized trials whereas others respond negatively. This behavior is consistent with large and small donors giving for different reasons.
We collaborated with Freedom from Hunger (FFH) to conduct two waves of direct-mail marketing to prior donors. FFH is a US-based nonprofit organization that provides technical advisory services to microfinance institutions (MFIs) in developing countries. In the first wave, the control group received an emotional appeal focused on a specific beneficiary, along with a narrative explaining how FFH ultimately helped the individual. The treatment group received a similar emotional appeal (trimmed by one paragraph), with an added paragraph about scientific research on FFH’s impact. The second wave was similar in design, except that the treatment group narrative included more details on the research, including a brief discussion about the benefits of randomized trials.
We find that average donation behavior does not change when previous donors are presented with evidence of the charity’s effectiveness in achieving its goals. However, we find that the aggregate effect masks different responses by small and large prior donors: larger prior donors, as measured by the amount given in the last donation before the experiment, donate more and small prior donors donate less in response to being told about the scientifically-measured effectiveness of the charity.
The positive response of large donors is consistent with altruism aimed at effectively supporting the goals of FFH, but the small donor response is more puzzling. It has long been recognized that altruism cannot be the entire explanation for charitable giving, though, as it would lead to complete crowd-out of donations in response to other funding sources, which is not borne out by most estimates of crowd-out (Andreoni 2006).
Many researchers have suggested other motives less tied to public good production, such as the warm glow of giving (Andreoni 1990).
Recent experiments provide more direct evidence on the warm-glow motives that are part of our model below. Null (2011) looks at how members of service clubs divided $100 among three charities. Most participants in Null (2011) reveal warm glow motives by giving to multiple charities, which is incompatible with risk-neutral altruism (risk neutral altruists would give the entire $100 to the charity with the highest expected impact). In another direct test of warm-glow preferences, Crumpler and Grossman (2008) observes that most subjects gave to a charity even though their donation crowded-out one-for-one a donation by the experimenters.
Some prior research also finds differences in charitable giving between small and large donors. Using a panel data set on charitable donations, Reinstein (2011) finds that larger donors have more “expenditure substitution” in charitable giving. He finds that a temporary shock such as a personal appeal that increases donations to one charity decreases donations to other charities for large donors but has little effect on other donation decisions by small donors. Reinstein suggests that small donors are responding primarily to temporary shocks or personal appeals, while large donors have other motives.
DellaVigna, List, and Malmendier (2012) also provides evidence, from a field experiment, that small donors have different motivations than large donors, in this case focusing on social pressure. Individual donations were observed during a door-to-door fund-raising campaign. One-third of addresses were simply visited by fund-raisers, while another third were informed the day before the visit that the visit would occur, and a final third were informed and given a check-box form that they could use to opt out of the visit. Allowing subjects to avoid the fundraisers reduced the share of subjects answering the door and also reduced giving by small donors, but not larger donations. Their interpretation is that small donors in this context are primarily motivated by social pressure or avoidance of an annoyance. Although we examine the distinction as well between small and large donors as well, there are two notable differences in our setting: first, our respondents had previously given to the charity, thus expressed some preference for supporting them and less likely to give merely out of social pressure; second, as a
direct mail experiment there was no human interaction, thus we argue that the likelihood of giving out of social pressure is quite low in our experiment.
Of course, warm glow motives are not the only non-altruistic motivate for giving. For example, subjects may want to signal a meritorious motive to themselves or others (Bodner and Prelec 2003; Bénabou and Tirole 2006; Karlan and McConnell 2014). While social signaling seems unlikely to be a major factor in our subjects’ decision-making as their donations are never observed publically, self-signaling could be a factor in donor behavior in our context.
Providing further evidence of non-altruistic donor motivations, several laboratory experiments have found that emotionally triggered generosity may be dampened by appeals that include statistical or deliberative information. For example, people donate less to feed a malnourished child when statistics that put this child in the larger context of famine in Africa are mentioned (Small, Loewenstein, and Slovic 2007). Similarly, people expressed diminishing willingness to fund clean water that would suffice to save the lives of 4500 people in a refugee camp threatened by cholera as the population of the camp increased (Fethersonhaugh et al. 1997). Small, Loewenstein, and Slovic suggests that deliberate thinking decreases the emotional appeal of identifiable victims without a commensurate increase in motivation to give to statistical victims, which causes a drop in donations. Although relevant for our study, it is important to note a key difference: neither of these experiments focuses on effectiveness of the charity, but rather each focuses on the depth of the need, and the number of people in crisis. Our treatment wording does not suggest mention need at all, but instead effectiveness.2
Our work also builds on a growing and pragmatic literature on how donors respond to information about charities, such as Yoruk (2013), which studies, with a regression discontinuity approach, how donors respond to Charity Navigator’s 5 star rating system. Charity Navigator uses mostly financial and governance data, i.e., not data of impact of the work of the charity. Yoruk finds that for otherwise similar charities, a one-star rating increase leads to 19.5 percent higher donations if the charities are
2 In addition our data come from the normal operations of a nonprofit organization, without risk of individuals behaving differently because they are aware that their responses will influence a research study (see Levitt and List 2007 for a discussion of these methodological issues).
relatively unknown, but that the rating increases have no effect on better-known charities.3
2. Motivation and Model
Following a paradigm put forward by Kahneman (2003) we explore a model of giving that incorporates two motivations for giving, altruism (akin to Kahneman’s System II decisions, which are deliberate, effortful, reasoned and focused on impact) and warm glow (akin to Kahneman’s System I decisions, which are intuitive, effortless and reactive). The model makes an important prediction: that individuals driven by altruism, holding all else equal (such as wealth and education), will respond favorably to information about the effectiveness of a particular charity, whereas those driven by more emotionally-based triggers may actually reduce giving.
Our model is inspired by research that deliberation can interfere with emotional impulses for giving (Small, Loewenstein, and Slovic 2007). Our basic assumption is that donors get utility from donations through: (1) altruism, in which the donation affects utility through the increased social welfare generated by the donation, and/or (2) warm-glow, in which the act of donating increases utility directly. This model makes the case that donation size is a proxy (no doubt imperfect, empirically) that allows us to sort by giving type, and that different giving types respond heterogeneously to analytical aid effectiveness information.
We adopt an important distinction between altruism and warm-glow, also made by Null (2011): altruists view charities as perfect substitutes and so respond to differences in charity efficiency, while warm-glow donors value the act of donating and are not responsive to efficiency. More generally, some gifts may be more likely given casually, simply to participate or to appease social pressure (DellaVigna, List, and Malmendier 2012), without much concern for effectiveness. As long as these motivations for giving are not responsive to the impact of donations and instead stem from stronger emotional attachment to the charity, they could yield similar predictions to warm-glow. We refer to the non-altruistic component of utility as “warm glow” while recognizing that
3 Many leaders in the philanthropic space (including the leaders of Charity Navigator, see http://www.overheadmyth.com) have criticized the use of overhead and management ratios, but little is available to donors beyond such data on a comprehensive level (e.g., Givewell.org, an alternative charity evaluator, focuses strictly on evidence of impact per dollar donated and room for growth, but in each year has named typically between 3 and 10 charities, in a limited number of causes).
warm glow refers more particularly to a joy of giving motive. Our data do not allow us to distinguish sharply between some of these motives, and we will discuss alternative interpretations following our results.
Our subjects divide their income y into a donation to a charity, g, and consumption net of giving, c. Utility from charitable giving stems from two sources, altruism and warm-glow. Utility is quasi-linear with constant marginal utility from consumption:
!!!= !!!+!!!∗!(!")!+!(1−!!)∗!!∗!(!).!
β parameterizes the importance of altruism relative to warm-glow for a given subject i, γ parameterizes the charity’s effectiveness (or more precisely, the perception of the charity’s effectiveness, which we assume to be the same for all i), and ei parameterizes
how emotionally connected the subject is to the charity.
Both the altruism component of utility A and the warm-glow component of utility
W are strictly increasing, strictly concave functions. Warm-glow utility is independent of the effectiveness of the charity and is instead weighted by emotional attachment, e. The altruism component is not weighted by e and takes as its argument the increase in social welfare produced by the subject’s donation. For small gifts, the marginal social benefit of each unit donated will be approximately constant and γmeasures that slope. 4
Let γ0 and e0 be the representative individual’s beliefs about the effectiveness of
FFH and emotional connection to FFH before the experiment and in the control condition. We think of treatment as providing better evidence about effectiveness (!! >!!) but reducing the immediate emotional connection of some subjects to FFH
(!!! ≤!!"). We assume that initially, both perfectly altruistic (! =1) and perfectly
warm-glow donors (!=0) get enough utility from donating to donate a positive amount. Letting!!!!!(0)!> !1, the optimal donation of purely altruistic donors is positive, and
likewise if !!!(0)> 1,!then perfectly warm-glow donors make a positive donation. We first establish our claim that small and large donations tend to be driven by different motives (proofs are in the appendix).
Proposition 1: If pure altruists give more than pure warm-glow donors, then the optimal donation !∗ is strictly increasing in the importance of altruism!!. If pure altruists give
less than pure warm-glow donors, then !∗ is strictly decreasing in !.
Donors with these different motives have empirically distinguishable responses to treatment. The experimental treatment’s additional information about research is likely to increase how effective the subject perceives each unit donated to be, to γ1> γ0, but also
for some subjects may reduce the emotional connection the subject feels to the charity, to
ei1<ei0. The latter change means that subjects for whom emotional connection is
especially important will possibly not donate or will decrease their donations.
Proposition 2. For sufficiently warm-glow subjects, if treatment reduces their emotional connection enough, they respond by not donating. Furthermore treatment never causes sufficiently warm-glow individuals to increase their donation.
The response of altruistic subjects is more ambiguous. Intuitively, an increase in γ is effectively a decrease in the price of social welfare, and it will have both income and substitution effects. If the substitution effect is strong enough, high ! subjects will increase their donations:
Proposition 3. Donors only respond to an increase in the evidence of effectiveness γ by increasing their donations if altruism has a large enough substitution effect (−!!! (!)/ !(!)!< !1 for all x). The response is increasing in the donor’s relative degree of altruism !..
Given the quasi-linear utility form we assume, the subjects predicted to respond most positively to the experimental treatment are relatively altruistic individuals for which the substitution effect is strong; their response is on the intensive margin. Relatively warm-glow subjects respond less strongly or respond negatively on the extensive margin.
3. Experimental Design
The two experimental waves were conducted in June 2007 and October 2008.5 All waves were conducted as part of regularly scheduled direct-mail fundraising campaigns, and all subjects were recent donors, defined as those who had given at least once to FFH in either the year of the experiment or the previous three calendar years. The designs of the mailers sent in each wave were similar but not identical. In accordance with FFH’s policy, two types of letters were sent: first class in closed envelopes for donors that had donated more than $100 previously, or non-profit mailing in window envelopes for donors that had previously donated less than $100.
In the first wave, June 2007, mailers were sent to 16,889 individuals who donated to FFH at least once between 2004 and 2007. Subjects were randomly assigned to receive one of three different types of solicitation, with the randomization stratified based on most recent donation year and previous donation amount above or below $100. About two-thirds (11,258) of the sample was assigned to control which contained a standard emotional and personal story about a program participant in Bolivia.6 The treatment group (5,631) received an identical insert with the exception of the final paragraph, which instead mentioned studies that used “rigorous scientific methodologies” (the exact script is in the appendix) demonstrating the positive impact of the particular FFH program.
In the second wave, October 2008, mailers were sent to 17,784 individuals who donated to FFH at least once between 2005 and 2008. Randomization was stratified on size of most recent donation (above/below $100), experimental status in the June 2007 round, and whether or not the donor had donated in 2008. Again, all individuals were mailed a renewal letter requesting donations and providing an update on one of FFH’s regional programs. Of the sample, 5,960 were in the control group and received a renewal
5 An initial second wave was attempted in March 2008 but an error in the randomization led us to drop these results from the analysis. We discovered upon receipt of the data that the March 2008 wave was not randomized, but rather the timing of prior giving determined which letter was received. We considered using a regression discontinuity approach, but were deterred by imprecision of the discontinuity that we were not able to unravel, as well as the irony of using non-experimental analysis (for something that could be easily randomized) to identify the impact of using experimental impact evaluations to guide donor decisions.
6 The control group had two sub-groups, one that received an insert and another that did not. Both contained the same basic narrative and marketing approach. All regressions include a control for the impact of an insert, as measured through this second control group. The test of the presence of an insert was not germane to the research, but rather was part of Freedom from Hunger’s own ongoing testing of its mailers. Thus we control for it, but do not include it as part of our reported analysis.
letter with an emotional appeal to an identifiable victim. A further 5,903 received an identical renewal letter, except that there were additional paragraphs detailing the effectiveness of FFH programs in helping people like the previously introduced victim. The final 5,921 received the same letter as the other 5,903 in the treatment group, except that their letters explicitly cited Yale-affiliated researchers as the source of the statistics on the program’s effectiveness. The probability of assignment to treatment was adjusted to maximize power, conditional on the stratification variables, as per the procedures details in Hahn, Hirano and Karlan (2011).
There is overlap across the two waves, however our analysis pools the two irrespective of what individuals received in the prior mailer (and lack of power precludes our ability to build and test theories on how the two waves may interact with each other). Thus the pooled sample consists of 34,673 mailers to 21,643 prior donors. Of these, 13,030 prior donors were included in both June 2007 and October 2008 wave; 3,859 in the June 2007 wave only; and 4,754 in the October 2008 wave only. For the 21,643 in both waves, given the time gap in between the waves, each individual wave is treated as one observation.
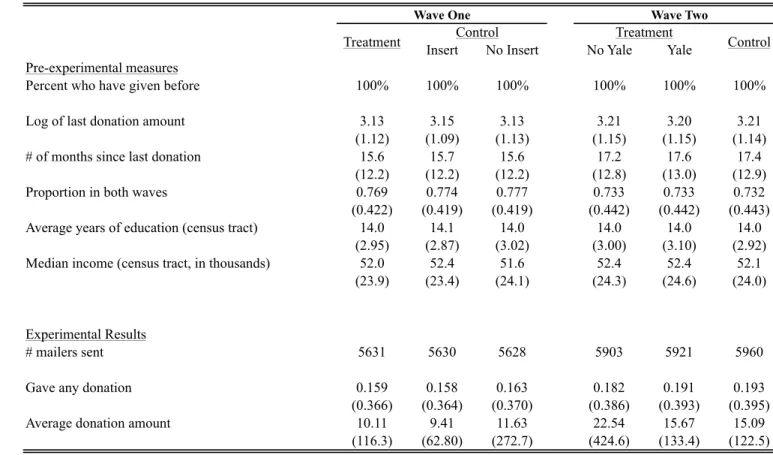
Table 1 reports basic summary statistics, both pre-experimental and experimental. We also test for orthogonality across treatment assignments, and find no statistically significant differences.
4. Experimental Results
Table 1 provides an overview of OLS regressions with the pooled results for two outcomes: making any donation (within five months of the mailer), and donation amount (including non-response as zero, and again limiting to the five months following the mailer). All regressions controlled for the wave of data and whether the individual received the special mailing package (i.e., the stratification variable).
Because there are outliers in the dependent variable, we use four methods to examine robustness to different functional forms: simple amount donated, amount donated winsorized at $1000 (which constitutes the 99.8th percentile), and the inverse hyperbolic sine of the amount donated (because log of amount donated would drop those who did not donate).
Columns 1-4 present the main results for the full sample, and we find no statistically significant effects from the treatment on either likelihood of giving or amount given.
We then present the heterogeneous treatment effects with respect to log of prior gift in Columns 5-8. On both the likelihood of giving (Column 5) and amount given (Columns 6-8) we observe important heterogeneity, with a negative and statistically significant coefficient on the base treatment effect (thus negative treatment effect for the smallest prior donors) and statistically significant coefficient on the interaction term of treatment and log of prior gift. The estimates are both such that they are close to zero for the average prior donor (which is consistent with Columns 1-4, in which no statistically significant results are found for the full sample).
Figures 1 and 2 show a similar pattern, with bar charts for the treatment effects for each quartile of prior gift amount; however, when examined quartile by quartile, no individual result is statistically significant.
Importantly, we examine the heterogeneous treatment effect after including controls for heterogeneous treatment effects with respect to income, education and the special prior mailer. Although we do not have individual-level data on income and education, we do have census data matched on zip-code. These are included in Columns 5-8.
Lastly, we also note that we observe many tiny donations in our data (the 10th percentile prior gift is $10, and 2.8% of prior donors gave exactly $1). This is normal in retail fundraising. While this could be a by-product of underestimating processing costs and the outcome of a maximization process trading off personal consumption utility and altruistic utility for someone of low income, we conjecture this is more likely evidence of symbolic, warm-glow giving.
Robustness Checks
In Appendix Table 1, we present a similar analysis as Table 2, but break down the sample based on donors’ prior donation frequency. This, we conjecture, is essentially reducing noise, as it removes people who are less likely to open the letter at all. We find a general pattern of stronger results for those who have given in the past year.
In Appendix Table 2 we present a similar analysis as Table 2, except use a probit for the binary “any donation” outcome variable and a tobit specification for the “donation amount” outcome variable because it is censored at zero. The results are qualitatively similar, with no changes in statistical significance across the different specifications.
Interpretation and Discussion
Propositions 2 and 3 show that positive intensive responses to treatment identify altruists and negative extensive responses to treatment identify warm-glow or similarly motivated donors. In light of the model, our results provide evidence that large prior donors are motivated by the benefits their donations produce, and small prior donors are motivated by emotional benefits produced by the act of giving.
Naturally other explanations exist for the results from this experiment. First, differences in treatment effects between small and large prior donors may stem from demographic differences rather than different motivations. For example, large prior donors may be wealthier, and perhaps wealthier donors are more educated, more able to understand the importance of rigorous evaluations. Although the demographic data at the zip-5 code level enable tests of whether heterogeneity in giving is driven by education or income, rather than prior donation amount, this is clearly a noisy proxy for education at the individual level.
Second, large prior donors may pay more attention to the marketing material. This would predict that large donors give more, but however would not predict that small donors respond negatively (instead, it would predict that no effect on small donors).
Third, ultimately the treatment and control mailers included different language to convey the information, and the specific words chosen to convey scientific information may have triggered other, unintended, emotional or analytical responses. This is the natural challenge with mapping any direct marketing mailer to a specific theory. This concern is similar to the first alternative explanation, in that it requires there to be some unobserved difference in how big and small prior donors respond to the particular wording. For instance, if small prior donors (but not large ones) interpreted the treatment as signaling the problem is worse and thus their donation will not make a big indent in the problem, they may respond negatively (and big donors not). This would be consistent
with Fethersonhaugh (1997). However, our treatments briefly emphasized positive outcomes as measured by “rigorous scientific methodologies” without specifying the extent of the problem, thus we do not think this is a likely explanation.
5. Conclusion
We find that presenting positive information about charitable effectiveness increases the likelihood of giving to a major U.S. charity for large prior donors, but turned off small prior donors. This heterogeneity is important, and is consistent with a model in which large donors (holding all else equal, including income and wealth) are more driven by altruism and small donors more driven by warm glow motives. We posit that altruistic donors are more driven by the actual impact of their donation, and thus information to reinforce or enhance perceived impacts will drive higher donations. On the other hand, for warm glow donors, information on impacts may actually deter giving by distracting the letter recipient from the emotionally powerful messages that typically trigger warm glow and instead put forward a more deliberative, analytical appeal which simply does not work for such individuals. This distinction is much along the lines of Kahneman (2003), in which System I decisions (peripheral decisions which use intuition and mere reaction, but no deliberation) are “warm glow” decisions, and System II decisions (deliberative decisions requiring conscious reasoning and thought) are “altruism” decisions.
Works Cited
Andreoni, James. 1990. “Impure Altruism and Donations to Public Goods: A Theory of Warm-Glow Giving.” The Economic Journal 100 (401): 464–77.
———. 2006. “Philanthropy.” In Handbook of Giving, Reciprocity and Altruism,
Handbooks in Economics, edited by Louis-Andre Gerard-Varet, Serge-Christophe Kolm, and Jean Mercier Ythier.
Bénabou, Roland, and Jean Tirole. 2006. “Incentives and Prosocial Behavior.” American Economic Review 96 (5): 1652–78. doi:10.1257/aer.96.5.1652.
Bodner, Rohit, and Drazen Prelec. 2003. “Self-Signaling and Diagnostic Utility in Everyday Decision Making.” In Collected Essays in Psychology and Economics, edited by I. Brocas and J. Carillo, Chapter 6. Oxford, UK: Oxford Clarendon Press.
Crumpler, Heidi, and Philip J Grossman. 2008. “An Experimental Test of Warm Glow Giving.” Journal of Public Economics 92 (5): 1011–21.
DellaVigna, Stefano, John A List, and Ulrike Malmendier. 2012. “Testing for Altruism and Social Pressure in Charitable Giving.” The Quarterly Journal of Economics
127 (1): 1–56.
Duncan, Brian. 2004. “A Theory of Impact Philanthropy.” Journal of Public Economics
88 (9): 2159–80.
Fethersonhaugh, David, Paul Slovic, Stephen M. Johnson, and James Friedrich. 1997. “Insensitivity to the Value of Human Life: A Study of Psychophysical Numbing.”
Journal of Risk and Uncertainty 14 (3): 283–300.
Hahn, Jinyong, Keisuke Hirano, and Dean Karlan. 2011. “Adaptive Experimental Design Using the Propensity Score.” Journal of Business & Economic Statistics 29 (1): 96–108.
Kahneman, D. 2003. “Maps of Bounded Rationality: Psychology for Behavioral Economics.” American Economic Review 93 (5): 1449–75.
Karlan, Dean, and Margaret A. McConnell. 2014. “Hey Look at Me: The Effect of Giving Circles on Giving.” Journal of Economic Behavior & Organization
forthcoming. http://www.nber.org/papers/w17737.
Levitt, Steven, and John List. 2007. “What Do Laboratory Experiments Measuring Social Preferences Reveal About the Real World?” Journal of Economic Perspectives 21 (2): 153–74.
Null, Clair. 2011. “Warm Glow, Information, and Inefficient Charitable Giving.” Journal of Public Economics 95 (5): 455–65.
Pritchett, Lant. 2002. “It Pays to Be Ignorant: A Simple Political Economy of Rigorous Program Evaluation.” The Journal of Policy Reform 5 (4): 251–69.
doi:10.1080/1384128032000096832.
Reinstein, David A. 2011. “Does One Charitable Contribution Come at the Expense of Another?” The BE Journal of Economic Analysis & Policy 11 (1).
Small, Deborah A, George Loewenstein, and Paul Slovic. 2007. “Sympathy and
Callousness: The Impact of Deliberative Thought on Donations to Identifiable and Statistical Victims.” Organizational Behavior and Human Decision Processes
Yoruk, Baris. 2013. “Charity Ratings.” University at Albany, SUNY, Department of Economics. http://ideas.repec.org/p/nya/albaec/13-05.html.
Appendix I: Test from Direct Marketing Solicitations
Wave 1:June 2007
Research Mailer
The following text and a picture of an old woman identified as Sebastiana, surrounded by a pink border:
She’s known nothing but abject poverty her entire life. Why on earth should Sebastiana have hope now? After forty-two years of toil in the unforgiving land of the high Andes, Sebastiana looks much older than her years. She has borne nine children and is alone to care for them after losing her husband six years ago. But a few months ago, Sebastiana joined a women’s group sponsored by Freedom from Hunger. There she received a loan of $64 and training on how to grow her small, home-based business.
But does she really have a right to hope for something different? According to studies on our programs in Peru that used rigorous scientific methodologies, women who have received both loans and business education saw their profits grow, even when compared to women who just received loans for their
businesses. But the real difference comes when times are slow. The study showed that women in Freedom from Hunger’s Credit with Education program kept their profits strong – ensuring that their families would not suffer, but thrive.
Control Mailer
The following text and a picture of an old woman identified as Sebastiana, surrounded by a pink border:
She’s known nothing but abject poverty her entire life. Why on earth should Sebastiana have hope now? After forty-two years of toil in the unforgiving land of the high Andes, Sebastiana looks much older than her years. She has borne nine children and is alone to care for them after losing her husband six years ago. But a few months ago, Sebastiana joined a women’s group sponsored by Freedom from Hunger. There she received a loan of $64 and training on how to grow her small, home-based business.
But does she really have a right to hope for something different? Like Sophia and Carmen before her, the good news is, yes! Because of caring people like you, Freedom from Hunger was able to offer Sebastiana a self-help path toward achieving her dream of getting “a little land to farm” and pass down to her children. As Sebastiana’s young son, Aurelio, runs up to hug her, she says, “I do whatever I can for my children.”
Wave 2October 2008
Treatment Mailer
In order to know that our programs work for people like Rita, we look for more than anecdotal evidence. That is why we have coordinated with independent researchers [at Yale University] to conduct scientifically rigorous impact studies of our programs. In Peru they found that women who were offered our Credit with Education program had 16% higher profits in their businesses than those who were not, and they increased profits in bad months by 27%! This is particularly important because it means our program helped women generate more stable incomes throughout the year.
These independent researchers used a randomized evaluation, the methodology routinely used in medicine, to measure the impact of our programs on things like business growth, children's health, investment in education, and women's
empowerment.
Control mailer
Many people would have met Rita and decided she was too poor to repay a loan. Five hungry children and a small plot of mango trees don’t count as collateral. But Freedom from Hunger knows that women like Rita are ready to end hunger in their own families and in their communities.
Treatment postscript at bottom of letter
Rita is one of more than a million women Freedom from Hunger serves. We work hard to deliver services that make a difference – and we employ rigorous
research[, like the evaluation by Yale University,] to keep us on track, to
maximize our impact on women and their children all over the world. Your prior gifts have made these measurable impacts possible. Please continue to help us and make a gift today!
Control postscript at bottom of letter
Rita is one of more than a million women Freedom from Hunger serves – women who continue to prove the power of credit and education in the hands of a
determined mother. Your prior support has been an essential ingredient in this worldwide recipe for financial security. Please continue to help us and make a gift today!
Appendix II: Proofs
Proof of Proposition 1: We show the first claim; the proof of the second claim is similar. Note that the optimal donation !∗ is a critical point of !(!), so !∗!!{0,!
!,!!}, where gA
is the solution to !! !" = 1 and gW is the solution to!! ! =1.
Next, !∗ is never at g=0. By assumption, perfectly warm-glow donors with != 0prefer
gW and perfectly altruistic donors with ! =1 maximize utility at !∗ = !! > !!. For
interior !, !! !
! > 1!so all donors prefer !=!! to != 0. From the Implicit Function theorem,
!!∗ !" = −
!! !!∗ −!′(!∗) !!!! !!∗ + 1−! !′′(!).
The denominator is negative and so if the numerator is positive g* is strictly increasing in !. Because !! < !∗ < !
! and A and W are strictly concave, !! !!∗ >1 and !! !∗ <1, so the numerator is positive. QED.
Proof of Proposition 2: Provided !∗ = 0 is not optimal, the implicit function theorem yields
!!∗
!" !!! =−
!(! !!∗ +!∗!" !"∗ )
!!! !!∗ !!!! !!∗ + 1−! !′′(!).
The numerator is strictly positive given −!!! (!)/!(!)!<!1 and the comparative static is continuous in !, so for high!, !!!∗!/!!!!!is still positive. QED.
Proof of Proposition 3: Subjects choose !∗ = 0 after treatment if !! 0 < 0. This condition can be rewritten as
!!! < !=
1−!"#′(0) 1−! !′(0)
where ! is the maximum emotional attachment such that donors do not give. This cutoff falls in beta, i.e., relatively more altruistic subjects require less emotional attachment to give a positive amount:
!! !"= 1 1−! !! 0 ! !! 0 1−!!! 0 −2!"!! 0 !′(0) <0
Because donors before treatment give a positive amount by assumption, !! 0 >0 and !!! 0 > 1, so the second term is strictly negative. QED.
-. 0 4 -. 0 2 0 .02 .04 T re a tme n t Ef fe ct
Quartile 1 of Prior Gift Quartile 2 of Prior Gift Quartile 3 of Prior Gift Quartile 4 of Prior Gift
Treatment Effect by Quartile Upper/Lower
Note: Results from regressions that included control for stratification variables and quartile of prior gift. 95% confidence intervals calculated using robust standard errors.
-5 0 5 10 15 T re a tme n t Ef fe ct
Quartile 1 of Prior Gift Quartile 2 of Prior Gift Quartile 3 of Prior Gift Quartile 4 of Prior Gift
Treatment Effect by Quartile Upper/Lower Note: Results from regressions that included control for stratification variables and quartile of prior gift.
95% confidence intervals calculated using robust standard errors.
Insert No Insert No Yale Yale Pre-experimental measures
Percent who have given before 100% 100% 100% 100% 100% 100% Log of last donation amount 3.13 3.15 3.13 3.21 3.20 3.21
(1.12) (1.09) (1.13) (1.15) (1.15) (1.14) # of months since last donation 15.6 15.7 15.6 17.2 17.6 17.4
(12.2) (12.2) (12.2) (12.8) (13.0) (12.9) Proportion in both waves 0.769 0.774 0.777 0.733 0.733 0.732 (0.422) (0.419) (0.419) (0.442) (0.442) (0.443) Average years of education (census tract) 14.0 14.1 14.0 14.0 14.0 14.0
(2.95) (2.87) (3.02) (3.00) (3.10) (2.92) Median income (census tract, in thousands) 52.0 52.4 51.6 52.4 52.4 52.1
(23.9) (23.4) (24.1) (24.3) (24.6) (24.0)
Experimental Results
# mailers sent 5631 5630 5628 5903 5921 5960 Gave any donation 0.159 0.158 0.163 0.182 0.191 0.193 (0.366) (0.364) (0.370) (0.386) (0.393) (0.395) Average donation amount 10.11 9.41 11.63 22.54 15.67 15.09
(116.3) (62.80) (272.7) (424.6) (133.4) (122.5) Notes: Within wave, for all pre-experiment variables, there are no statistically signifcant differences at the 10% level across treatment assignments.
Table 1: Descriptive Statistics Means and Standard Deviations
Control Treatment
Wave One Wave Two
Control Treatment
Outcome: Any donation Amount donated Amount donated (winsorized at $1000) Amount donated (ihs) Any
donation Amount donated
Amount donated (winsorized at $1000) Amount donated (ihs) (1) (2) (3) (4) (5) (6) (7) (8)
Received insert emphasizing research 0.00035 2.35 -0.074 -0.00086 -0.056** -20.8* -9.65** -0.20**
(0.0062) (1.98) (0.82) (0.026) (0.027) (11.2) (4.80) (0.10)
Received research insert X ln(amount of last gift) 0.021*** 10.4** 3.56** 0.079***
(0.0063) (4.76) (1.44) (0.024)
ln(Amount of last gift) -0.029*** 3.85 5.87*** 0.089***
(0.0054) (2.92) (1.18) (0.020)
Received insert emphasizing research X education -0.00016 -0.018 -0.0019 -0.00096
(0.00022) (0.23) (0.042) (0.0010)
Received insert emphasizing research X income -0.00012 -0.55 -0.097 0.00013
(0.0018) (0.84) (0.31) (0.0076)
Constant 0.14*** 5.85* 5.32*** 0.53*** 0.17*** -4.96 -9.60** 0.026
(0.0067) (3.35) (0.83) (0.028) (0.030) (8.09) (4.56) (0.12)
Observations 34673 34673 34673 34673 34673 34673 34673 34673 Adjusted R^2 0.045 0.0081 0.083 0.057 0.047 0.010 0.098 0.064 Mean of ln(amount of last gift) 3.171 3.171 3.171 3.171 3.171 3.171 3.171 3.171 Mean of dependent variable 0.174 14.17 11.30 0.710 0.174 14.17 11.30 0.710 Notes: Robust standard errors in parentheses. All regressions include controls for the stratification variables for the random assignment, control for presence of insert (wave 1), and the interaction of large prior donor mailing package with treatment. Columns 5-8 include control for average education and income levels at the census precinct level. For round 1, the randomization was stratified based on prior giving amount (above/below 100) and recency of donation. For round 2, the randomization was stratified based on prior giving amount (above/below 100), whether they donated in 2008, and treatment status in prior rounds. * p<0.10, ** p<0.05, *** p<.01
Table 2: Treatment Effects on Combined Rounds OLS
Outcome: Any donation Amount donated Amount donated (winsorized at $1000) Amount donated (ihs) Any
donation Amount donated
Amount donated (winsorized at $1000) Amount donated (ihs) (1) (2) (3) (4) (5) (6) (7) (8)
Received insert emphasizing research -0.075 -33.9* -15.4* -0.30* 0.0093 -9.35 -5.33* -0.0039
(0.047) (19.9) (8.67) (0.18) (0.025) (11.9) (3.12) (0.096)
Received research insert X ln(amount of last gift) 0.023** 16.6** 5.47** 0.092** 0.0056 4.50 1.72* 0.033
(0.010) (6.91) (2.42) (0.038) (0.0060) (6.78) (0.94) (0.024)
ln(Amount of last gift) -0.052*** 10.7*** 9.49*** 0.12*** 0.0019 -4.36 1.35* 0.058***
(0.0083) (2.42) (1.93) (0.031) (0.0051) (5.85) (0.76) (0.021)
Received insert emphasizing research X education -0.00049 0.010 0.0051 -0.0028* 0.000063 -0.059 -0.028 0.00029
(0.00037) (0.13) (0.074) (0.0017) (0.00023) (0.43) (0.033) (0.0010)
Received insert emphasizing research X income 0.0015 -1.28 -0.19 0.0091 -0.0018 0.29 0.15 -0.0070
(0.0032) (1.39) (0.61) (0.014) (0.0016) (1.06) (0.18) (0.0070)
Constant 0.53*** 12.6 9.64 1.17*** -0.0019 -1.24 -8.19*** -0.22*
(0.053) (13.7) (8.48) (0.21) (0.028) (8.62) (2.84) (0.11)
Observations 16611 16611 16611 16611 18062 18062 18062 18062
Adjusted R^2 0.020 0.068 0.14 0.056 0.012 0.00072 0.038 0.024
Mean of ln(amount of last gift) 3.22 3.22 3.22 3.22 3.13 3.13 3.13 3.13
Mean of dependent variable 0.282 21.452 18.916 1.146 0.076 7.464 4.290 0.309
Appendix 1: Analysis Separated by Recent and Past donors OLS
Notes: Robust standard errors in parentheses. All regressions include controls for the stratification variables for the random assignment, control for presence of insert (wave 1), and the interaction of large prior donor mailing package with treatment. Columns 5-8 include control for average education and income levels at the census precinct level. For round 1, the randomization was stratified based on prior giving amount (above/below 100) and recency of donation. For round 2, the randomization was stratified based on prior giving amount (above/below 100), whether they donated in 2008, and treatment status in prior rounds. * p<0.10, ** p<0.05, *** p<.01
Outcome: Any donation Amount donated Amount donated (winsorized at $1000) Amount donated (ihs) Any donation Amount donated Amount donated (winsorized at $1000) Amount donated (ihs) (1) (2) (3) (4) (5) (6) (7) (8)
Received insert emphasizing research 0.00065 6.59 -0.055 0.0084 -0.055** -136.4** -45.7** -1.22**
(0.0066) (13.7) (4.21) (0.16) (0.026) (59.5) (17.9) (0.59)
Received research insert X ln(amount of last gift) 0.021*** 57.2*** 16.3*** 0.46***
(0.0059) (18.1) (4.64) (0.13)
ln(Amount of last gift) -0.027*** -37.2** 0.44 -0.22**
(0.0050) (18.8) (3.73) (0.11)
Received insert emphasizing research X education -0.00015 -0.29 -0.059 -0.0040
(0.00022) (0.64) (0.15) (0.0052)
Received insert emphasizing research X income -0.00013 -1.34 -0.19 -0.0014
(0.0017) (3.80) (1.17) (0.041)
Constant -717.9*** -192.5*** -6.44 -711.4*** -213.2*** -7.20
(195.5) (8.00) (0.18) (199.4) (20.4) (0.70)
Observations 34673 34673 34673 34673 34673 34673 34673 34673
Pseudo R^2 0.054 0.012 0.023 0.032 0.056 0.013 0.024 0.032
Mean of dependent variable 0.174 14.17 11.30 0.710 0.174 14.17 11.30 0.710
Notes: Robust standard errors in parentheses. All regressions include controls for the stratification variables for the random assignment, control for presence of insert (wave 1), and the interaction of large prior donor mailing package with treatment. Columns 5-8 include control for average education and income levels at the census precinct level. For round 1, the randomization was stratified based on prior giving amount (above/below 100) and recency of donation. For round 2, the randomization was stratified based on prior giving amount (above/below 100), whether they donated in 2008, and treatment status in prior rounds. * p<0.10, ** p<0.05, *** p<.01
Appendix 2: Treatment Effects on Combined Rounds Probit and Tobit
Outcome:
Any
donation Amount donated
Amount donated (winsorized at $1000) Amount donated (ihs) (1) (2) (3) (4)
Received insert emphasizing research -0.0075 3.14 0.91 -0.018
(0.0049) (3.51) (0.72) (0.021)
Received research insert mentioning Yale 0.0066 -4.71 -0.68 0.0038
(0.0066) (4.62) (1.13) (0.029)
Received story insert -0.0069 0.100 0.89 -0.017
(0.0063) (3.21) (0.80) (0.026)
Constant 0.14*** 7.09** 4.63*** 0.54***
(0.0046) (2.80) (0.58) (0.019)
Observations 34673 34673 34673 34673
Adjusted R^2 0.045 0.0081 0.083 0.056
Mean of ln(amount of last gift) 3.171 3.171 3.171 3.171
Mean of dependent variable 0.175 14.166 11.297 0.710
Appendix 3: Disaggregated Treatment Effects for Combined Rounds OLS
Notes: Robust standard errors in parentheses. All regressions include controls for the stratification variables for the random assignment, control for presence of insert (wave 1), and the interaction of large prior donor mailing package with treatment. Columns 5-8 include control for average education and income levels at the census precinct level. For round 1, the randomization was stratified based on prior giving amount (above/below 100) and recency of donation. For round 2, the randomization was stratified based on prior giving amount (above/below 100), whether they donated in 2008, and treatment status in prior rounds. * p<0.10, ** p<0.05, *** p<.01