Factors That Predict Involvement in Online Instruction; A Comparison of Full-Time and Part-Time Community College Faculty
Duane Akroyd, Susan Bracken, Bess Patton, and Melissa Jackowski
Community college faculty represent more than one-third of all faculty within postsecondary education institutions and educate nearly half of all first-time college students (Cohen & Brawer, 2008; Gahn & Twombly, 2001; Huber, 1998; Jaeger & Eagan, 2009). Increasingly, two-year institutions are employing more part-time faculty. From 1988 to 1993, the percentage of part-time faculty at public two-year institutions rose from 52% to 62% (U.S. Department of Education, 1997). According to Outcalt (2002), part-time faculty now account for nearly 65% of all community college faculty. Although the use of part-time faculty is increasing in two-year institutions, part-time community college faculty are not treated in the same ways as their full-time counterparts.
Equity concerns surrounding part-time faculty include low pay, role ambiguity caused by poor integration into the institution, and lack of access to technology (Akroyd, Gillett-Karam, & Boos, 1999; Roueche, Roueche, & Milliron, 1996; Warburton, Chen, & Bradburn, 2002). Part-time faculty, reportedly, have less access to technology than do their full-Part-time counterparts. The U.S. Department of Education (Warburton, Chen, & Bradburn, 2002) reported that in the fall of 1998 part-time instructional faculty were less likely to have access to the Internet than full-time faculty.
At the same time that community colleges are utilizing a significant number of part-time faculty, they are also taking a leading role in using technology for instruction. Developing a distance course generally takes more time than developing a face-to-face course (Keramidas et al. 2007; Zhao et al. 2009) and also often entails a significant learning curve to match technology with instructional techniques for faculty not familiar with delivering technology enhanced instruction. Many community colleges lack formal professional development for faculty members (Eddy, 2007) and what little money exists is not usually designated to part-time faculty.
Trends indicate that the use of technology for instructional purposes in community colleges will continue to increase. As noted by Freberg, Floyd, and Marr (1995), ‗‗the potential for technology is enormous. Distance learning provides access to higher education for underserved segments of the population and increases faculty productivity‘‘ (p. 145). There is no question that distance education will increase access to higher education for many populations of students, ‗‗however, responsibility for instructional quality and control, the improvement of learning, and the aggregate effectiveness of distance education will rest on the faculty‘‘ (Olcott & Wright, p. 5, 1995). In the case of the community college, this means that the increasing number of part-time faculty will need to take a more proactive role in utilizing instructional technology. Although it has been reported that faculty are the key to successful
implementation and outcomes of distance education, many studies cite faculty resistance to instructional technology as a primary barrier to the continued growth of distance education programs (Jones et al., 2002, p. 3). Olcott and Wright (1995) observed that many faculty resist participation in distance education. As community colleges continue their trend of increased utilization of distance education, faculty resistance must be addressed and resolved. As Surry and
Land (2000) noted, ‗‗to increase the utilization of technology on campus, administrators will have to understand technological change from the faculty‘s perspective and develop strategies for encouraging faculty
to use technology‘‘ (p. 149). To develop appropriate strategies to encourage faculty use, it is imperative that administrators understand the factors that affect faculty use of technology. Research must be conducted to determine these factors. This research is becoming more and more important as the demand for distance education and
technology-enhanced courses will continue to increase in the future.
The U.S. Department of Education (Warburton, Chen, & Bradburn, 2002) reported that in the fall of 1998 part-time instructional faculty were less likely to have access to the Internet than full-time faculty. In addition, full-time faculty were more likely to use e-mail and course-specific websites than their part-time counterparts. A national study (1999 data) of community college faculty (Akroyd, et al. 2004) found that while majority of both full-time (93 %) and part-time faculty (84 %) had some type of Internet access at their college, for those without access, 40% were part-time faculty compared to only 14% of full-time faculty.
There is a need to examine current data to determine if the past discrepancies between internet access for full-time community college faculty and their part-time counterparts have been addressed. With more reliance on the use of part-time faculty, community colleges have hopefully attempted to provide equal internet access to all faculty. Additionally, determining factors that predict the use (or lack of utilization ) of technologically enhanced instruction for community college faculty and making comparisons between groups (full and part time) would provide administrators insights for faculty development.
Theoretical Framework
Equity theory which is sometimes referred to as expectancy theory addresses the perceived relative fairness of rewards resulting from a person's job performance and
accomplishments and considers the employee's inputs (e.g., experience, education, efforts, skills, abilities) and outcomes (e.g., salary, bonuses, promotions, recognition) relative to a comparison employee (Borkowski, 2005; Porter & Lawler, 1968). Expectancy Theory explains a person's motivation to perform using three factors: valence, instrumentality, and expectancy. Valence refers to the strength of desire or aversion for an outcome based upon the individual's value for the outcome. Instrumentality is the person's perception that performance (behavior, input) will lead to outcomes that are valued by the individual (rewards, outcomes). Expectancy is described as the person's perception that effort (i.e., action, input) will lead to performance and subsequent outcome (i.e., reward, outcome).
Expectancy is described as the person's perception that effort (i.e., action, input) will lead to performance and subsequent outcome (i.e., reward, outcome). Rewards may be intrinsic (generated within the individual) and/or extrinsic (generated by the organization). The employee's view of various aspects of their job is proportional to the perceived amount and equitability of rewards (Borkowski, 2005).
Using the above framework, community college faculty work is conceptualized as consisting of a variety of intrinsic and extrinsic rewards. The research question for this study is;
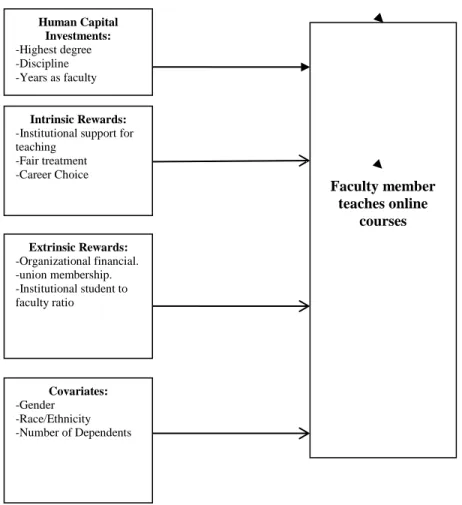
What is the predictive ability of Human Capital (highest degree, discipline and years experience in teaching), Intrinsic Reward Variables (institutional support for teaching, fair treatment of women and minorities and career choice), Extrinsic Reward Variables (organizational financial rewards, union membership and student faculty ratio), and
covariates (gender, ethnicity, and number of respondents dependents) on full-time and part time community college faculty teaching online courses?
Methodology
Research Design. This study utilized a nationally representative sample of community college faculty and employed a quantitative explanatory non-experimental research design (Johnson, 2001). A survey was used to gather the data and sampling procedures enabled the results to be generalized to all full-time and part-time community college faculty.
Sample. The dataset to be used for this research study is the 2004 National Study of Postsecondary Faculty (NSOPF:04), a nationally representative survey sponsored by the U.S. Department of Education‘s National Center for Education Statistics (NCES). The original NSOPF:04 sample included 980 responding institutions and 26,110 responding faculty and instructional staff within those institutions. For this study, the sample was reduced to include only full-time community college faculty employed at public 2-year institutions whose principle activity was teaching for-credit courses during fall semester of 2003. Application of these criteria yielded a sample of 2309 respondents.
Factor Analysis of Intrinsic and Extrinsic Rewards Variables.
To establish construct validity of the intrinsic and extrinsic variables (factors), an exploratory factor analysis was conducted. Responses to seven questions and four opinion questions (eleven total items) were reduced into a smaller set of latent constructs (i.e., factors) by performing an exploratory factor analysis using squared multiple correlations as prior communality estimates. The factors were initially extracted using the maximum likelihood method. Following extraction, the factors were rotated using a promax oblique rotation. Three factors displayed eigenvalues greater than 1.00 suggesting that they be retained. The scree plot presented in Figure 4.1 illustrates all the eigenvalues and supports the idea that three factors are meaningful.
Table 1
Survey Items, Corresponding Factor Loadings and Final Communality Estimates (h²)
Code Survey Item Factor1 Factor 2 Factor3 h²
α=.75 α=.77 α=.70
Q61A Satisfaction with authority to make decisions 31 13 12 0.22 Q61B Satisfaction with technology-based activities 81 -2 -6 0.59 Q61C Satisfaction with equipment/facilities 70 -5 -3 0.43 Q61D Satisfaction with institutional support for 61 4 12 0.50 teaching improvement
Q82A Opinion: teaching is rewarded 34 19 21 0.37
Q82B Opinion: part-time faculty treated fairly 30 29 3 0.28
Q82C Opinion: female faculty treated fairly 1 82 -1 0.67 Q82D Opinion: racial minorities treated fairly -1 77 -2 0.58
Q62B Satisfaction with salary -5 -2 83 0.63
Q62C Satisfaction with benefits 3 -3 67 0.45
For interpretation of the rotated factor pattern, items were determined to load for a factor if the factor loading was .40 or greater for that factor and less than .40 on all other factors. Using these criteria, three factors loaded for the first factor labeled Institutional Support for Teaching (support_teach). Two items loaded for the second factor labeled Fair Treatment of Vulnerable Populations (fairtrmt). Three items loaded for the third factor labeled extrinsic organizational financial (ex_org_fin). The three retained factors demonstrate simple structure, and each accounts for more than 10% of the variance (69% factor 1, 18% factor 2, and 13% factor 3) totaling nearly 100% variance. Three items failed to load on any factor: Q61A-Satisfaction with authority to make decisions; Q82A- Opinion that teaching is rewarded; and, Q82B-Opinion that part-time faculty are treated fairly.
The measurement model that emerged from the factor analysis that also includes all the binary variables is illustrated in Figure 1 below.
Figure 1. Measurement Model
Cronbach‘s coefficient alpha (α) was calculated to assess the reliability of the underlying constructs within the retained factors. Reliability coefficient measures equal to or greater than 0.70 are considered adequate for social science research studies (Hatcher, 2004). In this study, reliability estimates were 0.75, 0.77, and 0.70 for the three extracted factors respectively: Institutional support for teaching, fair treatment of vulnerable groups, and extrinsic organizational financial aspects.
Human Capital Investments: -Highest degree -Discipline -Years as faculty Intrinsic Rewards: -Institutional support for teaching -Fair treatment -Career Choice Extrinsic Rewards: -Organizational financial. -union membership. -Institutional student to faculty ratio Faculty member teaches online courses Covariates: -Gender -Race/Ethnicity -Number of Dependents
Instrumentation.
Specific questions have been selected from the NSOPF:04 survey to gather responses related to human capital investments, work rewards (intrinsic and extrinsic), and socio-demographics. Previous research has been used to guide the selection of appropriate proxy variables to use from the NSOPF:04 data for this study. Additionally the above factor analysis provides the evidence of validity and reliability for the three additive scales used (support for teaching, fair treatment of vulnerable groups and extrinsic organizational financial
considerations).
Dependent Variable. The dependent variable selected for this study is a question that asks respondents if they taught an online course (online; 1 = yes, 0 = no). This variable will
constitute the binary dependent variable for the logit model.
Human Capital. Proxy measures for the independent variables related to human capital from the NSOPF:04 questionnaire are highest degree (highdeg; 0=bachelors or less and 1= masters or higher), years respondent has been teaching and discipline (discplin; 1 =
vocational/occupational, 0 = arts and sciences).
Intrinsic Rewards. There were three factors related to the intrinsic nature of faculty work. First, three likert type questions related to institutional support of teaching aspects of the job (technology, equipment and institutional support for improving instruction) were combined to measure support of instruction(support_teach). Two likert type questions related to treatment of women and minorities were combined to measure fair treatment of faculty (fairtrmt). The third intrinsic factor was career choice (career_choice) measured by one question asking respondents if they had it to do over would they choose an academic career (0=yes and 1=no).
Extrinsic Rewards. There were 3 factors related to extrinsic organizational factors that could impact faculty work. First, three likert questions related to benefits, salary and workload were combined to measure extrinsic financial aspects (ex_org_fin). The second extrinsic factor was student faculty ratio (st_fac_ratio) of the institution measured by a question taken from the institutional data. The third factor was union membership (union_member) which was a
question asking each respondent if there was a recognized union that bargained for faculty at that institution (0=no and 1= yes).
Covariates. There were 3 covariates added to the model to control for any possible effects of gender (gender; 0=female and 1=male), ethnicity (ethnic; 0=minority and 1=majority) and the number of dependents (dependents; number) for each respondent.
Analysis.
Binary logit analysis (i.e., logistic regression) will be used to examine the predictive value of the above independent variables on the dependent variable (taught an online course, 1 = no, 0 = yes). It is appropriate to use logistic regression when the dependent variable is binary. Logistic regression will identify: 1) the significance of the model; 2) which independent variable(s) contribute to the dependent variable, and 3) the odds ratio for each significant independent variable (Allison, 1999).
Results
The demographics of the full time and part time faculty are displayed in Table 2. As it demonstrate the gender distribution for part time faculty was evenly divided (50% male and 50% female) for the full time group a slightly higher percentage of full time faculty were male (57%).
Regarding race the part time group had a greater percentage of minority members (36%) than did the full time faculty group (29%), although both groups were predominantly white. The
disciplinary differences in the two groups was to be expected with 60% part time faculty associated with the arts and sciences compared to 53% for the full time group. The age of the full and part time faculty was not statistically different.
The mean fulltime faculty age was 48.9 years and part time faculty was 47.9. The marital status of both groups was slightly different with 77% of full time faculty married while 73% of part time faculty were married. There was a slightly greater % of part time faculty who were not married (27%) compared to full time faculty (23%).
Table 2
Demographic Information for Full-Time and Part-Time Faculty Full-Time Faculty Part-Time Faculty Gender Male 57% 50% Female 43% 50% Race Majority 71% 64% Minority 29% 36% Discipline Occupational Ed 47% 40% Arts/Sciences 53% 60%
The results of this logistic regression model for factors that predict full time faculty use of online instruction are listed in Table 3. The model was significant (p<.0001, Chi Square = 2280.99). The logistic regression analysis revealed that 3 of the 12 predictor variables have a statistically significant effect on the predicted odds of full time faculty teaching online courses. Full time faculty with masters degrees or higher did less online instruction than fulltime faculty with a bachelor‘s degree or less (highdeg, Pr <.000, odds ratio= .332). In other words full time faculty with master degrees or higher are 67% less likely to teach online courses than their counterparts with a bachelor‘s degree or less. The second variable in the model that was significant was discipline. Full time faculty in the arts and sciences are more 34% more likely to teach online courses than those in the occupational or vocational areas (discplin, Pr = .046, odds ratio= 1.34). Finally those who see women and minorities not treated fairly at their institution are about 9% less likely to teach online courses (fairtrmt, Pr=.049, odds ratio = .91).
Table 3. Logistic regression result on factors that predict online teaching for full time faculty
Standard Wald
Parameter DF Estimate Error Chi-Square Pr > ChiSq
Highdeg 0 1 -0.5514 0.1154 22.8433 <.0001* Discplin 0 1 0.1469 0.0744 3.9017 0.0482* Yearsteach 1 0.0013 0.0062 0.0438 0.8342 Supprt_teach 1 0.0606 0.0437 1.9181 0.1661 Fairtrmt 1 -0.0918 0.0468 3.8551 0.0496* Career_choice 1 0.3562 0.2834 1.5793 0.2089 Ex_org_fin 1 -0.0459 0.0369 1.5470 0.2136 st_fac_ratio 1 -0.0095 0.0101 0.8898 0.3455 Gender 0 1 0.0226 0.0628 0.1297 0.7187 Ethnic 0 1 -0.1089 0.0695 2.4546 0.1172 Dependents 1 -0.0062 0.0616 0.0103 0.9191 Union 0 1 0.0964 0.0665 2.1041 0.1469 Likelihood ratio (p=<.0001, chi-square = 2280.99, C statistic = .621
The results of this logistic regression model for factors that predict part time faculty use of online instruction are listed in Table 4. The model was significant (p<.0001, Chi Square = 1642.86). The logistic regression analysis revealed that 2 of the 12 predictor variables had a statistically significant effect on the predicted odds of part time faculty teaching online courses. The two variables had only a slight (albeit statistically significant) effect. They were different variables than those found to significantly impact the prediction of full time faculty‘s teaching online courses. Part time faculty at institutions with high student faculty ratios (st_fac_ratio) were about 6% less likely to teach online courses when compared to their counterparts at institutions with low student faculty ratios. As the number of dependents for part time faculty increased they were 15% more likely to teach online.
Table 4. Logistic regression result on factors that predict online teaching for part time faculty
Standard Wald
Parameter DF Estimate Error Chi-Square Pr > ChiSq Highdeg 0 1 0.00772 0.1235 0.0039 0.9502 Discplin 0 1 -0.0997 0.1047 0.9064 0.3411 Yearsteach 1 0.0113 0.00780 2.1160 0.1458 Supprt_teach 1 0.0481 0.0773 0.3873 0.5337 Fairtrmt 1 -0.1243 0.0847 2.1568 0.1419 Career_choice 1 -0.1305 0.2958 0.1945 0.6592 Ex_org_fin 1 0.0520 0.0324 2.5758 0.1085 St_fac_ratio 1 -0.0629 0.0214 8.6615 0.0033* Gender 0 1 0.0348 0.0909 0.1461 0.7023 Ethnic 0 1 -0.0144 0.0926 0.0241 0.8766 Dependents 1 0.1450 0.0661 4.8127 0.0283* Union 0 1 0.0676 0.1340 0.2543 0.6141 *statsitically significant Discussion
First it should be noted that breakdown of full time to part time faculty in this representative nationally representative sample used for this study was 51% part time (2280) and 49% full time (2164). While the sample used for this study was subset to include only those who taught credit classes and whose principle activity was teaching, it is important to note that public community colleges faculty nationally are comprised of approximately 43% part time faculty compared to all other instiutions that have less than 11% (U.S. Department of Education, National Center for Educational Statistics, 2010).
The results of this study indicate that the factors that impact full time community college faculty‘s use of on line instruction are different than those for part time faculty. Full time faculty with bachelors degrees or less are more likely to teach online than faculty with graduate dgerees
when holding all other variables constant. This seems to go againt the notion that faculty with graduate degrees may have knowledge and/or skills that would assist with offering online instruction. For part time faculty this variable had no impact on teaching online.
Full time faculty in the arts/sciences had a higher probability of teaching online that those in the occupational/vocational areas. Perhaps in the general education courses that potentially have higher student enrollment for may community college students (math, science English) there is more emphasis to offer a course online to reach out to more nontraditionalstudents. For part time faculty, discipline had no effect on teaching online. More detailed discussion of this will occur at the presentation.
References
Akroyd, D., Gillett-Karam, R., & Boos, D. (1999, April). Satisfaction and institutional support of full-time and part-time community college faculty: A national perspective. Paper presented at the annual meeting of the American Educational Research Association
(Division J), Montreal, CanadaAkroyd, D., Jaeger, A., Jackowski, M., & Jones, L. (2004). Internet access and use of the web for instruction: A national study of full-time and part-time community college faculty. Community College Review, 32(1), 40-51. DOI: 10.1177/009155210403200103
Allison, P. (1999). Comparing logit and probit coefficients across groups. Sociological Methods Research, 28(2), 186-208. DOI: 10.1177/0049124199028002003
Cohen, A. & Brawer, F. (2008). The American community college (5th ed,). San Francisco: Jossey-Bass.
Eddy, P. (2007). Faculty development in rural community colleges. New Directions for Community Colleges, (137), 65-76. DOI: 10.1002/cc.271
Freeberg, L., Floyd, K., & Marr, B. (1995). Faculty attitudes toward distance learning. Journal on Excellence in College Teaching, 6(2), 145–159.
Gahn, S., & Twombly, S. B. (2001). Dimensions of the community college faculty labor market. Review of Higher Education, 24(3), 259-282. DOI: 10.1353/rhe.2001.0002
Huber, M. T. (1998). Community college faculty attitudes and trends, 1997. Stanford, CA: National Center for Post-secondary Improvement, Stanford University.
Jaeger, A. J. & Eagan, K. (2009). Unintended consequences: Examining the effect of part-time faculty members on associate‘s degree completion. Community College Review, 36 (3). 167-194. DOI: 10.1177/0091552108327070
Keramidas, C., Ludlow, B., Collins, B., & Baird, C. (2007). Saving your sanity when teaching in an online environment: Lessons learned. Rural Special Education Quarterly, 23(1), 28-39.
Jones, E. T., Lindner, J. R., Murphy, T. H., & Dooley, K. E. (2002). Faculty philosophical position towards distance education: Competency, value, and educational technology support. Online Journal of Distance Learning Administration, 5(1). Retrieved from
http://www.westga.edu/~distance/ojdla/spring51/jones51.html
Olcott, D., & Wright, S. J. (1995). An institutional support framework for increasing faculty participation in postsecondary distance education. The American Journal of Distance Education, 9(3), 5–17.
Outcalt, C. (Ed.). (2002). Community college faculty: Characteristics, practices, and challenges. New Directions for Community Colleges, 118. San Francisco, CA: Jossey Bass.
Porter, L. W., & Lawler, E.E. (1968). Managerial attitudes and performance. Homewood, IL: Irwin-Dorsey
Roueche, J., Roueche, S., & Milliron, M. (1996). Identifying the strangers: Exploring part-time faculty integration in American community colleges. Community College Review, 23, 33–48.
Surry, D. W., & Land, S. M. (2000). Strategies for motivating higher education faculty to use technology. Innovations in Education and Training International. ISSN 1355–8005. U.S. Department of Education, National Center for Education Statistics. (1997). Instructional
faculty and staff in higher educational institutions: Fall 1987 and Fall 1992. Washington, DC: U.S. Government Printing Office.
U.S. Department of Education, National Center for Educational Statistics. (2010). Digest of Educational Statistics, 2010. NCES # 2011015.
Warburton, E., Chen, X, & Bradburn, E. (2002). Teaching with technology: Use of
telecommunications technology by postsecondary instructional faculty and staff in fall 1998(NCES 2002-161). Washington, DC: U.S. Department of Education, National Center for Education Statistics.
Zhao, J., Alexander, M., Perrault, H., Waldman, L. , & Truell, A. (2009 ). Faculty and student use of technologies, user productivity, and user preference in distance education. Journal of Education for Business, 84(4). 206-212