Deposited in DRO:
01 March 2019Version of attached le:
Published VersionPeer-review status of attached le:
Peer-reviewedCitation for published item:
He, G. and Ren, M. and Taer, R. (2019) 'The impact of corporate tax avoidance on analyst coverage and forecasts.', Review of quantitative nance and accounting. .
Further information on publisher's website:
https://doi.org/10.1007/s11156-019-00795-7Publisher's copyright statement:
This article is distributed under the terms of the Creative Commons Attribution 4.0 International License
(http://creativecommons.org/licenses/by/4.0/), which permits unrestricted use, distribution, and reproduction in any medium, provided you give appropriate credit to the original author(s) and the source, provide a link to the Creative Commons license, and indicate if changes were made.
Additional information:
Use policy
The full-text may be used and/or reproduced, and given to third parties in any format or medium, without prior permission or charge, for personal research or study, educational, or not-for-prot purposes provided that:
• a full bibliographic reference is made to the original source • alinkis made to the metadata record in DRO
• the full-text is not changed in any way
The full-text must not be sold in any format or medium without the formal permission of the copyright holders. Please consult thefull DRO policyfor further details.
Durham University Library, Stockton Road, Durham DH1 3LY, United Kingdom Tel : +44 (0)191 334 3042 | Fax : +44 (0)191 334 2971
ORIGINAL RESEARCH
The impact of corporate tax avoidance on analyst coverage
and forecasts
Guanming He1 · Helen Mengbing Ren2 · Richard Taffler2 © The Author(s) 2019
Abstract
Corporate tax avoidance is likely to be associated with a high level of earnings manage-ment and with high financial opacity in the time-series. On this basis, we hypothesize that analyst coverage is negatively associated with corporate tax avoidance. Our results con-firm this conjecture, and are robust to using a con-firm-fixed-effects model and a quasi-natural experiment to control for potential endogeneity. Additional analysis shows that analyst coverage is negatively related to tax risk, but there is no evidence that the informative-ness of, or errors in, analyst forecasts are associated with tax avoidance. Overall, our study advances understanding of the implications of corporate tax avoidance for analyst behavior.
Keywords Tax planning · Financial opacity · Analyst following · Earnings forecasts
JEL classifications G24 · H26 · M41
1 Introduction
Corporate tax avoidance practices are prevalent. Hanlon and Heitzman (2010) define tax avoidance in a broad sense as “the reduction of explicit taxes” (2010, p. 137), and call for more research in this area. Prior studies (e.g. Lev and Nissim 2004; Weber 2009; Goh et al. 2016) show that income tax expense contains information about the future earnings and economic performance of a firm. As such, tax-related information should affect financial analysts’ decision-making. However, little research attention to date has been paid to the impact of corporate tax avoidance on analysts’ judgements and decisions. The purpose of our study is to examine the impact of corporate tax avoidance on analyst coverage and fore-casts; this should be a worthy goal for both academics and practitioners given the pivotal role analysts play as information intermediaries in stock markets.
Earnings management, given its key role in shaping both managerial tax avoidance behavior and analyst behavior, is the crucial channel through which tax avoidance affects analyst coverage and forecasts. The prevailing literature (e.g. Erickson et al. 2004; Frank * Guanming He
1 Durham University Business School, Durham University, Mill Hill Lane, Durham DH1 3LB, UK 2 Warwick Business School, University of Warwick, Scarman Road, Coventry CV4 7AL, UK
et al. 2009; Desai and Dharmapala 2009; Lennox et al. 2013) documents that earnings management and associated financial opacity have an adverse impact on analyst decision-making, a view that is in line with intuition. However, it is unclear whether firms undertak-ing aggressive financial reportundertak-ing are more, or less, aggressive in their tax plannundertak-ing (e.g. Bradshaw et al. 2001; Elgers et al. 2003; Abarbanell and Lehavy 2003; Burgstahler and Eames 2003; Barth and Hutton 2004; Hodder et al. 2008; Salerno 2014).1
Indeed, the prior evidence on the association between corporate tax avoidance and earn-ings management is mixed. Some studies suggest a positive association between corporate tax avoidance and earnings management. For instance, Frank et al. (2009) show that cor-porate tax avoidance facilitates earnings management and increases the financial opacity of a firm. Other papers (e.g. Erickson et al. 2004; Lennox et al. 2013), however, find that tax-avoiding firms are less likely to pursue aggressive financial reporting. Managing con-currently book income upwards, and taxable income downwards, leads to a large book-tax difference, which can raise a “red flag” of financial misrepresentation or of tax avoidance to outsiders (e.g. Palepu et al. 2000; Hanlon 2005; Kuo and Lee 2016). Thus, in an attempt to avoid outsiders’ suspicions of accounting fraud or of tax avoidance, managers seek to increase corporate tax payments when inflating book income numbers, leading to a nega-tive relation between tax avoidance and earnings management.
In this paper, we argue that there is likely to be a positive time-series relation between corporate tax avoidance and earnings management, but that the contemporaneous associa-tion between the two in the cross-secassocia-tion is likely to be negative. We posit that firms tend to refrain from avoiding income taxes and manipulating earnings in the same fiscal period, because doing so increases book-tax differences, likely attracting scrutiny from tax authori-ties and other external stakeholders. However, managers could pursue earnings manage-ment in one period and tax avoidance in another. Such alternating use of tax avoidance and earnings management across different periods reduces the likelihood of being detected, thereby facilitating concealment of bad news and of managerial misbehavior. Were man-agers to inflate earnings in the current period, suspicions of low earnings quality would arise from any subsequent downwards reversal of earnings. However, avoiding corporate taxes in the next period could mitigate this fall in earnings. Analyst earnings forecasts are normally based on the historical trend in firms’ financial information (e.g. Bradshaw et al. 2014; Palepu et al. 2016). Thus, in the presence of corporate tax avoidance, financial infor-mation used by analysts in forecasting will be more opaque.
Prior studies (e.g. Lang and Lundholm 1996; Healy et al. 1999) document that firms with more information available or more informative disclosures have higher analyst cov-erage. The number of analysts following a firm depends critically on the net benefits of providing analyst services (Bhushan 1989). High financial opacity of a tax-avoiding firm increases the information acquisition and processing costs required of analysts in making unbiased earnings forecasts, thus dis-incentivizing analyst coverage. Furthermore, because of increased risks of inaccurate forecasts and associated reputation issues, analysts would be less likely to cover tax-avoiding firms that tend to have high financial opacity and more financial reporting errors. Therefore, we hypothesize that the level of analyst coverage is negatively correlated with the extent of corporate tax avoidance.
In our empirical analysis, we construct two proxies for corporate tax avoidance: the long-run cash effective tax rate of Dyreng et al. (2008) and the residual domestic book-tax
difference as per Desai and Dharmapala (2006). Our sample period covers the years of 1995–2014 with 29,372 firm–year observations. After controlling for a broad set of deter-minants of analyst coverage, we find economically and statistically significant results con-sistent with our prediction that analyst coverage is negatively associated with corporate tax avoidance. This inference remains unchanged when we use a firm-fixed-effects regression model to control for potential correlated-omitted-variables bias.
To better establish causality for the effect of corporate tax avoidance on analyst cover-age, we follow Hasan et al. (2014) in conducting a quasi-natural experiment that is based on the enactment of Financial Accounting Standard Board Interpretation No.48 (hereafter, FIN48) (FASB 2006). We assign firms that report tax reserves for uncertain tax benefits in the post-FIN48 period as treatment firms (which feature higher corporate tax avoidance), and firms that do not report any uncertain tax position in both the pre- and post-FIN48 periods as control firms (which feature little tax avoidance). In line with Blackwell et al. (2009) and Iacus et al. (2011), we employ a coarsened exact matching approach to match each treatment firm with a control firm for our natural experiment. Using a difference-in-differences research design, we find that analyst coverage is significantly lower for the treatment firms than for the control firms, thus corroborating the negative causal impact of corporate tax avoidance on analyst coverage.
We also conduct additional tests to explore: (i) the impact of tax risk on analyst cover-age, (ii) the impact of corporate tax avoidance on the informativeness of analyst earnings forecasts, and (iii) the impact of corporate tax avoidance on analyst forecast errors. First, to explore the impact of firm tax-position volatility on analyst behavior, we construct a measure of tax risk in terms of the standard deviation of a firm’s effective tax rates over the previous 5 years (e.g. Guenther et al. 2017; Drake et al. 2019). Financial opacity is higher for firms with more volatile tax planning activities, making it more difficult for analysts to cover such firms. Thus, we expect a negative relationship between tax risk and analyst coverage. Our results confirm this. Second, following Frankel et al. (2006), we define the informativeness of analyst earnings forecasts as the magnitude of the stock price reaction to these forecasts. We find no evidence that corporate tax avoidance increases stock price reactions to analyst earnings forecasts, implying that corporate tax avoidance does not trig-ger higher investor demand for analyst services. One potential explanation is that investors are often unable to observe corporate tax avoidance and to understand its adverse impact on a firm’s financial transparency. Third, inter alia for reputation reasons, analysts often choose to cover firms for which they feel confident in making accurate forecasts (Das et al. 2006; Franco et al. 2015). For a tax-avoiding firm that analysts opt to cover, they might incur incrementally higher information gathering and/or processing costs to maintain fore-cast accuracy. As a result, notwithstanding the greater financial opacity that results from tax avoidance, actual analyst forecast errors may not increase. Consistent with this notion, we do not find evidence that corporate tax avoidance increases analyst forecast errors.
This study makes several contributions. First, to the best of our knowledge, this paper is the first to examine the impact of corporate tax avoidance on analyst coverage and fore-casting behavior. In particular, we show that corporate tax avoidance leads to lower analyst coverage but does not materially impact analyst earnings forecasting ability for covered firms.
Importantly, we reconcile the mixed prior evidence on the relation between tax avoid-ance and earnings management by arguing that the association between the two is negative in the cross-section but positive in the time-series. Because analysts rely on the historical trend in financial information in making their earnings forecasts (e.g. Bradshaw et al. 2014; Palepu et al. 2016), corporate tax avoidance is likely to have an adverse impact on analyst
coverage. Our results confirm this. Recent studies by Allen et al. (2016), Chen and Lin (2017), and Chen et al. (2018) examine the effects of analyst coverage on tax aggressive-ness; our paper investigates a different research issue, i.e., the causal impact of corporate tax avoidance on analyst coverage. Our natural experiment design used to establish this causality relationship is in line with Hasan et al. (2014).
Second, we complement the tax literature on the consequences of corporate tax avoid-ance. Prior studies (e.g. Chen et al. 2010; Graham et al. 2014; Menichini 2017; Cen et al. 2017) document that the main benefit of corporate tax avoidance to a firm lies in the tax savings and associated increased cash flow. However, there are potential negative conse-quences to corporate tax avoidance, including reputational losses (Chen et al. 2010; Han-lon and Slemrod 2009), tax examination costs (Mills 1998; Mills and Newberry 2001), increased litigation risk (Graham and Tucker 2006), increased audit fees (Hanlon et al. 2012; Donohoe and Knechel 2014; Kuo and Lee 2016), substantive penalties imposed by tax authorities (Wilson 2009; Li et al. 2018), reduction in shareholder wealth due to mana-gerial rent extractions (Desai and Dharmapala 2006, 2009), heightened stock price crash risk (Kim et al. 2011), and an increase in cost of capital (e.g. Hasan et al. 2014; Isin 2018). We extend this tax-consequences literature by showing that corporate tax avoidance also leads to a decline in analyst coverage.
Last, but not least, our study has practical implications. Specifically, managers’ alternate use of tax avoidance and earnings management can facilitate and mask their rent extrac-tion, arguably leading to resource misallocation in financial markets. By showing that cor-porate tax avoidance has an adverse impact on firm coverage by financial analysts who are key information intermediaries, we flag concerns about potential reduced market effi-ciency. Our findings should thus be of interest to, among other parties, shareholders in their monitoring of managerial opportunism, and regulators and tax authorities seeking to better regulate corporate taxation and associated disclosure policies. One way to curb managers’ tax avoidance activities, as suggested by Kuo and Lee (2016), is to increase the conformity between book and taxable income measures.
The remainder of this paper proceeds as follows. Section 2 develops our hypothesis. Section 3 describes our sample and research design. Section 4 discusses our empirical results. Section 5 carries out additional analyses, and Sect. 6 concludes.
2 Hypothesis development
Analysts play an important role in capital markets: they provide forecasts and stock recom-mendations to investors to aid their investment decisions (Marcus and Wallace 1991; Lin et al. 2018; Aggarwal et al. 2018). In this paper, we explore the consequences of corporate tax avoidance on analyst behavior. Our main thesis is that corporate tax avoidance leads to reduced information transparency and to greater difficulty in forecasting earnings, thus reducing analyst incentives to follow firms. Despite an extensive literature on corporate tax avoidance, its impact on analyst coverage has not been explored in the literature. In this section, we derive our main hypothesis and discuss related issues.
2.1 Corporate tax avoidance and information opacity
Extant academic research documents that corporate tax aggressiveness reduces the quality of the information environment of firms, rendering corporate information more opaque.
For example, corporate tax avoidance involves complex tax transactions and thus can be used to hoard bad news associated with managerial rent extraction, leading to such rent extraction going undetected for extended periods (Desai and Dharmapala 2006, 2009; Kim et al. 2011). Comprix et al. (2011) show that large book-tax differences, which proxy for corporate tax avoidance, are associated with greater uncertainty about a firm’s fundamen-tals, and with an increased difference in opinion among investors. Hope et al. (2013) find that corporate tax avoidance is associated with fewer disclosures of geographic earnings by U.S. multinational firms, leading to reduced earnings informativeness (Hope et al. 2009). By and large, the empirical evidence illustrates the adverse impact of tax avoidance on cor-porate information transparency, with potential implications for analyst behavior.
2.2 Corporate tax avoidance and earnings management
Earnings management adversely affects the quality of analysts’ earnings forecasts. Although extant research examines the relation between corporate tax avoidance and earnings management, the results are mixed. Some researchers argue that tax avoidance is accompanied by earnings manipulation. For example, Frank et al. (2009) document a positive association between aggressive tax reporting and aggressive financial reporting, suggesting that managers tend to make financial and tax decisions in a way that boosts financial reporting income and reduces taxable income. Similarly, Desai and Dharmapala (2006, 2009) show that managers reduce taxable income and inflate earnings in the dual-reporting setting. On the other hand, other studies document that corporate tax avoidance is negatively related to earnings management. For example, Lennox et al. (2013) predict, and find, that tax- aggressive firms are less likely to engage in fraudulent financial reporting. Erickson et al. (2004) find that firms committing accounting fraud pay more taxes on their fraudulently reported earnings, which suggests that firms regard the benefits from inflating earnings as outstripping the additional tax costs incurred.
In the face of the conflicting evidence on the association between corporate tax avoid-ance and earnings management, we contend that the lead-lag association between tax avoidance and earnings management is likely positive in the time-series, but that the con-temporaneous relation between the two is likely negative in the cross-section. We postu-late that managers are less likely to engage in aggressive tax planning and earnings man-agement simultaneously, because any conspicuous increased book-tax difference resulting would likely cause outsiders to suspect that the managers have either inflated earnings or avoided income taxes.
Instead, managers may manipulate earnings in one period, and avoid corporate income taxes in another, so that book-tax differences will not appear significantly increased, as compared with implementing tax avoidance policies and earnings management in the same fiscal period. On the one hand, earnings inflation might be preceded by tax avoidance in managerial strategies designed to disguise bad news associated with rent extraction (Desai and Dharmapala 2006, 2009). Though tax avoidance can be used as a tool to conceal bad news (Kim et al. 2011), it is hard for managers to iterate tax avoidance in consecutive years without being detected by the tax authorities. So, in an attempt to hoard bad news over an extended period, managers may pursue tax avoidance in a particular year, and alternate this with upwards earnings management in the following year. On the other hand, tax avoid-ance could in turn follow earnings inflation to window-dress firm performavoid-ance. Earnings inflated in one period are likely to attract suspicion by outsiders once the inflated earnings
reverse in the subsequent year; however, an increase in cash flow due to tax avoidance activities can help mitigate the adverse effects of such earnings reversals.
All in all, the alternating use of tax avoidance and earnings management strategies across different years could serve to distract the attention and vigilance of outsiders, thereby allowing managers to take advantage of self-serving opportunities. Such a covert strategy would render corporate information more opaque and less understandable in the time-series. Analysts form their earnings forecasts based on the trend in a firm’s financial figures over several years rather than on the firm’s financial report for a particular year (e.g. Bradshaw et al. 2014; Palepu et al. 2016). Therefore, corporate tax avoidance will serve to obfuscate the financial information used by analysts in their earnings forecasts, making accurate forecasting more difficult, and potentially leading to analysts’ reluctance to follow such tax-aggressive firms.
2.3 The effect of corporate tax avoidance on analyst coverage
The fundamental drivers of analyst coverage are the supply of, and demand for, analyst services (Bhushan 1989; Frankel et al. 2006). From the “supply-curve” perspective, the supply of analyst services depends on the information acquisition and processing costs ana-lysts incur in providing their forecast services. Research suggests that anaana-lysts tend to fol-low more transparent firms, since these firms are less costly to folfol-low (Chang et al. 2006; Yu 2008; Irani and Oesch 2013). For instance, Yu (2008) shows that earnings management activities reduce analyst coverage as analysts need to exert more effort, and incur more costs, in penetrating the resulting more opaque financial disclosures.
Forecast accuracy is an important determinant of an analyst’s compensation and career prospects (Stickel 1990; Mikhail et al. 1999; Hong and Kubik 2003; Ke and Yu 2006; Emery and Li 2009; Wu and Zang 2009; Brown et al. 2015; Roger 2018). For example, Stickel (1990) shows that earnings forecast accuracy is viewed as an important indicator of analyst ability, and that “All-Star” analysts who make more accurate earnings forecasts are paid more than their peers. Mikhail et al. (1999) find that the probability of analyst turno-ver increases for those analysts with lower forecast accuracy relative to their peers that fol-low the same firm. Therefore, analysts have an incentive to make more accurate forecasts.
Corporate tax avoidance not only makes financial information itself more opaque, as documented in prior research (e.g. Desai and Dharmapala 2006; Graham and Tucker 2006; Kim et al. 2011; Hope et al. 2013; Crabtree and Kubick 2014), but also is likely associated with a higher level of earnings management activities in the time-series, as discussed in the previous section. As a result, ceteris paribus, it becomes more difficult for analysts to make accurate forecasts. Put differently, to maintain forecast accuracy for a tax-aggressive firm, analysts have to incur higher information gathering and/or processing costs, thereby reducing their incentive to follow the firm. If, on the other hand, analysts are not prepared to incur the increased costs for a tax-aggressive firm, their forecasts will be less accurate, harming their reputation as well as compensation and career prospects. Therefore, more tax-aggressive firms are less attractive to financial analysts. The main hypothesis of our paper based on the supply-curve argument follows:
H1:Analyst coverage is negatively associated with corporate tax avoidance
On the other hand, when a firm’s financial information becomes more opaque as a result of its tax avoidance activities, there is likely to be an increased investor demand for analyst
services, which should in turn lead to greater analyst coverage. This “demand-curve” argu-ment, however, is based on the assumption that investors are able to observe corporate tax avoidance and to understand its adverse impact on a firm’s financial transparency. Such an assumption does not necessarily hold. Investors, who are generally constrained in their information processing abilities and do not have access to private information, are usually unable to observe complex tax avoidance transactions; high information opacity resulting from corporate tax avoidance is often difficult to see through in the absence of necessary information provision and appropriate professional expertise. In addition, analysts might not be sufficiently sophisticated to appreciate the implications of corporate tax avoidance for future earnings. Therefore, the demand-curve argument, which posits that corporate tax avoidance will trigger higher investor demand for analyst services, is intuitively less per-suasive. We also test and refute this argument in Sect. 5.2.2 Nonetheless, we employ the
supply-curve argument to establish H1 as intuitively more plausible.
3 Sample and research design
In this section, we describe our data sample, variables, and research design. 3.1 Data sources and sample
Because the release dates of analyst forecasts are not accurately represented in the I/B/E/S detail file prior to 1995 (Frankel et al. 2006; Clement et al. 2011), our sample period begins in that year; it ends in 2014. As with prior research (e.g. Frankel et al. 2006; Cheng and Subramanyam 2008; Batta et al. 2016; Jin et al. 2016), we focus on firm coverage and forecasts by sell-side analysts. Data on the analyst coverage and forecasts are obtained from I/B/E/S. Data on institutional holdings are collected from Factset. Other data are taken from CRSP and Compustat. We require that firm–year observations have necessary data available on CRSP, Compustat, I/B/E/S, and Factset to construct the variables of interest for our empirical tests. Our final sample used for testing the impact of corporate tax avoid-ance on analyst coverage consists of 29,372 firm–year observations for 7285 unique firms. 3.2 Measures of corporate tax avoidance
We use two corporate tax avoidance measures in our main tests. The first is the long-run effective tax rate (lretr) as per Dyreng et al. (2008). This is computed as the sum of corpo-rate income tax paid, divided by the sum of a firm’s pre-tax income net of special items, over the previous 5 years. High lretr indicates low corporate tax avoidance. It is hard for managers to avoid corporate income taxes in successive years without being detected. Hence, volatile tax positions are likely to reflect managers’ tax planning strategies. Use of a one-year effective tax rate to measure the extent of corporate tax avoidance inevitably involves measurement errors. The long-run effective tax rate gets around this measurement issue. Also, the use of this long-term measure fits well with our conceptual argument that
2 In fact, in contrast to our strong evidence consistent with the supply- curve argument, Sect. 5.2 finds no
managers are likely to use earnings management and tax avoidance alternately in different years for opportunistic purposes.
Our second tax avoidance measure is the residual domestic book-tax difference (ddmpbtd) of Desai and Dharmapala (2006), which is calculated as the residual, 𝜀i,t , of the following firm-fixed-effects regression model:
where mpbtd is the Manzon and Plesko (2002) book-tax difference. In calculating mpbtd, we follow Cheng et al. (2012) in excluding foreign tax expense from the total current tax expense. ta is total accruals calculated as per Hribar and Collins (2002). ui represents
firm-fixed effects which control for the effect of unobserved firm characteristics on mpbtd. A large book-tax difference could result from either upwards earnings management or cor-porate tax avoidance (Kuo and Lee 2016). The Desai and Dharmapala (2006) measure purges the book-tax difference attributed to earnings management activities, and thus is more powerful than the Manzon and Plesko (2002) book-tax difference (mpbtd) in captur-ing the extent of corporate tax avoidance. High ddmpbtd indicates a high level of corporate tax avoidance.
3.3 Multivariate tests of H1
To test the effect of corporate tax avoidance on analyst coverage, we start by using the fol-lowing pooled OLS regression model:
where lanacov is analyst coverage, calculated as the natural logarithm of one plus the num-ber of analysts that make at least one annual EPS forecast for a firm in a fiscal year. lana-cov is equal to 0 if there is no analyst forecasting annual EPS for the firm in a particular year. ddmpbtd and lretr are defined as previously. Because a high (low) value of ddmpbtd (lretr) represents a high level of corporate tax avoidance, we expect that if the coefficient on ddmpbtd (lretr) has a negative (positive) sign and is statistically significant, then our results support H1.
Model (2) also includes a wide range of control variables that prior literature finds to be associated with analyst coverage. Bhushan (1989) claims that larger firms are more attrac-tive to outside investors, spurring the demand for analyst services for these firms, and lead-ing to greater analyst followlead-ing. Thus, we control for firm size (size) and predict it to be positively correlated with analyst coverage. Brokerage houses are likely to encourage their analysts to cover more actively traded firms (Frankel et al. 2006), hence we include trad-ing volume (tradingvol) as a control variable, and predict its positive relation with analyst coverage.
We control for three proxies for firm-specific uncertainty: equity beta (beta), return vol-atility (retvol), and earnings volatility (stdeps), which should be positively associated with investor demand for analyst services and thus with increased analyst coverage (Bhushan 1989). On the other hand, analysts might have weak incentives to follow firms that have high stock price or high abnormal stock returns (Brennan and Hughes 1991), because such firms might underperform in subsequent periods. Thus, we also control for stock price (price) and abnormal stock returns (qtrret) in our model, and expect these two variables to be negatively related to analyst coverage.
(1)
mpbtdi,t= 𝛽1tai,t+ui+ 𝜀i,t
(2)
lanacovi,t= 𝛼0+ 𝛼1lretri,t(ddmpbtdi,t) +
∑
k
Analysts prefer to cover highly-profitable and financially-healthy firms (e.g. Das et al. 2006; Lee and So 2017). Thus, we control for pre-tax return on assets (roa) and finan-cial constraints (hp).3 The higher (lower) a firm’s pre-tax return on assets is (financial
con-straints are), the more likely analysts are to follow the firm. We also control for institu-tional ownership (insti), but the direction of the effect of institutional ownership on analyst coverage is ambiguous. If institutions rely on analyst reports to make their trading deci-sions and to fulfil their fiduciary responsibilities, greater institutional stock-holding should induce more analyst following (O’Brien and Bhushan 1990). Nonetheless, institutions are arguably sophisticated investors who are able to predict future firm performance and stock returns (Gompers and Metrick 2001; Cohen et al. 2002; Yan and Zhang 2009). In addition, institutions also serve a monitoring role (Chen et al. 2007), prompting firms to disclose more relevant information to the public (Healy et al. 1999; Ajinkya et al. 2005), and thereby reducing investor demand for analyst services. As such, analysts might be less inclined to cover a firm with high institutional ownership.
Prior studies (e.g. Lang and Lundholm 1996; Chang et al. 2006; He et al. 2019) provide evidence that analyst coverage is related to information asymmetry. Therefore, we include in our regression model research and development expenditures (rd), intangible assets (intangible), and book-to-market ratio (btm), which are used in prior literature as proxies for information asymmetry. Firms that have higher research and development expenditures, more intangible assets, or lower book-to-market ratios are likely to have greater informa-tion asymmetry with outsiders (Smith and Watts 1992; Aboody and Lev 2000; Gu and Wang 2005; Huddart and Ke 2007), and are thus expected to be followed by fewer analysts.
We also consider the impact of Regulation Fair Disclosure (FD), which prohibits firms from selectively releasing private information to analysts. Absent private information from management, analysts have to incur higher information acquisition and/or processing costs to maintain forecast accuracy, and as a result, they might be less willing to cover firms (Irani and Karamanou 2003; Mohanram and Sunder 2006; Chen et al. 2016). We there-fore use an indicator variable for the post-FD period (fd) in our regression. Finally, as ana-lysts prefer to follow firms that are in more regulated industries (O’Brien and Bhushan 1990), we include an indicator variable for industrial regulatory status (regulated). All our control variables are defined in detail in the Appendix. While including year dummies in the regression to control for potential time effects, we cluster the standard errors of our regression coefficients by both firm and year to control for possible correlations of residu-als within firms and years (Gow et al. 2010; Thompson 2011).
Although we include an extensive list of control variables in the regression, we can-not completely exclude the possibility that our regression model still omits some variables that might be related to both corporate tax avoidance and analyst coverage. To address this concern, we re-estimate model (2) using the firm-fixed-effects regression technique, which holds unobserved firm characteristics constant and thereby alleviates endogeneity attrib-uted to potentially omitted variables (e.g. Wooldridge 2016).
3.4 Control for endogeneity—A quasi‑natural experiment (FIN48)
To strengthen our inferences and explore in more detail the causal relationship between corporate tax avoidance and analyst coverage, we also conduct a quasi-natural experiment.
Recent tax research (e.g. Robinson and Schimidt 2013; Brown et al. 2016; Gupta et al. 2016) considers an alternative measure of corporate tax avoidance, namely, unrecog-nized tax benefits (hereafter, UTB). UTB stands for tax reserves for uncertain tax posi-tions, which might or might not be sustained upon IRS audit. UTB can potentially capture corporate tax avoidance activities that might be opposed by tax authorities (e.g. Lisowsky et al. 2013). The Financial Accounting Standards Board Interpretation No. 48 (i.e., FIN48) (FASB 2006), which relates to the appropriate accounting treatment for UTB, was imple-mented in June 2006 and became effective from December 2006. Prior to FIN48, firms were reluctant to disclose their UTB because it reflects their tax aggressiveness (Gleason and Mills 2002). Following FIN48, all firms are required to fully disclose their UTB, if any. As a result, any uncertain tax-position reserves set up by firms to avoid taxes before FIN48 are publicly disclosed after FIN48, creating information shock with respect to UTB. Furthermore, recent studies (e.g. Robinson et al. 2016, 2017; Gleason et al. 2018) pro-vide epro-vidence that FIN48 lowers the informativeness and value relevance of corporate tax disclosures. Therefore, the promulgation of FIN48 provides a nice natural experiment to examine the causal impact of corporate tax avoidance on analyst following.
Hasan et al. (2014) use FIN48 to conduct a natural experiment to examine the causal impact of corporate tax avoidance on the cost of bank loans. Following Hasan et al. (2014), we define a treatment firm as a firm that discloses UTB in any of the 3 years after FIN48, and a control firm as one that reports no uncertain tax position in both the pre- and post-FIN48 periods. Our natural experiment uses data for the three-year period 2003-2005 before FIN48, and the three-year period 2007–2009 after FIN48. In line with H1, if ana-lysts use the increased UTB-based disclosures, which result from the adoption of FIN48, to infer a firm’s tax avoidance, then the treatment firms should show a relative decline in analyst coverage after FIN48, compared with the control firms. To test this prediction, we employ the following difference-in-differences (DiD) regression model:
where the indicator variable yutb is used to indicate the pre- versus post-FIN48 periods for our sample: yutb equals to 1 (0) if a firm is in the years of 2007–2009 (2003–2005). We use tutb = 1 (tutb = 0) to indicate a firm–year observation being in the treatment (control) group. utbinteract is the interaction term between yutb and tutb. The same set of control variables as in model (2), as well as year and industry dummies, are included in model (3) to perform our difference-in-differences test. We focus on the coefficient on utbinter-act because it reflects the difference-in-differences change in analyst coverage between the treatment and control firms across the post- and pre-FIN48 periods. If H1 holds, utbinter-act should have a negative, statistically significant coefficient.
A DiD design requires that the assignment of observations into treatment and control groups is random, but FIN48 might affect such an assignment in a way that induces sys-tematic imbalances in pre-FIN48 covariates between our treatment and control groups. To address this concern, we implement the k-to-k coarsened exact matching (CEM) approach, as with Blackwell et al. (2009) and Iacus et al. (2011), to match each of our treatment firms with a control firm to form our sample for the DiD analysis. Matching is conducted by estimating the regression of corporate tax avoidance on its determinants which include firm size (size), firm age (firmage), book-to-market ratio (btm), financial leverage (lev), pre-tax return on assets (roa), property, plant and equipment (ppe), intangible assets ( intangi-ble), equity income (equityic), and foreign income (foreignic) (e.g. Cheng et al. 2012; Hope
(3) lanacovi,t= 𝛼0+ 𝛼1yutbt+ 𝛼2tutbi+ 𝛼3utbinteract+
∑
k
et al. 2013; Gao et al. 2016; Cen et al. 2017). 537 matched pairs are identified following the k-to-k CEM matching.
Panel A of Table 4 reports the L1 statistics, which are used to check the quality of the matching (e.g. Blackwell et al. 2009; Iacus et al. 2011). The overall L1 statistic for the post-matched sample is 0.6851, which is substantially lower than that (i.e., 0.9868) for the pre-matched sample. Also, the L1 statistics of the majority of the covariates are significantly reduced after the matching. Therefore, the quality of our matching is assured.
The DiD design is predicated on the parallel trend assumption that the outcome variable exhibits a similar trend for both the treatment and control groups in the pre-event period. Panel B of Table 4 shows that the average lanacov of the treatment group is statistically indifferent from that of the control group in any year of our pre-FIN48 sample period, thus supporting the parallel trend assumption.
In addition, we also use UTB as an alternative measure of corporate tax avoidance to test H1. We first restrict our sample to span only the post-FIN48 period (i.e., 2007–2014), in which firms are required by FIN48 to disclose any change in tax reserves as adjustments to stockholders’ equity. Then we substitute utb for lretr (ddmpbtd) in Eq. (2) and re-run the regression. The variable, utb, is defined as the natural logarithm of one plus a firm’s uncertain tax benefits at the end of a fiscal year. The higher the value of utb, the greater the degree of corporate tax avoidance. Based on H1, we expect the coefficient on utb to be negative and statistically significant at conventional levels.
4 Empirical results
Table 1 presents the descriptive statistics of the variables used in our empirical analy-sis. Due to the data requirements for constructing different tax avoidance measures for the regression analyses, the number of observations differs for lretr, ddmpbtd, utb, and stdetr.4 Mean lretr equals 0.1177, indicating that the average long-run cash effective
tax rate is 11.77%. The mean value of ddmpbtd is 0.0457, indicating that the residual domestic book-tax difference on average accounts for approximately 4.57% of firms’ total assets. The average value of lanacov is 2.3871, implying that each firm, on aver-age, is followed by approximately 10 analysts in our sample period. Table 2 reports the Spearman correlation coefficients between the independent variables used in our baseline regression. We check the potential multicollinearity issue with our regression estima-tions by running the variance inflation factor (VIF) test. Un-tabulated results show that the VIF value is less than 5 for all the explanatory variables except the post-FD-period indicator (fd). Further, our regression results hold when not including fd as a control var-iable. Therefore, multicollinearity is not an issue in our multivariate analyses (O’Brien 2007).
The tests of our main hypothesis H1 (i.e., that increased corporate tax avoidance is asso-ciated with reduced analyst coverage), using Eq. (2), are presented in Tables 3 and 4. The former table reports the results of our OLS (firm-fixed-effects) regressions, and the latter shows the results of our natural experiment. The OLS regression results in Columns (1–2) of Table 3 are as predicted. The coefficient for lretr is positive (0.4347) and statistically significant at the 1% level. The coefficient on ddmpbtd is also statistically significant at the
1% level, and has the predicted negative sign (− 0.0144).5 On this basis, analyst coverage is
negatively associated with corporate tax avoidance; H1 is thus supported. A one-standard-deviation increase in lretr leads to an increase in lanacov by 0.7052, which is equivalent to 29.54% of its sample mean and is economically significant. Un-tabulated analysis reveals that t-statistics of all regression coefficients would be substantially different if standard errors are not clustered by both firm and year; this indicates the necessity of doing the two-way clustering to correct for time-series and cross-sectional dependence in residuals (Petersen 2009; Thompson 2011).
Though the pooled OLS regression estimation yields the results consistent with H1, it cannot identify whether the impact of corporate tax avoidance on analyst coverage comes from explaining variation in analyst coverage across firms (i.e., cross-sectional variation) Table 1 Descriptive statistics
This table tabulates the descriptive statistics of the variables used in the hypothesis tests. The sample period ranges from 1995 to 2014. The number of observations used for the test of H1 is 29,372. Due to the data requirements in constructing different tax avoidance measures for the regression analyses, the number of observations differs for lretr, ddmpbtd, utb, and stdetr. All the variables are defined in the Appendix Variable No. of firm–years No. of
unique firms
Mean Std.dev. 25th Median 75th
lanacov 29,372 7285 2.3871 1.6223 0.6931 2.7081 3.6889 car 23,563 5993 0.0840 0.0605 0.0420 0.0671 0.1065 error 21,040 5328 0.1327 0.6258 0.0012 0.0042 0.0192 lretr 29,372 7285 0.1177 0.1424 0 0.0753 0.1885 ddmpbtd 26,995 7150 0.0457 1.4637 0.0003 0.0229 0.0675 utb 1024 456 2.9683 1.9780 1.3752 2.7652 4.3438 stdetr 23,362 6093 0.0791 0.0816 0.0196 0.0497 0.1148 size 29,372 7285 6.0540 2.0199 4.6563 6.0830 7.3865
tradingvol 29,372 7285 2.06E+07 1.13E+08 2.37E+05 1.87E+06 1.06E+07
beta 29,372 7285 0.8337 0.6043 0.3707 0.7792 1.2154 retvol 29,372 7285 0.0314 0.0208 0.0184 0.0262 0.0383 stdeps 29,372 7285 1.1186 102.0946 0.0100 0.0237 0.0659 price 29,372 7285 27.4007 383.7032 7.6800 17.7500 31.9850 qtrret 29,372 7285 0.0204 0.7242 − 0.2987 − 0.0512 0.2061 roa 29,372 7285 − 0.0206 0.1795 − 0.0012 0.0117 0.0336 hp 29,372 7285 − 1086.26 1206.70 − 1800.76 − 501.32 − 131.85 insti 29,372 7285 0.5067 0.8265 0.2255 0.5038 0.7549 rd 29,372 7285 0.0828 0.2756 0 0 0 intangible 29,372 7285 0.0395 0.1076 0 0 0.0099 btm 29,372 7285 0.8614 2.3669 0.3511 0.5794 0.9189 fd 29,372 7285 0.6781 0.4672 0 1 1 regulated 29,372 7285 0.2917 0.4546 0 0 1
5 We re-run our regression analysis using the 5-year 2010–2014 period following the global financial
crisis, and obtain qualitatively the same results. Specifically, the coefficient for lretr (ddmpbtd) is 0.2442 (− 0.0113) and statistically significant at 5% (1%) level.
Table 2 Spear man cor relations Var iables lre tr ddm pbtd size tradingv ol bet a ret vo l stdeps pr ice lre tr 1 ddm pbtd 0.2681*** 1 size 0.1966*** 0.3231*** 1 tradingv ol 0.1473*** 0.2606*** 0.8960*** 1 bet a 0.0102* 0.0302*** 0.4100*** 0.5734*** 1 ret vo l − 0.1542*** − 0.2739*** − 0.4131*** − 0.1670*** 0.2540*** 1 stdeps − 0.1773*** − 0.2174*** − 0.3053*** − 0.2213*** 0.0129** 0.3658*** 1 pr ice 0.2473*** 0.4093*** 0.7499*** 0.5856*** 0.1377*** − 0.6007*** − 0.4399*** 1 qtr re t 0.0062 0.2398*** 0.2494*** 0.1376*** 0.0316*** − 0.1477*** − 0.0039 0.3550*** ro a 0.2363*** 0.7512*** 0.3450*** 0.2737*** 0.0305*** − 0.3203*** − 0.2377*** 0.4373*** hp − 0.1667*** − 0.1433*** − 0.8063*** − 0.6795*** − 0.2475*** 0.4531*** 0.2594*** − 0.6191*** ins ti 0.2156*** 0.2199*** 0.5813*** 0.7047*** 0.4678*** − 0.1262*** − 0.1041*** 0.4078*** rd 0.2044*** − 0.0074 0.1083*** 0.0760*** − 0.0028 − 0.0518*** − 0.0075 0.1180*** int angible 0.1821*** − 0.0314*** 0.1822*** 0.1010*** 0.0033 − 0.1832*** − 0.1204*** 0.1977*** btm 0.0004 − 0.2217*** − 0.4109*** − 0.3822*** − 0.2354*** 0.0833*** 0.1873*** − 0.3810*** fd − 0.1670*** − 0.0424*** 0.0297*** 0.1476*** 0.3098*** 0.1274*** 0.0390*** − 0.0735*** regulat ed − 0.2071*** − 0.1107*** 0.0343*** − 0.0934*** − 0.1825*** − 0.3472*** − 0.2212*** 0.1679*** Var iables qtr re t ro a hp ins ti rd int angible btm fd regulat eed qtr re t 1 ro a 0.2688*** 1 hp − 0.1118*** − 0.1445*** 1 ins ti 0.0630*** 0.1989*** − 0.4404*** 1 rd 0.0154** 0.1088*** − 0.0595*** 0.0220*** 1 int angible 0.0351*** − 0.0041 − 0.2956*** 0.0295*** 0.3014*** 1 btm − 0.3057*** − 0.2566*** 0.0043 − 0.1513*** − 0.1067*** 0.0032 1 fd 0.0752*** − 0.0557*** − 0.0086 0.1767*** − 0.2051*** − 0.0676*** − 0.0215*** 1
Table 2 (continued) Var iables qtr re t ro a hp ins ti rd int angible btm fd regulat eed regulat ed 0.0509*** − 0.0716*** − 0.3121*** − 0.1887*** − 0.1702*** 0.1322*** 0.1902*** 0.0119* 1 These t ables pr esent t he r esults f or t he Spear man cor relation tes t. The cor relation matr ix in vol ves all t he independent v ar iables used f or t he main h ypo thesis tes ts. The sam ple consis ts of 26,995 fir m–y ear obser
vations and spans t
he y ears 1995–2014. All t he v ar iables ar e defined in t he Appendix ***, **, *r epr esent t he 1, 5, and 10% s tatis tical significance le vels (tw o-t ailed), r espectiv ely
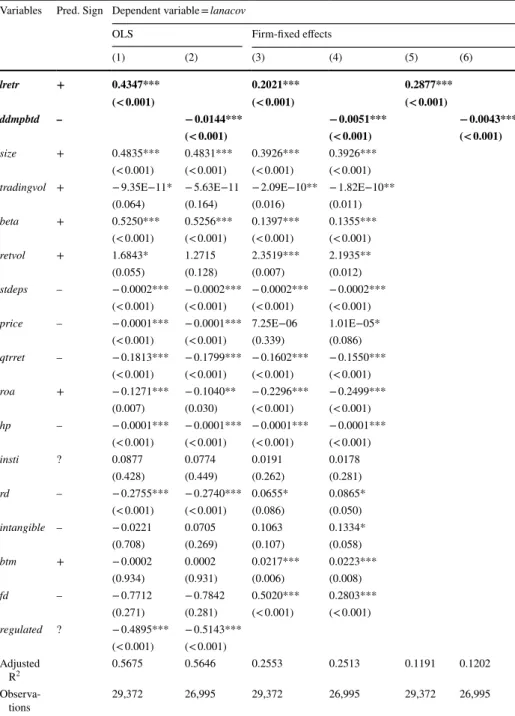
Table 3 Test of H1: OLS and firm-fixed-effects regressions of corporate tax avoidance on analyst coverage
This table reports the results for the tests of H1. Columns (1–2) ((3–6)) report the results from the OLS (firm-fixed-effects) regressions. The sample spans the period of 1995–2014. The dependent variable is ana-lyst coverage, namely, lanacov. The treatment variable is corporate tax avoidance which are proxied by the long-run cash effective tax rate (lretr) and residual domestic book-tax difference (ddmpbtd). All the vari-ables are defined in the Appendix. Because the firm-fixed-effects regression automatically drops any inde-pendent variable that exhibits no within-firm variance, regulated is omitted by the firm-fixed-effects test.
Variables Pred. Sign Dependent variable = lanacov
OLS Firm-fixed effects
(1) (2) (3) (4) (5) (6) lretr + 0.4347*** 0.2021*** 0.2877*** (< 0.001) (< 0.001) (< 0.001) ddmpbtd – − 0.0144*** − 0.0051*** − 0.0043*** (< 0.001) (< 0.001) (< 0.001) size + 0.4835*** 0.4831*** 0.3926*** 0.3926*** (< 0.001) (< 0.001) (< 0.001) (< 0.001)
tradingvol + − 9.35E−11* − 5.63E−11 − 2.09E−10** − 1.82E−10**
(0.064) (0.164) (0.016) (0.011) beta + 0.5250*** 0.5256*** 0.1397*** 0.1355*** (< 0.001) (< 0.001) (< 0.001) (< 0.001) retvol + 1.6843* 1.2715 2.3519*** 2.1935** (0.055) (0.128) (0.007) (0.012) stdeps – − 0.0002*** − 0.0002*** − 0.0002*** − 0.0002*** (< 0.001) (< 0.001) (< 0.001) (< 0.001)
price – − 0.0001*** − 0.0001*** 7.25E−06 1.01E−05*
(< 0.001) (< 0.001) (0.339) (0.086) qtrret – − 0.1813*** − 0.1799*** − 0.1602*** − 0.1550*** (< 0.001) (< 0.001) (< 0.001) (< 0.001) roa + − 0.1271*** − 0.1040** − 0.2296*** − 0.2499*** (0.007) (0.030) (< 0.001) (< 0.001) hp – − 0.0001*** − 0.0001*** − 0.0001*** − 0.0001*** (< 0.001) (< 0.001) (< 0.001) (< 0.001) insti ? 0.0877 0.0774 0.0191 0.0178 (0.428) (0.449) (0.262) (0.281) rd – − 0.2755*** − 0.2740*** 0.0655* 0.0865* (< 0.001) (< 0.001) (0.086) (0.050) intangible – − 0.0221 0.0705 0.1063 0.1334* (0.708) (0.269) (0.107) (0.058) btm + − 0.0002 0.0002 0.0217*** 0.0223*** (0.934) (0.931) (0.006) (0.008) fd – − 0.7712 − 0.7842 0.5020*** 0.2803*** (0.271) (0.281) (< 0.001) (< 0.001) regulated ? − 0.4895*** − 0.5143*** (< 0.001) (< 0.001) Adjusted R2 0.5675 0.5646 0.2553 0.2513 0.1191 0.1202 Observa-tions 29,372 26,995 29,372 26,995 29,372 26,995
or variation in analyst coverage within firms (i.e., time-series variation). Conceptual argu-ments about how analyst coverage is related to corporate tax avoidance predict (i) that firms with a higher degree of tax avoidance are likely to have lower analyst coverage than firms engaging in less tax avoidance activities, which is a cross-sectional prediction, and (ii) that a firm which experiences an increase in tax avoidance activities is likely to be fol-lowed by fewer analysts, which pertains to a time-series prediction. A firm-fixed-effects regression, when applied to model (2), removes most of the cross-sectional variation in tax avoidance and relies primarily on the within-firm (i.e., time-series) variation in tax avoidance to test the relationship between analyst coverage and tax avoidance. If the nega-tive association between analyst coverage and tax avoidance, as evidenced by the OLS regression results, is driven mainly by cross-sectional differences, then in using the firm-fixed-effects regression, we expect to find no evidence of a relationship between analyst coverage and tax avoidance. In contrast, if within-firm variance in tax avoidance explains within-firm variance in analyst following, we expect to find an association between ana-lyst following and tax avoidance when controlling for firm-fixed-effects in our regression model. Also, in determining whether series variation in tax avoidance explains time-series variation in analyst coverage, our firm-fixed-effects regression alleviates correlated-omitted-variables bias attributable to unobserved firm characteristics.
When including firm-fixed effects, the coefficient on lretr (ddmpbtd), reported in Column (3) ((4)) of Table 3, is again statistically significant at the 1% level with the predicted positive (negative) sign. Our firm-fixed-effects results, taken together with the OLS results, are thus not only consistent with H1 but also allow us to go further in suggesting that the negative impact of corporate tax avoidance on analyst coverage can be explained not only by time-series varia-tion in tax avoidance but also by cross-secvaria-tional variavaria-tion in tax avoidance. In Columns (5) and (6), we further report results from a simple firm-fixed-effects regression model that includes either lretr, or ddmpbtd, as the independent variable. Both lretr and ddmpbtd on their own separately appear statistically and economically significant in explaining analyst coverage.
Panel C of Table 4 reports the results of our FIN48-based quasi-natural experiment, which is implemented by running Eq. (3). The coefficient on the key interaction term, utbinteract, in Column (1) is negative and statistically significant at the 5% level. This indicates that the treatment firms with positive UTB have lower analyst coverage than the control firms which do not report any UTB, again in line with H1. FIN48 triggers an exogenous increase in treat-ment firms’ UTB disclosures. Our findings suggest that analysts are using the increased UTB disclosures of the treatment firms to infer tax avoidance activities, and as a result, reduce coverage of these firms. So the result can be taken as further evidence of the negative, causal impact of corporate tax avoidance on analyst following, again corroborative of H1. In addi-tion, as a robustness check, we use UTB as an alternative proxy for tax avoidance in model (2). Column (2) reports the regression results. The coefficient on utb is negative (− 0.0877) and is statistically significant at the 1% level, lending additional support for H1. Also, an increase of one standard deviation in utb leads to a decrease in lanacov by 0.1423, which accounts for 5.96% of its mean value and is thus economically significant in magnitude.
Year dummies are included in all the regressions but not reported for simplicity. The p values in brackets are based on robust standard errors that are clustered by firm and year (firm) in the OLS (firm-fixed-effects) regressions
The results highlighted in bold are those for the key independent variables of our regressions ***, **, *represent the 1, 5, and 10% statistical significance levels (two-tailed), respectively
Table 4 Test of H1: Evidence from a quasi-natural experiment (FIN48)
Variables Pre-matched L1 statistics Post-matched L1 statistics Panel A Diagnostic check of the quality of coarsened exact matching—comparison of L1 statistics
size 0.2879 0.0536 firmage 0.2127 0.0368 btm 0.0785 0.0177 lev 0.0204 0.0486 roa 0.1686 0.0327 ppe 0.2167 0.0795 intangible 0.5580 0.0418 equityic 0.0023 0.0009 foreignic 0.4443 0.1150 Overall 0.9868 0.6851 Year Mean for control
group Mean for treatment group Mean difference t-stat. p value Panel B Diagnostic test of the parallel trend assumption—comparison of the mean of lanacov between the
treatment and control groups in the pre-FIN48 period (2003–2005)
2003 2.6758 2.8505 − 0.1746 − 0.8320 0.4064 2004 2.6932 2.9082 − 0.2149 − 1.1329 0.2584 2005 2.9019 2.9954 − 0.0936 − 0.5427 0.5878 Variables Dependent variable = lanacov
(1) (2)
Panel C Regression results
Intercept − 0.5987** − 1.0108*** (0.030) (0.001) yutb 0.0506 (0.516) tutb 0.0553 (0.345) utbinteract − 0.1615** (0.040) utb − 0.0877*** (< 0.001) size 0.4370*** 0.5317*** (< 0.001) (< 0.001)
tradingvol 6.74E−10* − 3.60E−10
(0.092) (0.103) beta 0.1338*** 0.0596 (0.001) (0.170) retvol 8.4343*** 8.6788*** (0.001) (0.009) stdeps 0.0137*** − 0.0296** (< 0.001) (0.021)
All in all, based on our empirical analyses, we conclude that analysts are less likely to follow firms that engage more in corporate tax avoidance activities. One reason for the mixed prior evidence on the relation between corporate tax avoidance and earnings management is the endo-geneity problem which is not satisfactorily resolved in the literature to date. Corporate tax avoid-ance and earnings management are both driven by managerial incentives, and hence are particu-larly susceptible to endogeneity. When applying a two-stage-least-squares regression model to address any such endogeneity, it is difficult to identify a valid instrumental variable which influ-ences tax avoidance but does not have a direct impact on earnings management. Identification of exogenous shocks with which to conduct a natural experiment does not work in addressing
Panel A reports the L1 statistics of the covariates used in the regression that is run for coarsened exact matching. Panel B reports the results for the t test of the mean differences in lanacov by year between the treatment and control groups for the pre-FIN48 period (i.e., 2003-2005). In Panel C, Column (1) reports the regression results for the difference-in-differences quasi-natural experiment design. In the natural experi-ment, the treatment firms are defined as those that disclose positive UTB in any of the three years after FIN48, and the control firms are those that do not undertake any uncertain tax position in both pre- and post-FIN48 periods. The sample used for the natural experiment covers the years of 2003–2005 before FIN48 and of 2007–2009 after FIN48. Column (2) reports the OLS regression results for the test of H1 using UTB as an alternative measure of corporate tax avoidance. The sample period covers the years 2007– 2014. The industry dummies, constructed based on the Fama-French’s twelve industries, are included in the DiD regression; year dummies are included in both regressions; all these dummies are not reported for brevity. The variables are all defined in the appendix. The p values in brackets are based on robust standard errors clustered by firm and year
The results highlighted in bold are those for the key independent variables of our regressions ***, **, *represent the 1, 5, and 10% statistical significance levels (two-tailed), respectively
Table 4 (continued)
Variables Dependent variable = lanacov
(1) (2) price − 0.0032*** − 0.0026*** (0.007) (< 0.001) qtrret − 0.1828*** − 0.0521 (< 0.001) (0.147) roa − 0.2891 − 1.1219*** (0.128) (< 0.001) hp − 3.72E−05 − 0.0001*** (0.251) (0.003) insti 0.6118*** 0.5351*** (< 0.001) (< 0.001) rd − 0.0911* − 0.0609 (0.080) (0.225) intangible 0.2613** − 0.2208** (0.024) (0.024) btm 0.1542*** 0.2000*** (0.001) (< 0.001) regulated − 0.4863 − 0.5782*** (0.154) (< 0.001) Adjusted R2 0.5737 0.6365 Observations 1106 1024
this issue. This is because the time-series vis-à-vis cross-section relations between tax avoidance and earnings management, as we argue previously, run in the opposite direction and thus cannot be disentangled via a natural experiment. Analyst coverage provides a nice setting to help shed light on this issue, since analysts use the time-series record of earnings information to make their forecasts. From the negative impact of corporate tax avoidance on analyst coverage, we draw the inference that tax avoidance is likely associated with earnings management in the time-series.
5 Additional tests
In this section, we explore a number of other issues relating to the impact of corporate tax avoidance on analyst behavior. First, we test whether our main results might be related to tax risk issues, and then the extent to which corporate tax avoidance affects analyst earnings fore-cast informativeness and forefore-cast errors.
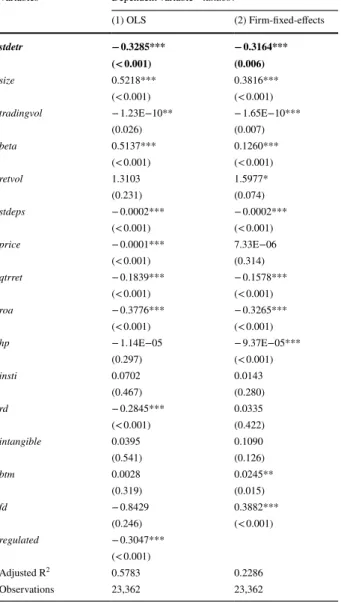
5.1 The effect of tax risk on analyst coverage
In this first sub-section, we investigate the impact of corporate tax risk on analyst coverage. Tax risk is conceptually different from tax avoidance, in that the former refers to the volatility of a firm’s tax positions across years while the latter refers to the level of a firm’s tax position in a particular year (e.g. Guenther et al. 2017; Wilde and Wilson 2018; Drake et al. 2019). As argued in Sect. 2.2, in attempting to deflect unwanted attention and scrutiny from outsiders, firms are unlikely to seek to avoid taxes either in consecutive years or concurrently with earn-ings management. More likely, volatile annual tax positions reflect a firm’s strategic tax plan-ning. It is thus important to also explore whether tax risk affects analyst coverage. Tax risk is conventionally defined as the volatility of a firm’s tax position over time (e.g. Drake et al. 2019). Accordingly, we measure tax risk by the volatility in income tax payments, calculated as the standard deviation of annual effective tax rates over the past five-year period (stdetr). Our tax risk (stdetr) measure should be able to capture any inter-temporal, non-consecutive tax avoidance strategy. We expect that firms adopting such a strategy would have higher tax risk, and as a result, are less likely to attract analyst following. To test this conjecture, we for-mulate the following regression model using both OLS and firm-fixed-effects specifications:
We include the same set of control variables as in model (2). Table 5 presents the regression results. As can be seen, the coefficients on stdetr are negative and statistically significant in both the OLS and firm-fixed-effects regressions. This is in line with our prediction that analysts are less likely to follow firms that exhibit high tax risk. In Column (1) (Column (2)), a one-standard-devia-tion increase in stdetr is associated with a decrease in lanacov of 0.5329 (0.5133), which accounts for 22.32% (21.50%) of the sample mean of lanacov and is thus economically significant. 5.2 The effect of corporate tax avoidance on the informativeness of analyst
forecasts
This sub-section explores whether corporate tax avoidance affects the informativeness of analyst earnings forecasts. We follow Frankel et al. (2006) to define analyst earnings (4)
lanacovi,t= 𝛼0+ 𝛼1stdetri,t+ ∑
k
Table 5 Additional test: The impact of tax risk on analyst coverage
This table reports the results for the tests of the impact of tax risk on ana-lyst coverage. Column (1) ((2)) reports the results from the OLS (firm-fixed-effects) regressions. The sample spans the period of 1995–2014. The dependent variable is analyst coverage, namely, lanacov. The treat-ment variable is tax risk, namely, stdetr. All the variables are defined in the Appendix. The firm-fixed-effects regression automatically drops independent variables that exhibit no within-firm variance, and thus
reg-ulated is omitted for the firm-fixed-effects regression results. Year
dum-mies are included in both regressions but not reported for brevity. The p
values in brackets are based on robust standard errors that are clustered by firm and year (firm) in the OLS (firmfixed-effects) regressions The results highlighted in bold are those for the key independent vari-ables of our regressions
***, **, *represent the 1, 5, and 10% statistical significance levels (two-tailed), respectively
Variables Dependent variable = lanacov
(1) OLS (2) Firm-fixed-effects stdetr − 0.3285*** − 0.3164***
(< 0.001) (0.006)
size 0.5218*** 0.3816***
(< 0.001) (< 0.001)
tradingvol − 1.23E−10** − 1.65E−10***
(0.026) (0.007) beta 0.5137*** 0.1260*** (< 0.001) (< 0.001) retvol 1.3103 1.5977* (0.231) (0.074) stdeps − 0.0002*** − 0.0002*** (< 0.001) (< 0.001) price − 0.0001*** 7.33E−06 (< 0.001) (0.314) qtrret − 0.1839*** − 0.1578*** (< 0.001) (< 0.001) roa − 0.3776*** − 0.3265*** (< 0.001) (< 0.001) hp − 1.14E−05 − 9.37E−05*** (0.297) (< 0.001) insti 0.0702 0.0143 (0.467) (0.280) rd − 0.2845*** 0.0335 (< 0.001) (0.422) intangible 0.0395 0.1090 (0.541) (0.126) btm 0.0028 0.0245** (0.319) (0.015) fd − 0.8429 0.3882*** (0.246) (< 0.001) regulated − 0.3047*** (< 0.001) Adjusted R2 0.5783 0.2286 Observations 23,362 23,362
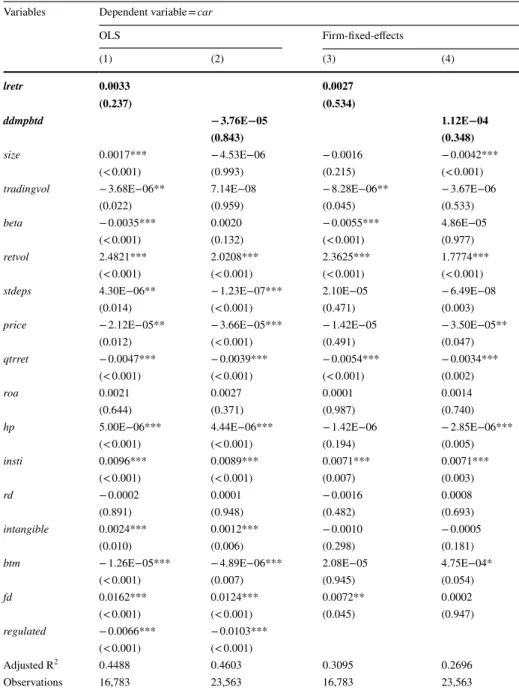
forecast informativeness as the extent to which stock prices react to analyst earnings forecasts. Corporate tax avoidance will impact the informativeness of analyst forecasts under two conditions: first, investors are able to observe corporate tax avoidance on a timely basis and to comprehend its adverse influence on corporate financial transpar-ency; second, analysts are perceived by investors to be more capable of deciphering the implications of corporate tax avoidance for future earnings, thus rendering analyst fore-casts more informative to investors. If both assumptions hold, we would expect investors to react more strongly to analyst earnings forecasts in the case of perceived corporate tax aggressiveness. On the other hand, if either assumption does not hold, corporate tax avoidance should not impact analyst forecast informativeness. To test this proposition, we run both OLS and firm-fixed-effects regressions for the following model:
where car equals the cumulative unsigned abnormal stock returns over the three-day win-dow [− 1, 1] centered on the announcement date of an analyst’s last forecast of annual EPS for the fiscal year. If multiple analysts make EPS forecasts for the same firm, car is taken as the average of the abnormal returns associated with these forecasts. The market reac-tion to analyst earnings forecasts reflects investor demand for such forecasts. Hence, in line with prior research (e.g. Frankel et al. 2006; Arand et al. 2015), we control for a range of determinants of the demand for analyst forecasts: firm size (size), trading volume ( trad-ingvol), firm beta (beta), return volatility (retvol), earnings volatility (stdeps), stock price (price), abnormal stock returns (qtrret), pre-tax return on assets (roa), financial constraints (hp), institutional ownership (insti), research and development expenditures (rd), intangi-ble assets (intangible), book-to-market ratio (btm), post-FD-period indicator (fd), industrial regulatory status (regulated). All these control variables are defined in the Appendix.
Columns (1–2) ((3–4)) of Table 6 present the OLS (firm-fixed-effects) regression results from running Eq. (5). None of the coefficients for lretr and ddmpbtd is statisti-cally significant, which is inconsistent with corporate tax avoidance being associated with analyst forecast informativeness.
In general, investors do not have access to private information, making it difficult for them to promptly observe tax avoidance activities that occur sporadically. Even if inves-tors do manage to recognize tax avoidance, they may not understand its adverse impact on financial transparency, and thus not resort to increased analyst services. Furthermore, analysts might not always be able to infer the implications of tax avoidance for future earnings. All such factors could potentially help explain why corporate tax avoidance does not appear to be associated with an increase in the stock market reactions to analyst forecasts. Importantly, in contrast to our earlier evidence which is consistent with the supply-curve argument of our main hypothesis, the insignificant results for model (5) confute the alternative analyst- demand-curve argument which posits that corporate tax avoidance raises investor demand for analyst forecasts and increases analyst coverage. 5.3 The effect of corporate tax avoidance on analyst forecast errors
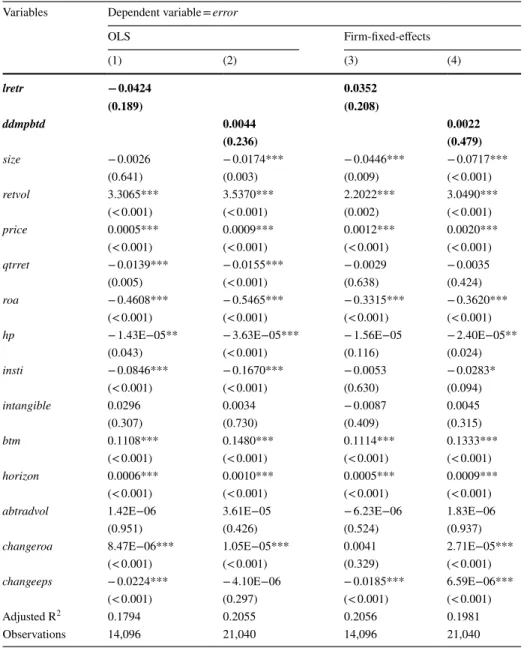
Corporate tax avoidance obfuscates financial information and makes accurate forecasting more difficult for analysts. As such, it is plausible that corporate tax avoidance activities increase analyst forecast errors. In this sub-section, we examine whether conditional on analysts following a firm, corporate tax avoidance impacts analyst forecast errors. Since (5) cari,t= 𝛼0+ 𝛼1lretri,t(ddmpbtdi,t) +
∑
k
Table 6 Additional test: The impact of corporate tax avoidance on the informativeness of analyst earnings forecasts
This table presents the results for the tests of the impact of corporate tax avoidance on the informativeness of analyst earnings forecasts. Columns (1–2) ((3–4)) reports the results from the OLS (firm-fixed-effects) regressions. The sample spans the period of 1995–2014. The dependent variable is the cumulative unsigned abnormal stock returns, namely, car. The treatment variable is corporate tax avoidance which are proxied by the long-run cash effective tax rate (lretr) and residual domestic book-tax difference (ddmpbtd). The firm-fixed-effects regression automatically drops any independent variable that exhibits no within-firm vari-ance, and thus regulated is omitted for the firm-fixed-effects regression results. All the variables are defined in the Appendix. Year dummies are included in all the regressions but not reported for simplicity. The p
Variables Dependent variable = car
OLS Firm-fixed-effects (1) (2) (3) (4) lretr 0.0033 0.0027 (0.237) (0.534) ddmpbtd − 3.76E−05 1.12E−04 (0.843) (0.348) size 0.0017*** − 4.53E−06 − 0.0016 − 0.0042*** (< 0.001) (0.993) (0.215) (< 0.001)
tradingvol − 3.68E−06** 7.14E−08 − 8.28E−06** − 3.67E−06
(0.022) (0.959) (0.045) (0.533)
beta − 0.0035*** 0.0020 − 0.0055*** 4.86E−05 (< 0.001) (0.132) (< 0.001) (0.977)
retvol 2.4821*** 2.0208*** 2.3625*** 1.7774***
(< 0.001) (< 0.001) (< 0.001) (< 0.001)
stdeps 4.30E−06** − 1.23E−07*** 2.10E−05 − 6.49E−08
(0.014) (< 0.001) (0.471) (0.003)
price − 2.12E−05** − 3.66E−05*** − 1.42E−05 − 3.50E−05**
(0.012) (< 0.001) (0.491) (0.047)
qtrret − 0.0047*** − 0.0039*** − 0.0054*** − 0.0034***
(< 0.001) (< 0.001) (< 0.001) (0.002)
roa 0.0021 0.0027 0.0001 0.0014
(0.644) (0.371) (0.987) (0.740)
hp 5.00E−06*** 4.44E−06*** − 1.42E−06 − 2.85E−06*** (< 0.001) (< 0.001) (0.194) (0.005) insti 0.0096*** 0.0089*** 0.0071*** 0.0071*** (< 0.001) (< 0.001) (0.007) (0.003) rd − 0.0002 0.0001 − 0.0016 0.0008 (0.891) (0.948) (0.482) (0.693) intangible 0.0024*** 0.0012*** − 0.0010 − 0.0005 (0.010) (0.006) (0.298) (0.181)
btm − 1.26E−05*** − 4.89E−06*** 2.08E−05 4.75E−04* (< 0.001) (0.007) (0.945) (0.054) fd 0.0162*** 0.0124*** 0.0072** 0.0002 (< 0.001) (< 0.001) (0.045) (0.947) regulated − 0.0066*** − 0.0103*** (< 0.001) (< 0.001) Adjusted R2 0.4488 0.4603 0.3095 0.2696 Observations 16,783 23,563 16,783 23,563