Electronic structure of Li
2RuO
3studied by LDA and LDA
+
DMFT calculations
and soft x-ray spectroscopy
Z. V. Pchelkina,1,2,*A. L. Pitman,3A. Moewes,3E. Z. Kurmaev,1Teck-Yee Tan,4D. C. Peets,4 Je-Geun Park,4,5and S. V. Streltsov1,2,†
1M. N. Miheev Institute of Metal Physics, Ural Branch of Russian Academy of Sciences, 620137, Ekaterinburg, Russia 2Department of Theoretical Physics and Applied Mathematics, Ural Federal University, Mira St. 19, 620002 Ekaterinburg, Russia
3Department of Physics and Engineering Physics, University of Saskatchewan, 116 Science Place, Saskatoon,
Saskatchewan, Canada S7N 5E2
4Center for Correlated Electron Systems, Institute for Basic Science, Seoul 151-747, Korea 5Department of Physics and Astronomy, Seoul National University, Seoul 151-747, Korea (Received 11 December 2014; revised manuscript received 20 January 2015; published 25 March 2015) The electronic structure of Li2RuO3was investigated using x-ray emission and absorption spectroscopy and by theoretical calculations employing two approaches: the local density approximation (LDA) and a combination of LDA with the cluster extension of dynamical mean-field theory (LDA+DMFT). The evolution of the spectral properties with the strength of electronic correlations is analyzed. We show that for moderate values of on-site Coulomb repulsionU and intra-atomic Hund’s rule exchangeJH, Li2RuO3 is in an orbital-selective strongly correlated state in the sense that a part of thet2gmanifold (i.e.,xz/yz) behaves as local atomic orbitals susceptible to Hubbard correlations, while the remaining (xy) orbitals must be described as bond-centered molecular orbitals. Both theoretical approaches succeed in explaining the x-ray data, and a comparison of the theoretical and experimental spectra provides a reasonable estimate of the possible correlation strength (U) and Hund’s coupling (JH) in Li2RuO3.
DOI:10.1103/PhysRevB.91.115138 PACS number(s): 75.20.Ck,71.27.+a I. INTRODUCTION
Recent progress in the study of the electronic and magnetic properties of hexagonal iridates Na2IrO3and Li2IrO3[1–4] has stimulated investigation of other materials with similar crystal structures based on 4d and 5d transition metals. On the one hand, due to strong spin-orbit coupling and specific lattice geometry, these materials were proposed to show strongly anisotropic exchange interactions, which may result in exotic magnetic properties [1]. On the other hand, they can be regarded as molecular orbital crystals, i.e., compounds in which chemical bonding and formation of quasimolecular orbitals affect the physical properties of the system [3,4]. In addition to these two factors, the spin-orbit coupling, kinetic energy (hopping), and on-site Coulomb correlations are expected to play some role, as in many other transition metal oxides [5]. One of the ways to study the relative importance of these terms is to investigate related materials with a similar crystal structure. For instance, the study of doped Li2Ir1−xRuxO3, where Ir was gradually substituted by Ru, demonstrated that models based on the assumption of dominant spin-orbit interactions do not describe this system properly [6]. However, the physical properties of the end compound, Li2RuO3, are interesting not only because of its close resemblance to the hexagonal iridates but also because of its formation of a spin-singlet ground state at low temperatures [7] which melts into a valence-bond liquid state at higher temperatures [8].
The crystal structure of Li2RuO3 consists of honeycomb layers of RuO6 and LiO6 edge-sharing octahedra, which
*pzv@ifmlrs.uran.ru †streltsov@imp.uran.ru
alternate with Li layers along thecdirection. The RuO6 octa-hedra form a honeycomb network, while the LiO6octahedron occupies the center of each resulting Ru hexagon (see Fig.1). The material undergoes a phase transition from the C2/m structure at high temperatures to the low-temperatureP21/m structure atTc∼540 K [7,9]. X-ray diffraction measurements on polycrystalline samples reveal that at this temperature the nearly perfect hexagons of the high-temperature phase undergo strong distortions, giving rise to the formation of short, medium, and long Ru-Ru bonds with lengthsLs=2.568 ˚A, Lm=3.045 ˚A, andLl=3.049 ˚A, respectively. This structure is thus characterized by Ru dimers; these short Ru-Ru bonds, which form a herringbone structure, are shown as red lines in Fig.1. The ratio (Ll-Ls)/Ls can serve as a measure of the basal-plane distortion. In the low-temperature phase of Li2RuO3this ratio is 18.6%, indicative of strong dimerization and the formation of quasimolecular orbitals with a singlet ground state [7]. However, pair distribution function analysis of data obtained with the same method (x-ray diffraction) has shown that the dimerization persists well aboveTc, and the material’s structure takes the form of a valence bond liquid [8]. Density functional theory (DFT) calculations have demon-strated that the energy difference between structures with different dimerization patterns is small, and hence, the energy barrier for the dimers’ flow can be readily overcome at temperatures T Tc. However, the results of the crystal structure optimization were found to be strongly dependent on the strength of the on-site Coulomb repulsion, which tends to stabilize a nearly uniform hexagonal structure [10]. Therefore, it is quite important to estimate the strength of the Coulomb correlations in this material.
In the present paper we report detailed studies of the influence of correlation effects on the electronic properties of Li2RuO3using cluster LDA+DMFT calculations (combining
FIG. 1. (Color online) The honeycomb crystal structure of the low-temperature phase of Li2RuO3. The RuO6octahedra are colored in green, and LiO6is in light gray. The Ru-Ru dimers are shown as bold red lines, while the remaining Ru-Ru bonds are shown in black. The directions of thex,y, andzaxes of the local coordinate system are shown by blue arrows.
the local density approximation and dynamical mean-field theory). The obtained spectral functions are compared with experimental x-ray absorption and emission spectra. Very recently, it was reported that the crystal structure and physical properties of Li2RuO3single crystals may differ significantly from those of polycrystalline samples [10]; here we report results for high-quality polycrystalline Li2RuO3.
II. EXPERIMENTAL AND CALCULATION DETAILS To prepare the polycrystalline samples, appropriate quanti-ties of Li2CO3 and RuO2 (both Alfa Aesar, at least 99.99% purity) were mixed using an agate mortar and pestle and dried in a furnace at 600◦C in air overnight. The powder was then pressed into 10-mm-diameter pellets and heated at 900◦C for 15 h, followed by sintering in an alumina crucible at 1000◦C for 4 days, with intermediate grinding. A 10 mol% excess of Li2CO3was used to compensate for evaporation of Li. All heating was done in a muffle furnace. The sample purity was monitored using a Rigaku MiniFlex benchtop x-Ray diffractometer employing Cu-Kα radiation. Our bulk resistivity and differential scanning calorimetry measurements show clear signs of the phase transition at around 550 K, indicative of the high quality of our samples.
Oxygen x-ray emission (XES) and absorption (XAS) spectra represent occupied and unoccupied partial density of electronic states, respectively [11,12]. In 3d transition metal oxides, these spectra can represent not only O 2p but also transition metal 3dstates due to strong 2p−3dhybridization. Thed orbitals in 4dtransition metals are more extended than in their 3d counterparts, and hence, their hybridization with oxygen 2pstates is very strong. One would thus expect the O KαXES and O 1s(K-edge) XAS spectra to reflect the Ru 4d density of states in Li2RuO3.
Oxygen K-edge soft x-ray spectroscopy measurements were performed at the XES end station of the Resonant Elastic and Inelastic X-ray Scattering (REIXS) beamline (10-ID2) at the Canadian Light Source at the University of Saskatchewan. The monochromator resolving powerE/Eat the OK-edge energy was at least 5000. The emission spectrometer, which
uses diffraction gratings in a Rowland circle geometry as dispersive elements and is fitted with a microchannel plate detector, had a resolving powerE/Eof at least 500 in the same energy region. The elliptically polarizing undulator was tuned to produce horizontally polarized photons. All reported measurements were performed with an incidence angle of 70◦ from normal, and the XES spectrometer collected photons at 90◦ from the incident beam. Each sample was affixed to the sample plate using carbon tape prior to being placed into the chamber and brought down to ultrahigh vacuum. XAS scans were performed in total electron yield (TEY) mode and were subsequently normalized by the intensity of the incoming photons I0. The oxygen K-edge absorption spectra were calibrated to Bi4Ge3O12(BGO) with a first peak at 532.7 eV. XES measurements were collected at an excitation energy of 560 eV and dually calibrated through the BGO reference material as well as through the use of elastic scattering peaks so as to ensure consistency with the energy values reported by the monochromator. Both XES and XAS spectra were measured at room temperature.
The electronic structure of the low-temperature phase of Li2RuO3 was calculated using the local density approxima-tion (LDA) and the tight-binding linear muffin-tin orbital (TB-LMTO) method [13,14]. The von Barth–Hedin local exchange-correlation potential [15] was used. The lattice constants and atomic positions corresponding to theP21/m structure were taken from Ref. [7]. The muffin-tin sphere radii were chosen to beR(Ru)=2.41 a.u.,R(O)=1.82–2.05 a.u., andR(Li)=1.97–2.48 a.u.; 1728kpoints in the full Brillouin zone were used in the calculation. The Wannier function projection method [16,17] was employed to construct the low-energy Hamiltonian for thet2g states of Ru. We have not included spin-orbit coupling in the calculation scheme. The local distortions of the RuO6 octahedra and formation of the molecular orbitals in the Ru-Ru dimers strongly suppress this interaction.
In order to take into account correlation effects in the 4d shell of Ru we applied the LDA+DMFT method [18,19]; since two Ru ions are bound, forming a dimer, the cluster extension of the LDA+DMFT approach was utilized [20,21]. The effective impurity model in DMFT was solved with the use of the Hirsh-Fye algorithm (HF-QMC) [22]. All calculations were performed for the inverse temperature β=10 eV−1. Spectral functions were calculated using the maximum entropy method [23].
III. RESULTS AND DISCUSSION
Many transition metal oxides are known to be strongly correlated materials [5]. While electronic correlations are ex-pected to be gradually suppressed going from 3dto 4dand 5d metals (since orbitals have a greater radial extent and become less localized for higher principal quantum numbers [24]), they generally may remain important. The investigations of different dimerized and trimerized Ru oxides show that some of them (e.g., Ba4Ru3O10 [25] or Ba3CoRu2O9 [26]) can be described within conventional band theory, while others (e.g., La4Ru2O10[27]) have to be considered systems with localized electrons. Therefore, in the present paper we used the cluster extension of the LDA+DMFT approach, which allows us not
-8 -6 -4 -2 0 2 4 0 2 4 6 DOS (states/eV/f.u.) ⎩ ⎨ ⎧ xz/yz (a) (b) (c) LDA O 2p LDA Ru 4d 522 524 526 528 530 532
Intensity (arbitrary units)
-8 -6 -4 -2 0 2 4
Energy (eV)
02 4
Intensity (arbitrary units)
XES XAS
xy* xy
LDA+DMFT
FIG. 2. (Color online) Identification of spectral features: (a) O 2pLDA density of states (DOS), (b) O Kαx-ray emission (XES) and O 1sx-ray absorption (XAS) spectra of polycrystalline Li2RuO3, and (c) LDA+DMFT spectral function forU=3 eV andJH =0.7 eV.
only to incorporate correlation effects but also to take into account the formation of bonding and antibonding states in dimerized Li2RuO3 in an appropriate way. We start with the analysis of the LDA electronic structure and then show how it changes when one takes into account the correlation effects.
Partial Ru 4dand O 2pLDA densities of states (DOSs) are shown in Fig.2(a). Thet2gstates of ruthenium are located in the energy interval from−1.4 to 1.3 eV. The lowest (at about −1.2 eV) and highest (at about 1.1 eV) peaks in this energy interval primarily correspond to the bonding and antibonding xyorbitals, respectively. We use the local coordination system, where the x and y axes point to the oxygen atoms forming the common edge for two neighboring RuO6octahedra. Four peaks in the energy interval from−0.7 to 0.5 eV correspond to the bonding and antibonding xz/yz orbitals. From the LDA partial DOS one can clearly see the strong hybridization between O 2pand Ru 4dstates. As was argued in Sec.II, this hybridization allows for the comparison of the experimental O K-edge XES and XAS spectra with spectral functions of Ru 4dstates.
The experimental oxygen K-edge emission (O KαXES) and absorption (O K-edge XAS) spectra of Li2RuO3 are presented in Fig.3. In accordance with dipole selection rules these spectra give information about the energy distribution of occupied and vacant O 2pstates, respectively. We have used the maximum entropy treatment [28] for deconvolution of the spectra for experimental broadening.
A comparison of experimental spectra with calculated DOS according to positions of the main maxima is presented in
FIG. 3. (Color online) Experimental O Kαx-ray emission (XES) and O 1sx-ray absorption (XAS) spectra of polycrystalline Li2RuO3 (black circles). Deconvoluted spectra using the maximum entropy method are shown as a solid red line.
Fig.2. One may see from Figs. 2(a)and2(b)that the LDA results agree with x-ray spectra remarkably well. The peak at ∼529.5 eV is attributed to the antibondingxy∗orbital. Thexy orbitals on the two Ru ions forming a dimer are directed, in this edge-sharing geometry, exactly toward each other, which results in the strong bonding-antibonding splitting [8]. In contrast, the overlap betweenxz/yzorbitals is not that large, and hence, the bonding-antibonding splitting for these orbitals is small, and they behave mostly as site-centered atomic orbitals. The shoulder at∼528 eV corresponds exactly to these xz/yzstates. Peaks at 531.5 and 532.5 eV can be attributed to the Rueg∗orbitals, while the broad peak at∼526 eV indicates the top of the O 2pband.
The on-site Coulomb repulsionUand Hund’s rule exchange JH for Ru4+ have been estimated to be 3.0 and 0.7 eV, respectively [25,29]. The spectral functions obtained in the LDA+DMFT calculations for these values ofU andJH are shown in Fig.2(c). One may see that they agrees with the experimental spectra nearly as well as the LDA density of states. Typically, spectral functions for correlated bands near half filling having moderate values ofU show the so-called “three-peak structure” consisting of upper and lower Hubbard bands, with a quasiparticle peak near the Fermi edge [18]. The obtained spectral functions also exhibit this three-peak structure, but the origin of these peaks is rather different.
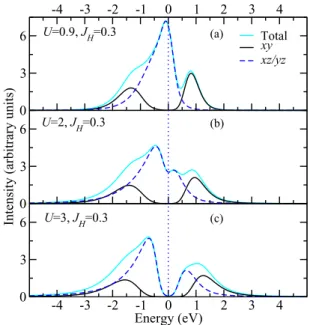
Evolution of the LDA+DMFT spectral functions as a function ofU at fixedJH =0.3 eV [30] is shown in Fig.4. One may see that while an increase in the correlation strength leads to the gradual opening of a gap in thexz/yzbands (as expected for localized states), the positions of both bonding and antibondingxybands, which still form molecular orbitals, do not have a strongU dependence. In this sense, Li2RuO3 shows orbital-selective strongly correlated behavior [21].
The tendency to form molecular orbitals competes in dimerized systems both with the on-site Coulomb repulsion Uand with intra-atomic exchangeJH, which tend to localize electrons on the atomic orbitals. If the corresponding hopping parameters are small enough, then correlations can easily suppress them and localize electrons on the atomic orbitals, which occurs here for thexz/yzorbitals, which do not have
-4 -3 -2 -1 0 1 2 3 4 0 3 6 Total xy xz/yz 0 3 6
Intensity (arbitrary units)
-4 -3 -2 -1 0 1 2 3 4 Energy (eV) 0 3 6 U=0.9, JH=0.3 U=2, JH=0.3 U=3, JH=0.3 (a) (b) (c)
FIG. 4. (Color online) The LDA+DMFT spectral functions of polycrystalline Li2RuO3fort2gstates forJH=0.3 eV and different values ofU: (a)U=0.9 eV, (b)U=2 eV, and (c)U=3 eV.
direct overlap (only indirectviaoxygen). In contrast, the large bonding-antibonding splitting for thexy orbitals (∼1 eV [9]) efficiently competes with the HubbardU.
The dependence of the spectral function calculated within LDA+DMFT on JH at fixed U is shown in Fig. 5. On the one hand, increasing JH for the current orbital filling results in a decreased splitting between the upper and lower Hubbard bands for thexz/yz states (see, e.g., [31]). On the other hand, Hund’s exchange efficiently couples electrons on different orbitals (xy andxz/yz) and disfavors the formation of the molecular orbitals [21]. This results in the shift of the antibondingxy∗ band to lower energies, but even forU and
-4 -3 -2 -1 0 1 2 3 4 0 2 4 Total xy xz/yz 0 2 4
Intensity (arbitrary units)
-4 -3 -2 -1 0 1 2 3 4 Energy, eV 0 2 4 U=3, JH=0.3 U=3, JH=0.5 U=3, JH=0.7 (a) (b) (c)
FIG. 5. (Color online) The LDA+DMFT spectral functions for polycrystalline Li2RuO3forU=3 eV and different values ofJH: (a) JH =0.3 eV, (b)JH =0.5 eV, and (c)JH =0.7 eV.
JH as large as 3 and 0.7 eV, respectively, correlations do not suppress formation of the molecular orbitals completely.
By comparing LDA+DMFT results obtained for different U andJH with experimental spectra, one may see that the peak assignment remains practically the same as that in the case of the LDA calculation: the peak at∼529.5 eV can be attributed to the antibondingxy∗ band, and the shoulder at ∼528.5 eV corresponds to the xz/yz states. The peaks at ∼531.5, 532.5, and 534 eV as well as at 525 eV are not seen in the LDA+DMFT spectral functions since neither Rue∗gnor O 2pstates were included in the calculation scheme (otherwise, the dimension of the impurity problem becomes too large to be solved). The best agreement between LDA+DMFT spectral functions and experimental spectra is obtained forU=3 eV andJH =0.7 eV.
Oxygen x-ray spectra in transition-metal oxides in general reproduce the partial density ofd states but only indirectly throughp-dhybridization. Some features in the distribution of Ru 4dstates near the Fermi level as observed in LDA+DMFT spectral functions will not be reproduced by oxygen XES and XAS. The overall broadening of experimental x-ray spectra includes contributions from the width of the core level (which is determined by the lifetime of the 1svacancy) and instrumental resolution. Optical measurements, free from the first type of broadening, may thus offer a rich source of further information about the electronic structure of Li2RuO3.
IV. CONCLUSION
The conventional LDA and cluster extension of the LDA+DMFT method and O K-edge XES and XAS spec-troscopy were used to investigate the electronic structure of dimerized Li2RuO3. While LDA density of states is found to be in rather good agreement with experimental spectra, only the cluster DMFT technique allows for accurate simulation of spin-singlet states. Already on the LDA level there are two types of Ru 4d orbitals:xy orbitals, which form molecular orbitals, andxz/yz, which are atomiclike and site centered. The correlation effects do not break this orbital-selective state. We have demonstrated the robustness of the formation of the molecular orbitals in our calculations by varying theUandJH parameters over a wide range. The unoccupied part (rightmost) of the three-peak structure of the LDA+DMFT spectral func-tions is attributed to the antibondingxy∗molecular orbital, and the central peak is attributed to thexz/yzstates. By making a direct comparison of the experimental spectra to LDA+DMFT spectral functions, we have made a quantitative estimate of two important parameters: the Coulomb interactionUand the Hund’s couplingJH for Li2RuO3. However, we also note that higher-resolution x-ray experiments or optical measurements would be helpful for a more accurate determination of these two parameters.
ACKNOWLEDGMENTS
We thank D. I. Khomskii and G. Cao for various commu-nications and discussions concerning Li2RuO3. We also thank A. O. Shorikov for useful discussions. The experimental part of the research described in this paper was performed at the Canadian Light Source, which is supported by the Canadian Foundation for Innovation, Natural Sciences and Engineering
Research Council of Canada, the University of Saskatchewan, the government of Saskatchewan, Western Economic Diversi-fication Canada, the National Research Council Canada, and the Canadian Institutes of Health Research. Work at IBS CCES
and SNU was supported by the Institute for Basic Science (IBS) in Korea (IBS-R009-G1). The theoretical part of the present work was supported by a grant from the Russian Science Foundation (Project No. 14-22-00004).
[1] G. Jackeli and G. Khaliullin, Phys. Rev. Lett. 102, 017205 (2009).
[2] J. Chaloupka, G. Jackeli, and G. Khaliullin,Phys. Rev. Lett. 105,027204(2010).
[3] I. I. Mazin, H. O. Jeschke, K. Foyevtsova, R. Valent´ı, and D. I. Khomskii,Phys. Rev. Lett.109,197201(2012).
[4] K. Foyevtsova, H. O. Jeschke, I. I. Mazin, D. I. Khomskii, and R. Valent´ı,Phys. Rev. B88,035107(2013).
[5] M. Imada, A. Fujimori, and Y. Tokura,Rev. Mod. Phys.70,1039 (1998).
[6] H. Lei, W.-G. Yin, Z. Zhong, and H. Hosono,Phys. Rev. B89, 020409(R)(2014).
[7] Y. Miura, Y. Yasui, M. Sato, N. Igawa, and K. Kakurai,J. Phys. Soc. Jpn.76,033705(2007).
[8] S. A. J. Kimber, I. I. Mazin, J. Shen, H. O. Jeschke, S. V. Streltsov, D. N. Argyriou, R. Valenti, and D. I. Khomskii, Phys. Rev. B89,081408(2014).
[9] Y. Miura, M. Sato, Y. Yamakawa, T. Habaguchi, and Y. Ono, J. Phys. Soc. Jpn.78,094706(2009).
[10] J. C. Wang, J. Terzic, T. F. Qi, F. Ye, S. J. Yuan, S. Aswartham, S. V. Streltsov, D. I. Khomskii, R. K. Kaul, and G. Cao, Phys. Rev. B90,161110(2014).
[11] E. Z. Kurmaev, R. G. Wilks, A. Moewes, L. D. Finkelstein, S. N. Shamin, and J. Kuneˇs,Phys. Rev. B77,165127(2008). [12] S. V. Streltsov, J. McLeod, A. Moewes, G. J. Redhammer, and
E. Z. Kurmaev,Phys. Rev. B81,045118(2010). [13] O. Andersen,Phys. Rev. B12,3060(1975).
[14] O. K. Andersen and O. Jepsen,Phys. Rev. Lett.53,2571(1984). [15] U. von Barth and L. Hedin,J. Phys. C5,1629(1972). [16] V. I. Anisimov, D. E. Kondakov, A. V. Kozhevnikov, I. A.
Nekrasov, Z. V. Pchelkina, J. W. Allen, S.-K. Mo, H.-D. Kim, P. Metcalf, S. Sugaet al.,Phys. Rev. B71,125119(2005).
[17] S. V. Streltsov, A. S. Mylnikova, A. O. Shorikov, Z. V. Pchelkina, D. I. Khomskii, and V. I. Anisimov,Phys. Rev. B71,245114 (2005).
[18] A. Georges, W. Krauth, and M. J. Rozenberg,Rev. Mod. Phys. 68,13(1996).
[19] G. Kotliar, S. Savrasov, K. Haule, V. Oudovenko, O. Parcollet, and C. Marianetti,Rev. Mod. Phys.78,865(2006).
[20] G. Biroli and G. Kotliar,Phys. Rev. B65,155112(2002). [21] S. V. Streltsov and D. I. Khomskii,Phys. Rev. B89,161112
(2014).
[22] J. E. Hirsch and R. M. Fye, Phys. Rev. Lett. 56, 2521 (1986).
[23] R. N. Silver, D. S. Sivia, and J. E. Gubernatis,Phys. Rev. B41, 2380(1990).
[24] J. B. Goodenough, Magnetism and the Chemical Bond
(Interscience, New York, 1963).
[25] S. V. Streltsov and D. I. Khomskii,Phys. Rev. B86,064429 (2012).
[26] S. V. Streltsov,Phys. Rev. B88,024429(2013).
[27] H. Wu, Z. Hu, T. Burnus, J. Denlinger, P. Khalifah, D. Mandrus, L.-Y. Jang, H. Hsieh, A. Tanaka, K. Lianget al.,Phys. Rev. Lett. 96,256402(2006).
[28] J. Laverock, A. R. H. Preston, D. J. Newby, K. E. Smith, and S. B. Dugdale,Phys. Rev. B84,235111(2011).
[29] S. Lee, J.-G. Park, D. Adroja, D. Khomskii, S. Streltsov, K. A. McEwen, H. Sakai, K. Yoshimura, V. I. Anisimov, D. Mori
et al.,Nat. Mater.5,471(2006).
[30] Since the Hirsh-Fye algorithm requires that all elements of the Umatrix be strictly positive, it was necessary to reduceJH to access a larger range ofUvalues
[31] P. Werner, E. Gull, and A. J. Millis,Phys. Rev. B79,115119 (2009).