Theory
Thesis by
Yang Shen
In Partial Fulfillment of the Requirements for the Degree of
Doctor of Philosophy
CALIFORNIA INSTITUTE OF TECHNOLOGY Pasadena, California
2020
© 2020 Yang Shen
ORCID: 0000-0001-6838-0925 All rights reserved.
ACKNOWLEDGEMENTS
The year of 2020 is one of the turning points in my life, especially during the pandemic. At this moment, I would like to express my gratitude to all the wonderful people I have met during the past six years at Caltech.
First of all, I want to thank my research advisor, Brent Fultz. I have been so fortunate to have the opportunity to work with him for over five years. Brent has provided enormous encouragement, guidance, patience and support for my study. He also gives me great support during the COVID-19 pandemic. This thesis would never have been completed without his mentorship.
I appreciate the support from my committee: Professors Austin Minnich, Marco Bernardi and Olle Hellman. Their expertise and insights in physics and materials science are very valuable and greatly enrich my work. In particular, I thank Olle for developing this amazing sTDEP method, which is the main computational tool I have been using in my research.
I would like to thank the former and current members of the Fultz group, who have been a constant source of thoughts and support: Fred Yang, Claire Saunders, Camille Bernal, Dennis Kim, Cullen Quine, Stefan Lohaus, Pedro Guzman, Channing Ahn, Hillary Smith, Jiao Lin, Chen Li and Heng Yang. They are so easy-going and have lots of passion. Special thanks to Fred, who was my office mate. He gave me the initiation class on computational physics, and helped me a lot on my academic projects and job search. I also want to thank: Claire for her constant support on the NaBr project and the folding back codes we wrote together, handling the compiling issues on NERSC, and her great patience during our discussions; Camille for her help on the NaBr project and the preparation of my thesis presentation; and both of them for delivering the food and helping me after my surgery.
I wish to acknowledge the generous help and support of our collaborators at Oak Ridge National Laboratory: Mike Manley and Doug Abernathy. They made our inelastic neutron scattering experiments possible. Mike also gave me helpful advice on my career path.
Finally, nothing I have accomplished would have been possible without the uncon-ditional love and support from my parents and my elder brother, and my fiancée and her parents. My fiancée and I have known each other for ten years, but for the most
part, we lived in different cities, or even different countries. We have already been through these years together and soon I will hold her hand forever. Ying, thank you.
ABSTRACT
Phonons, as the building blocks of solid-state physics, have been studied for almost one hundred years. The harmonic model is helpful when introducing the concepts and offering a basic physics picture of atomic vibrations. However, there are many properties that cannot be explained by the harmonic model or its extension to the quasiharmonic approximation (QHA), which ignores the pure temperature dependence of phonon frequencies. The rapid development of materials science requests a deep understanding of the phonon behaviors at elevated temperatures, where phonon-phonon interactions, as a main source of phonon anharmonicity, account for a number of abnormal phonon behaviors and the thermodynamical properties of many materials. In this thesis, I present the phonon anharmonicity in metals of Pd and Pt, the metallic compound FeGe2, and the polar material NaBr to show the limitation of the harmonic or QH model and the importance of taking anharmonic effects into consideration.
Inelastic neutron scattering (INS) was used to measure the phonon density of states (DOS) in fcc Pd and Pt metal at temperatures from 7 K to 1576 K. Both phonon-phonon interactions and electron-phonon-phonon interactions were calculated by methods based on density functional theory (DFT) and were consistent with the measured shifts and broadenings of phonons with temperature. Contributions to the entropy from phonons and electrons were assessed and summed to obtain excellent agree-ment with prior calorimetric data. The QH entropy is positive for both phonons and electrons but larger for phonons. The anharmonic phonon entropy is negative in Pt, but in Pd it changes from positive to negative with increasing temperature.
Phonon dispersions in a single crystal of FeGe2 with the C16 structure at 300, 500, and 635 K were measured by INS. Phonon DOS were also measured on poly-crystalline FeGe2 from 325 to 1050 K, and the Fe partial DOS was obtained from polycrystalline 57FeGe2 at 300 K using nuclear resonant inelastic X-ray scattering (NRIXS). The dominant feature in the temperature dependence of the phonon spec-trum is thermal broadening of high-energy modes. The energy shifts of the low-and high-energy parts of the spectrum were almost the same. DFT calculations performed with the QHA gave results in moderate agreement with the experimental thermal energy shifts, although the isobaric Grüneisen parameter calculated from the quasiharmonic model was smaller than that from measurements. The thermal broadening of the phonon spectrum and dispersions, especially at high energies,
in-dicates a cubic anharmonicity to second order that should also induce phonon shifts. There are cancellations of different anharmonic contributions to energy shifts, giv-ing average phonon shifts in moderate agreement to calculations with the QHA. The different parts of the large phonon contribution to the entropy are separated for FeGe2, showing modest but interpretable anharmonic contributions.
All phonons in a single crystal of NaBr were measured by INS at temperatures of 10, 300 and 700 K. Even at 300 K the phonons, especially the longitudinal optical (LO) phonons, showed large shifts in frequencies, and showed large broadenings in energy owing to anharmonicity. The QHA was an unqualified failure for predicting the temperature dependence of phonon frequencies, even at 300 K, and it predicted a thermal expansion that was in error by a factor of four. Ab initiocomputations that included both anharmonicity and quasiharmonicity successfully predicted both the temperature dependence of phonons and the large thermal expansion of NaBr. The frequencies of LO phonon modes decrease significantly with temperature owing to the real part of the phonon self-energy from explicit anharmonicity. The origin of the large cubic anharmonicity was identified with nearest-neighbor Na-Br bonds. Anharmonicity is not a small correction to the QHA predictions of thermal expansion and thermal phonon shifts, but anharmonicity dominates the behavior.
New spectral features were found in phonon dispersions of NaBr at 300 K.Ab initio calculations based on anharmonic perturbation theory also showed these spectral features as “many-body effects.” Their physical origin is better elucidated with a Langevin model, similar that in recent work in optomechanics. The transverse optic (TO) part of the new features originates from phonon intermodulation between the transverse acoustic (TA) and TO phonons. The LO spectral features originate from three-phonon coupling between the TA modes and the TO lattice modes.
PUBLISHED CONTENT AND CONTRIBUTIONS
[1] Coherent Sideband Quasiparticles Created from Anharmonic Phonons in NaBr. In Preparation.
Y. S conceptualized the project, conducted the experiment, reduced and analyzed the data, performed all calculations, and conducted the writing of the manuscript. [2] The Anharmonic Origin of the Giant Thermal Expansion of NaBr. Submitted to
PRL, under review.
Y. S conceptualized the project, conducted the experiment, reduced and analyzed the data, performed all calculations, and conducted the writing of the manuscript. [3] H. L. Smith, Y. Shen, D. S. Kim, F. C. Yang, C. P. Adams, C. W. Li, D. L. Abernathy, M. B. Stone, and B. Fultz. “Temperature dependence of phonons in FeGe2”. Physical Review Materials2,103602 (2018). DOI:
10.1103/PhysRev-Materials.2.103602.
Y. S, as the co-first author, analyzed the experimental data, performed the calcu-lations, analyzed the physics properties of the material, and participated in the writing of the manuscript.
[4] Y. Shen, C. W. Li, X. Tang, H. L. Smith, and B. Fultz. “Phonon anharmonicity and components of the entropy in palladium and platinum”. Physical Review B
93,214303 (2016). DOI:10.1103/PhysRevB.93.214303.
Y. S, as the co-first author, analyzed the experimental data, performed part of the calculations, and participated in the writing of the manuscript.
TABLE OF CONTENTS
Acknowledgements . . . iv
Abstract . . . vi
Published Content and Contributions . . . viii
Table of Contents . . . viii
List of Illustrations . . . x
List of Tables . . . xx
Chapter I: Introduction . . . 1
1.1 Introduction to Phonons . . . 1
1.2 Vibrational Thermodynamics of Solids . . . 1
1.3 Computational Method. . . 6
Chapter II: Phonon Anharmonicity and Components of the Entropy in Palla-dium and Platinum . . . 10
2.1 Introduction . . . 10
2.2 Experiment . . . 11
2.3 Computational Methodology . . . 12
2.4 Results and Discussion . . . 13
2.5 Conclusions . . . 25
Chapter III: The Temperature Dependence of Phonons in Iron Germanide . . 26
3.1 Introduction . . . 26 3.2 Experiment . . . 28 3.3 Computation . . . 29 3.4 Results . . . 31 3.5 Discussion . . . 33 3.6 Conclusion . . . 44 3.7 Supplemental Material . . . 44
Chapter IV: The Anharmonic Origin of the Giant Thermal Expansion of Sodium Bromide . . . 57
4.1 Main Text . . . 57
4.2 Supplementary Material . . . 64
Chapter V: Coherent Sideband Quasiparticles Created from Anharmonic Phonons in Sodium Bromide . . . 81
5.1 Main Text . . . 81
5.2 Methods . . . 89
5.3 Supplementary Material . . . 90
Chapter VI: Future Work . . . 101
6.1 Effects of Phonon Anharmonicity on Dielectric Properties . . . 101
6.2 Experimental Detection of Localized Phonon Behaviors . . . 103
LIST OF ILLUSTRATIONS
Number Page
1.1 Three-phonon interaction processes that may destroy or create the phonon with wave vectorq. . . 5 1.2 Overview rendering of ARCS with components labeled. . . 9 2.1 Calculated phonon dispersions of (a) Pd and (b) Pt along high
sym-metry directions, with points from experimental data of Refs. [1,2]. . 13 2.2 Experimental phonon DOS curves of Pd (a) and Pt (b) normalized to
unity. Curves are offset for clarity. . . 14 2.3 Fittings of Pt phonon DOS at 1576 K using broadened, shifted DOS
curve from 7 K. (a) Fit using Eq. 2.5. (b) Fit using Eq. 2.6 with separate transverse and longitudinal components. . . 16 2.4 Temperature dependences from data of Fig. 2.2 for (a) phonon shift
𝜂vs. 𝑇, and (b) broadening 1/Qvs. 𝑇 for Pd and Pt. . . 17 2.5 Electron-phonon contributions to phonon linewidth of Pd (solid line)
and Pt (dotted line) at 0 K. . . 18 2.6 Phonon-phonon contributions to phonon linewidth of Pd (solid line)
and Pt (dotted line) at 0 K. . . 19 2.7 Phonon-phonon contributions to phonon linewidth of Pd (solid line)
and Pt (dotted line) at 900 K. . . 20 2.8 The origins of entropy of (a,b) Pd and (c,d) Pt. (a,c) “Calorimetry”
points are from Arblaster[3, 4], 𝑆ph are from data of Fig. 2.2 and Eq. 2.10, 𝑆ph,H was calculated with Eq. 2.10 and the measured phonon DOS at 7 K, and 𝑆el is the sum of 𝑆el,G and Δ𝑆el,D. (b,d) The different minor contributions make up less than 10% of the total entropy. They are from the lattice dilation influence on phonons and electrons (Δ𝑆ph,QH, Δ𝑆el,D), the anharmonicity (Δ𝑆ph,Anh) and the adiabatic EPI induced thermal broadening in electron DOS (Δ𝑆ad
el,ep). The Δ𝑆ad
el,ep was first calculated using the electron-phonon coupling parameter, 𝜆 at 𝑇 = 0 K (Δ𝑆ad
el,ep(
𝜆)), and then rescaled by Monte Carlo calculations to give our preferredΔ𝑆ad
2.9 The electronic DOS of Pt at the ground state, with dilation, and with thermal broadening by the adiabatic electron-phonon interac-tion. Curves are offset for clarity. . . 24 3.1 Crystal structure of FeGe2. It is a tetragonal C16 structure with
alter-nating layers of Fe and Ge atoms. The positions of atoms are[5]: Fe (orange) at(0,0,0),(0,0,1 2)and Ge (blue) at(𝑥 , 1 2+𝑥 , 1 4),(𝑥 ,¯ 1 2−𝑥 , 1 4), (12 +𝑥 ,𝑥 ,¯ 1 4), ( 1 2 − 𝑥 , 𝑥 , 1
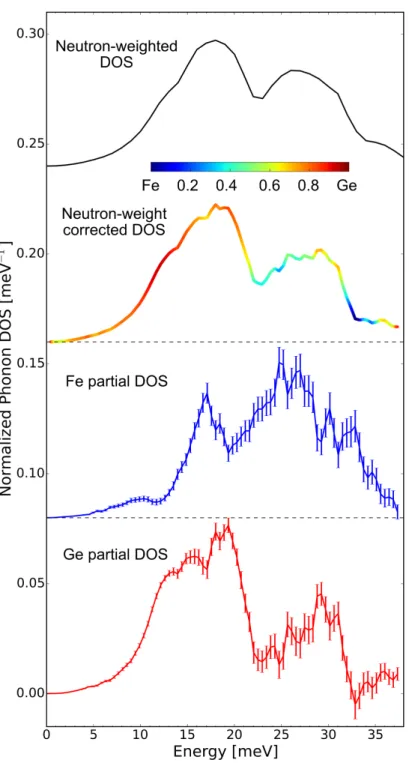
4), where𝑥 = 0.1547 is the atomic param-eter for Ge positions. Bonds are only drawn between first nearest-neighborhoods (1NN). Plus and minus signs identify the collinear spin structure of the anti-ferromagnetic low-temperature phase[5–11]. 27 3.2 Neutron-weighted phonon DOS of FeGe2. Experimental data from
INS (black circles) is overlaid with the DOS calculated with the QHA (a, left) before convolution (blue line) and (b, right) after convolution (red line). Curves are normalized to unity and offset for clarity. . . . 31 3.3 Temperature dependence of phonon modes. (a) Phonon shifts and (b)
phonon broadenings are shown as functions of temperature. The low-and high-energy modes refer to the two main peaks in the phonon DOS curves shown in Fig 3.2. They are all linear with temperature, except for the phonon broadening of the high-energy modes. Error bars are from the fitting procedure. . . 32 3.4 Correcting the neutron weighting using Eq. 3.1 by measuring the Fe
partial DOS from NRIXS experiments. All data are normalized to unity and at the temperature of 325 K. Error bars are from counting statistics. . . 34 3.5 Single crystal FeGe2along the [H00] direction. (a.)-(c.) The [H00]
direction at 300, 500, and 635K, respectively. The gray stripe in-dicates the region of the cut shown in (d.) (d.) Cut of data at 4.0 r.l.u. is shown for 300K (dark blue), 500K (blue), and 635K (light blue), offset for clarity, with error bars represented by the width of the curve. (e.) Positions of low and high energy modes from fits to the experimental data in d. are in red with the shaded region showing the line width approximated by the peak FWHM. The position of the high energy mode predicted by the quasiharmonic model is shown in black. . . 35
3.6 Single crystal FeGe2 along the [HH0] direction. (a-c) The [HH0] direction at 300, 500, and 635K, respectively. White spaces indicate regions without detector coverage. The gray stripes indicates the region of the cuts shown in (d) and (f) (d) and (f) Cuts of data at 2.95 and 3.25 r.l.u., respectively, at 300K (dark blue), 500K (blue), and 635K (light blue), offset for clarity, with error bars represented by the width of the curve. (e) and (g) Positions of low and high energy modes from fits to the experimental data in (d) and (f), respectively, are shown in red. The shaded regions show the line width approximated by the peak FWHM. The position of the high energy mode predicted by the QH model is shown in black. . . 36 3.7 Single crystal FeGe2 overlaid with QH calculation. Phonon
disper-sion curves from the QH calculation are mapped over the measured 𝑆(Q, 𝐸). The calculated dispersions are truncated for clarity, but ex-tend further in reciprocal lattice units with the same periodicity. (a) and (b) show the [HH0] and [H00] direction at 300 K, respectively. (c) and (d) show the [HH0] and [H00] direction at 635 K, respectively. 37 3.8 Displacement pattern for LO phonons in the [110] direction. The
Fe-Ge bonds undergo asymmetrical stretching when Fe (orange) and Ge (blue) atoms move towards (a, green arrows) and away from (b, red arrows) each other. . . 38 3.9 Phonon self-energy of FeGe2 along [HH0] and [H00] directions at
635 K. (a) Imaginary part of the phonon self-energy which gives the spectral linewidth. (b) Real part of the phonon self-energy which accounts for the phonon energy shifts. It is shown that the high-energy phonon modes (above 21 meV) have much shorter phonon lifetimes than the low-energy modes (Γhigh/Γlow ' 4), while the softening in the high- and low-energy phonon modes are almost the same ((Δhigh −Δlow)/Δhigh
3.10 Temperature dependence of the entropy in FeGe2 and the phonon contribution to its heat capacity. (a) Components of the entropy[12] of FeGe2 and their temperature dependence. 𝑆ph,Exp are from the neutron-weighted (in black) and neutron weight-corrected (in blue) phonon DOS respectively. 𝑆ph,QHA (in red) are from the calculated phonon DOS using the quasiharmonic approximation. The anhar-monic contribution (Δ𝑆ph,Anh, in green) was obtained byΔ𝑆ph,Anh = 𝑆nw−corrected
ph,Exp −
𝑆ph,QHA. The small entropy from electrons (𝑆el,est., in navy) was estimated with 𝑆el,est. = 𝜋
3𝑘B𝑇 𝑛(𝜖F), where 𝑛(𝜖F) is the electronic DOS at the Fermi level in the ground state. (b) Temper-ature dependence of the phonon contribution to the heat capacity, calculated from measured phonon DOS by the INS experiments and QH approximation. Magnetic contributions, not shown here, are expected at low temperatures. . . 42 3.11 Neutron powder diffraction patterns of polycrystalline FeGe2at 323,
476, 650, 850 and 1050 K. Diffraction patterns were obtained from elastic scattering in the experimental data sets containing the inelastic neutron scattering measurements used for the phonon densities of states. Intensity is plotted as a function of𝑄, with each colored curve corresponding to a different temperature. The [hkl] index of each peak is labeled. Three peaks from the Nb sample holder are indexed. 45 3.12 Lattice constants of FeGe2. The lattice constants for𝑎 = 𝑏 > 𝑐 are
shown as functions of temperature. A linear thermal expansion of the lattice constants is observed, in agreement with previously reported room temperature data [13]. . . 46 3.13 Thermal Expansion of FeGe2. The coefficient of thermal expansion is
obtained by fitting the data in Fig. 3.12 to𝑎𝑇 −𝑎o 𝑎o
=𝛼𝑎·(𝑇−𝑇o)where 𝑎orepresents the lattice parameter at𝑇 =𝑇o(𝑇o=323 K) and𝛼𝑎is the linear thermal expansion coefficient of the lattice parameter in the 𝑎 direction. This is a first order temperature independent approximation of the thermal expansion coefficient. The linear thermal expansion in the𝑐direction is found by application of the same equation with𝑎 replaced by𝑐. . . 47
3.14 Detailed computational results with quasiharmonic approximation. (a) Calculated phonon DOS (dash line) without convolution with the instrument resolution function. Experimental data from INS (solid line) is also presented for comparison. (b) Calculated Fe (left panel, in red) and Ge (right panel, in blue) partial phonon DOS. Curves are normalized to unity and offset for clarity. . . 48 3.15 Elastic scattering from single crystal FeGe2. The crystal was
ori-ented in the [00L] zone axis, with the [HK0] crystallographic plane horizontal. Slices of the elastic plane were obtained by integrating from -1 to 1 meV in energy, and over the L-direction from -0.15 to 0.15. For the tetragonal symmetry of the crystal, the [0K0] and [H00] directions are crystallographically equivalent, as are the [HH0] and [HH0] directions. (a) and (b) 300 K, (c) and (d) 500 K (e) and (f) 635 K. . . 49 3.16 Inelastic scattering from single crystal FeGe2along the [0K0]
direc-tion. (a-c) The [0K0] direction at 300, 500, and 635 K, respectively. The gray stripe shows the region of the cut shown in panel (d). (d) Cut of data at 7.3 r.l.u. is shown for 300 K (dark blue), 500 K (blue), and 635 K (light blue), offset for clarity, with error bars shown by the width of the curve. (e) Centers of the high-energy modes from fits to the experimental data in panel (d) are in red, with the shaded region showing the peak FWHM. The center of the high-energy mode predicted by the quasiharmonic model is shown in black. . . 50 3.17 Inelastic scattering from single crystal FeGe2 along the [HH0]
di-rection. (a) and (b) The [HH0] direction at 300 and 635 K with the positions of the peaks indicated by white circles and bars showing the FWHM from the fits. (c) The peak centers at 300 and 635 K, showing thermal shifts of the dispersions. (d) The same peak cen-ters in (c), but with shaded regions indicating the FWHM, showing approximately the change in thermal broadening with temperature. . . 51
3.18 Inelastic scattering from single crystal FeGe2along the [0K0] direc-tion. (a) and (b) The [0K0] direction at 300 and 635 K, with peak centers indicated with white circles, and bars showing the FWHM ob-tained from the fits. (c) The peak centers at 300 and 635 K, showing thermal shifts of the dispersions. (d) The same peak centers in (c), but with shaded regions indicating the FWHM, showing approximately the change in thermal broadening with temperature. . . 52 3.19 Inelastic scattering from single crystal FeGe2along the [HH0]
direc-tion. (a) and (b) The [HH0] dispersions at 300 and 635 K. The gray stripes indicate the regions of the cuts below. Cuts of data at the r.l.u. indicated on the plots are shown for 300 K (dark blue) and 635 K (light blue). To the right of each plot are shown centers of the peaks (identified in corresponding color), with bars showing the FWHM of the peaks. . . 53 3.20 Inelastic scattering from single crystal FeGe2along the [0K0]
direc-tion. (a) and (b) The [0K0] dispersions at 300 and 635 K. The gray stripes indicate the regions of the cuts below. Cuts of data at the r.l.u. indicated on the plots are shown for 300 K (dark blue) and 635 K (light blue). To the right of each plot are shown centers of the peaks (identified in corresponding color), with bars showing the FWHM of the peaks. . . 54 3.21 Calculated phonon self-energy ofΓ-point phonons in FeGe2at 635 K.
(a) The phonon spectrum at Γ at 635 K was calculated by ab ini-tio stochastically initialized temperature-dependent effective poten-tial method (s-TDEP) method. Colors represent different phonon branches. (b, c) Third-order force constants were used to calculate the imaginary part and the real part of the phonon self-energy. The averaged values are shown by the bold red line. This is consistent with the results in our main text obtained from the phonon DOS measurements and single crystal data. And it shows that QHA is not enough, because the cubic anharmonicity plays an important role in the phonon broadening in the high-energy modes of FeGe2. More results are shown in the next figure. . . 55
3.22 Calculated phonon spectrum function along [HH0] and [H00] direc-tions in FeGe2at 635 K. The phonon spectra along the two symmetry lines at 635K were calculated by ab initio stochastically initialized temperature-dependent effective potential method (s-TDEP) method. Colors represent different phonon branches. . . 56 4.1 Comparison between computational (QHA and fully anharmonic)
and experimental (INS) results on phonon dispersions of NaBr. (a-c) Phonons in NaBr calculated with the QHA (white dotted line), with only the second-order force constants from sTDEP (black dashed line), and from the full phonon spectral function (logarithmic in-tensity map) from sTDEP. Temperatures are labeled in the panels. (d-f) Corresponding 2D slices through the four-dimensional scatter-ing function 𝑆(Q, 𝜀), where 𝜀 = ℏ𝜔, along high symmetry lines in the first Brillouin zone. . . 59 4.2 Thermal expansion of NaBr. The ab initio QHA (blue solid line)
and anharmonic calculations (red solid circles) are compared with experimental results [14–17]. There is a large discrepancy between the measurements and the QHA predictions, while results from the sTDEP method are in close agreement with the experiments. . . 60 4.3 Measured and calculated phonon lineshapes at the 𝐿-point and the
real part of the phonon self-energy. (a) The 1D cut of 𝑆(Q, 𝜀) at a constant Q = [0.5,0.5,0.5]r.l.u. (reciprocal lattice units), show-ing the temperature dependence of phonon lineshapes. (The small peak near zero is the residue from elastic scattering after correct-ing for the phonon creation thermal factor.) (b) Real component of the phonon self-energy Δ from the third-order force constants. (c) Phonon intensities after nulling the third-order force constants,
Φ𝛼𝛼𝛼
NaNaBrorΦ 𝛼𝛼𝛼
NaBrBr, associated with the nearest-neighbor degenerate triplets, where𝛼 = (𝑥 , 𝑦, 𝑧)represents the direction along the Na-Br bond. . . 63 4.4 Experimental phonon dispersions of NaBr alongΓ-𝑋andΓ-𝐿. Phonon
dispersions are shown by 2D slices of the𝑆(Q, 𝜀)data along the high symmetry lines ofΓ-𝑋(a-c) andΓ-𝐿(d-f) at the temperature of 10 K (a, d), 300 K (b, e) and 700 K (c, f). . . 74 4.5 The raw dos from INS experiment on the single crystal. . . 75
4.6 Comparison between the experimental phonon DOS extracted from the INS data and the calculated phonon DOS with anharmonicity at 300 K. . . 76 4.7 Comparison between the experimental phonon DOS extracted from
the INS data and the calculated phonon DOS with anharmonicity at 700 K. . . 77 4.8 Intermediate results for expansion coefficients of NaBr calculated
with the QHA. a, The Helmholtz free energy as a function of tem-perature and volume. The volume-energy data was fitted to a Birch-Murnaghan equation of state. b, The equilibrium volumes with tem-perature, obtained by minimizing the free energy at each temperature. 78 4.9 Thermal expansion coefficients of NaBr, measured and calculated
by QHA. The ab initio quasiharmonic predictions (red solid line) are compared to the experimental results [15–17]. The linear thermal expansion coefficients,𝛼, are a factor of four lower than experimental results. . . 78 4.10 Measured and calculated phonon lineshapes atQ= [0.1,0.2,0.3]r.l.u.
and the real part of the phonon self-energy. a, The 1D cut of𝑆(Q, 𝜀)at a constantQ= [0.1,0.2,0.3]r.l.u.(reciprocal lattice units), showing the temperature dependence of phonon lineshapes in NaBr. At this 𝑄-point, the LO phonon peak has an energy decrease with tempera-ture of 3 ∼4 meV. This can be attributed to the real component of the phonon self-energy as shown in (b). The intensity data were scaled and offset for clarity. c, By nulling the third-order force constants,
Φ𝛼𝛼𝛼
NaNaBrorΦ 𝛼𝛼𝛼
NaBrBr, associated with the nearest-neighbor degenerate triplets, where𝛼 = (𝑥 , 𝑦, 𝑧)represents the direction along the Na-Br bond, the lineshapes at this𝑄-point become narrow Lorentzian peaks at 700 K and the energy decrease of the LO mode vanishes. . . 79 4.11 Measured and calculated phonon lineshapes atQ= [0.1,0.5,0.7]r.l.u.
and the real part of the phonon self-energy. The panels are the same quantities in the previous figure, but for Q = [0.1,0.5,0.7]r.l.u. It is seen again that the LO phonon mode shifts to a lower energy at 700 K, mainly due to the cubic interactions. . . 80
5.1 Comparison between experimental and computational phonon disper-sions of NaBr. a-b, 2D slices through the four-dimensional scattering function 𝑆(Q, 𝜀), where 𝜀 = ℏ𝜔, along high symmetry lines in the first Brillouin zone. c-d, Phonons in NaBr calculated with the quasi-harmonic approximation (white dotted line), with only the quadratic force constants s-TDEP (black dashed line), and the full phonon spec-tral function with phonon self-energy corrections. Temperatures are labeled. The IPS “G” is seen in the experimental and computational results around the X point at 300 K. The calculation also shows an ILM near theΓ-point at 300 K. . . 82 5.2 Three-phonon processes associated with the IPS and ILM. a,
Calcu-lated phonon lineshapes at the high symmetry points of 𝑋,𝐾 andΓ. The first two were used to identify the components of the IPS, and the calculated ILM is shown in the bottom panel. The phonon spectral function was recalculated b, without the three-phonon processes of TA+TO TO/LO, and c, without TA phonons between 7-9 meV included in the three-phonon processes, compared with the original result in Fig. 5.1d. d, Table of phonon processes for IPS and the ILM. 83 5.3 Phonon self-transduction block diagram and its features. a, The TO
phonons and the TA phonons within 7-9 meV are coupled by phonon-phonon interactions. Meanwhile, they are in thermal equilibrium with the bath, which is an ensemble of other phonons. b, The power spectral density for coupling strengths in four coupling domains. . . . 86 5.4 Information on background analysis. a-d, 2D slices through the
four-dimensional scattering function 𝑆(Q, 𝜀), where 𝜀 = ℏ𝜔, along high symmetry lines in the first Brillouin zone, measured at 10 K (a, c) and 300 K (b, d) respectively. a-b are the final results of single crystal NaBr and c-d are the background measurements of the empty aluminum can. Corresponding aluminum phonon DOS from previous measurements [18] are shown in e (10 K) and f (300 K). ’G’ refers to the intermodulation phonon sideband. . . 98 5.5 Calculated phonon DOS and one-phonon spectra before phonon
self-energy corrections. Phonons involved in the three-phonon processes for IPS feature are indicated by the shaded regions. The one-phonon spectra are given by 𝐴1(𝜖) = 𝑔(𝜀)
𝜀 1
𝑒𝜀/𝑘B𝑇−1, where
𝑔(𝜖)is the phonon DOS. . . 99
5.6 Measured constantq-𝑆(q, 𝜖)data at ten different points at 300 K. a-j, Measured intensity data are black empty circles. Fitted peaks are in blue, and the cumulative fitting results are in red. k, Table of the
q-points corresponding to each sub-figure. . . 100 6.1 Phonons in NaBr at 700 K. The one on the left panel is the
exper-imental result. The one on the upper right panel is the result with QHA, and the one on the lower right panel is the calculated anhar-monic phonon lineshape. It is shown that the abnormal feature is not reproduced by either of the computational methods. . . 101 6.2 Mixed phonon spectral function of NaBr at 700 K when𝛼 =1. . . 102
LIST OF TABLES
Number Page
3.1 Minimum energies for C16 and C1 structure from DFT calculations for non-magnetic, ferromagnetic (FM) and anti-ferromagnetic (AFM) states. . . 35 3.2 Measured and calculated Gruneisen parameter of FeGe¥ 2at 650 K. The
calculation used the QHA. The experimental results were obtained from peak positions and the first moment of the measured phonon DOS curves. . . 39 4.1 Phonon energy shifts of the LO mode with temperature. . . 62 5.1 Fitting parameters. . . 97
C h a p t e r 1
INTRODUCTION
1.1 Introduction to Phonons
Phonons, as building blocks of solid-state physics, have been studied for almost one hundred years[19,20]. Phonons describe the states of atomic motions. With mutual interactions between atoms, local motional excitations lead to collective vibrations of the whole solid[21]. It is therefore appropriate to use normal coordinates for the mathematical description of atomic dynamics. The lattice vibrations can be readily quantized in this new representation; the associated quanta are elementary excitations calledphonons.
1.2 Vibrational Thermodynamics of Solids
The basic model starts with an infinitely repeating lattice, in which the atoms are vibrating around their equilibrium positions. The mass of an atom is in its point-like nucleus, and the forces between nuclei are transmitted through lightweight elec-trons, which are typically assumed to respond instantly to nuclear displacements[22] (Born–Oppenheimer approximation).
Since most of the atom mass is in the nucleus, for lattice dynamics the Hamiltonian for nuclear motions in a crystal can be taken as
H =Õ
𝑖
p2𝑖
2𝑚𝑖
+Φ. (1.1)
The potential energy, Φ, can be expanded in powers of the atomic displacements from their equilibrium positions as
Φ = Φ0+ Õ 𝛼 Φ𝛼 𝑖 𝑢 𝛼 𝑖 + Õ 𝛼 𝛽 Φ𝛼 𝛽 𝑖 𝑗 𝑢 𝛼 𝑖 𝑢 𝛽 𝑗 + 1 3! Õ 𝑖 𝑗 𝑘 Õ 𝛼 𝛽𝛾 Φ𝛼 𝛽𝛾 𝑖 𝑗 𝑘 𝑢 𝛼 𝑖𝑢 𝛽 𝑗𝑢 𝛾 𝑘 +. . . , (1.2)
respect to the displacements (u= Õ 𝛼=𝑥 , 𝑦,𝑧 𝑢𝛼eˆ𝛼): Φ𝛼 𝑖 = 𝜕Φ 𝜕 𝑢𝛼 𝑖 0 =0 (1.3) Φ𝛼 𝛽𝑖 𝑗 = 𝜕 2Φ 𝜕 𝑢𝛼 𝑖 𝜕 𝑢 𝛽 𝑗 0 (1.4) Φ𝛼 𝛽𝛾 𝑖 𝑗 𝑘 = 𝜕3Φ 𝜕 𝑢𝛼 𝑖 𝜕 𝑢 𝛽 𝑗𝜕 𝑢 𝛾 𝑘 0 (1.5) . . . Harmonic Approximation
If the expansion is terminated after the first non-vanishing (quadratic) term, for each atom𝜅in the unit cell𝑙, it can be solved by the wave function of [23]
u𝑖 = 1 √ 𝑚𝑖 Õ q 𝐴q𝝐𝑖q𝑒𝑖(q·R−𝜔𝑡) . (1.6) Here the displacements are expressed as a sum of normal modes, each with wave vectorqand frequency𝜔. 𝐴qis the normal mode amplitude, and𝝐 is a polarization vector determined by 𝜔2 q𝝐q =𝚽(q)𝝐q , (1.7) where 𝚽(q) = © « 𝚽11(q) · · · 𝚽𝑁1(q) . . . .. . . . . 𝚽1𝑁(q) · · · 𝚽𝑁 𝑁(q) ª ® ® ® ¬ (1.8)
is the dynamical matrix. Each sub-matrix𝚽𝑖 𝑗(q) =
Õ R 𝚽𝑖 𝑗(R) √ 𝑚𝑖𝑚𝑗 𝑒𝑖q·R is the Fourier transform of the second-order force-constant matrix. It can be shown that the dynamical matrix is Hermitian, so the𝜔2are real as the dynamical matrix is fully diagonalizable for any 𝑞. The eigenvectors (𝝐q𝑗) and eigenvalues (𝜔2
q𝑗) of the dynamical matrix evaluated at a particular wavevector q then correspond to the eigenmodes of vibration of the crystal for that wavevector. Owing to the periodicity of the reciprocal lattice, it is convenient to limit the solution to only vectorsqin the first Brillouin zone. The phonon density of states (DOS) is then
𝑔𝑠(𝜔) = (2𝜋)3 𝑉 ∫ BZ 𝛿(𝜔−𝜔q𝑗)𝑑q. (1.9)
Phonons are bosons, and their contribution to the Helmholtz free energy of the material is given by 𝐹ph =−𝑘𝐵𝑇ln𝑍 = Õ q𝑗 ℏ𝜔q𝑗 2 +𝑘𝐵𝑇ln 1−exp −ℏ𝜔q𝑗 𝑘𝐵𝑇 . (1.10)
The vibrational free energy and all other thermodynamic properties in the harmonic approximation can be determined from the phonon frequencies calculated at the equilibrium volume𝑉0. Two computational approaches usually used, 1) the supercell method, and 2) density functional perturbation theory (DFPT).
The harmonic potential is a good approximation at low energy (temperature), but it becomes inadequate as the temperature increases. There are several limitations of the harmonic approximation:
• no thermal expansion as𝑉 is a constant (𝑉 ≡𝑉0),
• phonons are independent, • infinite phonon lifetime, • infinite thermal conductivity,
• no effects of𝑇 outside of populating fixed phonon modes
We will see how these limitations are overcame in this thesis, and the new and exciting physics that lies beyond the harmonic model.
Quasiharmonic Approximation (QHA)
As an ‘extension’ of the harmonic approximation, the QHA introduces an explicit dependence of phonon frequencies on volume into the Helmholtz free energy as
𝐹QHA(𝑇 , 𝑉) =𝑈0(𝑉) + Õ q, 𝑗 ℏ 𝜔q, 𝑗(𝑉) 2 +𝑘B𝑇ln 1−exp −ℏ𝜔q, 𝑗(𝑉) 𝑘B𝑇 , (1.11)
where𝑈0(𝑉) is the ground-state internal energy without any vibrational contribu-tion and the term 𝑘Bln[...] includes the entropy that depends on volume through the individual phonon frequencies 𝜔q, 𝑗 = 𝜔q, 𝑗(𝑉) (for the 𝑗-th phonon branch at wavevectorq). The equilibrium volume at a given temperature𝑇 was obtained by minimizing𝐹QHA(𝑇 , 𝑉)with respect to volume𝑉, keeping𝑇 as a fixed parameter. The QHA offers thermal expansion as a parameter to minimize free energy, so the phonon frequency will no longer be the same as that at 0 K. However, in the QHA, all phonons calculations are still performed with a harmonic potential energy.
Anharmonic Phonons
Within the harmonic or quasiharmonic approximation, phonons are non-interacting elementary excitations, and therefore have infinite lifetimes. Including higher terms (anharmonic terms) in the expansion of the potential means that harmonic phonons are no longer true eigenstates of the system. This leads to interactions between phonons. As a result, a phonon from a given state will decay into other phonons after a finite time. Their frequencies will also be shifted[24].
As we discussed before, in perturbation theory, the crystal potential is expanded as a power of displacement and the Hamiltonian may be written as[24]:
H =H0+𝜆H3+𝜆2H4+𝜆3H5+. . . (1.12)
where H0 is the harmonic Hamiltonian and H3,H4,H5. . . are the perturbation terms involving three, four, five ... interacting phonons. The simplest case is the three-phonon interaction where a phonon decays to form two other phonons and vice-versa.
In three-phonon processes the number of phonons changes. There are four basic processes[24]: absorption of a phonon with formation of two other phonons, ab-sorption of two phonons with formation of another, simultaneous disappearance and simultaneous creation of three phonons. The two last possibilities clearly violate energy conservation. We must however include them in our considerations as pos-sible virtual subprocesses of multiple-step interactions. The pospos-sible interactions are shown in Fig.1.1. The Hamiltonian for three-phonon processes reads[24]:
𝐻3 = 1 3! Õ qq0q00 Õ 𝑗 𝑗0𝑗00 ℏ3/2 23/2𝑁1/2 Φ(q𝑗 ,q0𝑗0,q00𝑗00) √ 𝜔q𝑗𝜔q0𝑗0𝜔q00𝑗00 𝛿q+q0+q00,G × (𝑎† −q𝑗+𝑎q𝑗) (𝑎 † −q0𝑗0 +𝑎q0𝑗0) (𝑎† −q00𝑗00+𝑎q00𝑗00) , (1.13)
where Φ(q𝑗 ,q0𝑗0,q00𝑗00) is the three-phonon matrix element obtained from the cubic force constants by Fourier transformation„ q,q0,q00 are the wave vectors of the three phonons involved in the process andGis the reciprocal lattice vector. The 𝛿-function guarantees momentum conservation in these processes. The last three terms of Eq.1.13represent the different processes of creation and annihilation of the three phonons.
Using results from many-body theory, the phonon frequencies were obtained from the dynamical matrix for the quadratic force constants, and then corrected by the
!′′ ! !′ !′′ ! !′ ! ! !′ !′′ !′′ !′
Figure 1.1: Three-phonon interaction processes that may destroy or create the phonon with wave vectorq.
real (Δ) and imaginary (𝑖Γ) parts of the phonon self-energy. The imaginary part was calculated with the third-order force constants,
Γ𝜆(Ω) = ℏ𝜋 16 Õ 𝜆0𝜆00 |Φ𝜆𝜆0𝜆00| 2 (𝑛𝜆0 +𝑛𝜆00+1) ×𝛿(Ω−𝜔𝜆0 −𝜔𝜆00) +(𝑛𝜆0 −𝑛𝜆00) × [𝛿(Ω−𝜔𝜆0+𝜔𝜆00) −𝛿(Ω+𝜔𝜆0 −𝜔𝜆00)] , (1.14) whereΩ = 𝐸/ℏ) is the probing energy. The real part was obtained by a Kramers-Kronig transformation Δ(Ω) =P ∫ 1 𝜋 Γ(𝜔) 𝜔−Ω d𝜔 . (1.15)
Equation1.14is a sum over all possible three-phonon interactions, whereΦ𝜆𝜆0𝜆00 ,
Φ(q𝑗 ,q0𝑗0,q00𝑗00),𝑛is the Bose-Einstein thermal occupation factor giving the num-ber of phonons in each mode, and the delta functions conserve energy and momen-tum.
The temperature dependence of phonon frequencies are now available for more accurate calculations of vibrational thermodynamics of solids
𝐹Anh ph (𝑉 , 𝑇) = Õ q, 𝑗 ℏ 𝜔q, 𝑗(𝑉 , 𝑇) 2 +𝑘B𝑇ln 1−exp −ℏ 𝜔q, 𝑗(𝑉 , 𝑇) 𝑘B𝑇 . (1.16)
Intrinsically localized mode
An intrinsically localized mode (ILM) is another interesting vibrational phenomenon in anharmonic solids. When atoms interact with nonlinear forces, a large, local vibrational fluctuation is accompanied by a frequency shift that can stabilize the
dynamics of an atom and its neighbors. The theoretical background was first investigated by Takeno, Sievers, and co-workers[25–27]. They used a classical one-dimensional monatomic chain of particles interacting by nearest-neighbor springs with harmonic and anharmonic forces plus forces from a quartic potential. With the rotating wave approximation (RWA), the lattice could sustain stationary localized vibrations when the anharmonic forces were sufficiently strong[28]. In a crystal, where the normal modes form well-defined frequency bands, these local fluctuations can develop frequencies that do not resonate with any normal modes, resulting in an ILM[29].
During the past three decades, ILMs have been investigated by simulations for var-ious model potentials, and extended to three dimensions[30–33]. More recently, ILMs have been observed in real materials like 𝛼-U[29], NaI[34] and PbSe[35]. They have also been reported in other systems, such as antiferromagnets[36], proteins[37] and coupled Josephson junction arrays[38]. However, the direct con-nection between simulations with model potentials and ILMs in real materials is largely missing. In this thesis, I introduce a new concept of intermodulation phonon sidebands (IPS) as a more general case of highly anharmonic phonon behavior. The ILM arises as one of the two sidebands. I report the observation of the upper sideband for the first time, in both inelastic neutron scattering spectra and computed phonon spectral weights of NaBr.
Beyond the perturbation framework
The Hamiltonian we used in Eq.1.12is within in the perturbation theory. What if large anharmonic terms push the system beyond the applicability of the perturbation framework? To continue, new tools should be developed, as well as new concepts. We will walk through the example of NaBr in Ch. 5 to see the exciting findings beyond perturbation theory.
1.3 Computational Method
To simulate anharmonic phonons by perturbation theory, O. Hellman, et al., have de-veloped the stochastic Temperature Dependent Effective Potential (sTDEP) method[39–
41].
atom are the sums of contributions from 3𝑁 normal modes u𝑖 = 3𝑁 Õ 𝑠=1 𝝐𝑖 𝑠𝐴𝑖 𝑠sin(𝜔𝑠𝑡+𝛿𝑠) , (1.17) ¤ u𝑖 = 3𝑁 Õ 𝑠=1 𝝐𝑖 𝑠𝐴𝑖 𝑠𝜔𝑠cos(𝜔𝑠𝑡+𝛿𝑠) , (1.18)
where 𝐴𝑠 is the normal mode amplitude, 𝛿𝑠 is the phase shift, 𝜔𝑠 and 𝝐𝑠 are eigenvalue and eigenvector corresponding to mode𝑠.
To obtain a set of positions and velocities that correspond to a canonical ensemble, we choose the 𝐴𝑠 and𝛿𝑠 so they are normally distributed around their mean value. Each mode𝑠should contribute, on average,𝑘B𝑇/2 to the internal energy. Then
h𝐴𝑖 𝑠i= s ℏ(2𝑛𝑠+1) 2𝑚𝑖𝜔𝑠 ≈ 1 𝜔𝑠 r 𝑘B𝑇 𝑚𝑖 , (1.19)
where the approximate result is in the classical limit,ℏ𝜔 𝑘B𝑇. The appropriate distribution of atomic positions and velocities are
u𝑖 = 3𝑁 Õ 𝑠=1 𝝐𝑖 𝑠h𝐴𝑖 𝑠i p −2 ln𝜉1sin 2𝜋 𝜉2, (1.20) ¤ u𝑖 = 3𝑁 Õ 𝑠=1 𝜔𝑠𝝐𝑖 𝑠h𝐴𝑖 𝑠i p −2 ln𝜉1cos 2𝜋 𝜉2, (1.21)
where 𝜉𝑛(𝑛 = 1,2) represent a uniform distribution of random numbers between
(0,1), which are transformed to a normal distribution using the standard Box-Muller transform. The Box-Mueller transform gives a Gaussian distribution of atom displacements, but the displaced atoms still see the full anharmonicity from DFT[40,41].
In this procedure, the Born-Oppenheimer surface is sampled by a Monte Carlo sampling of atomic positions and momentum near equilibrium positions. By per-forming DFT calculations for various configurations of displaced atoms generated by a stochastic sampling of a canonical ensemble, with Cartesian displacements (𝑢𝛼
𝑖) normally distributed around the mean thermal displacement, the forces on atoms were fitted to a model Hamiltonian
ˆ 𝐻 =𝑈0+ Õ 𝑖 p2𝑖 2𝑚𝑖 + 1 2! Õ 𝑖 𝑗 Õ 𝛼 𝛽 Φ𝛼 𝛽𝑖 𝑗 𝑢𝛼 𝑖𝑢 𝛽 𝑗 + 1 3! Õ 𝑖 𝑗 𝑘 Õ 𝛼 𝛽𝛾 Φ𝛼 𝛽𝛾 𝑖 𝑗 𝑘 𝑢𝛼 𝑖𝑢 𝛽 𝑗𝑢 𝛾 𝑘 , (1.22)
Here, 𝑈0 is a fit parameter for the baseline of the potential energy surface. The quadratic force constants Φ𝑖 𝑗 from the thermally-displaced atoms capture not only harmonic properties but also temperature-dependent nonharmonic effects, and are used to calculate phonon frequencies. The cubic force constants Φ𝑖 𝑗 𝑘 capture phonon-phonon interactions (PPI) that contribute to the broadening and additional shifts of phonon modes.
In practice, we perform first-principles calculations on a temperature-volume grid covering, for example, five temperatures and five volumes. We choose the five volumes linearly spaced within ±5% around the equilibrium volumes. We iterate for 3 to 5 times until the force constants were converged.
More terms in the Taylor expansion of the energy can capture the full anharmonicity at low and high T, but this is difficult to implement.
Experiments
So far, we have discussed different models of lattice dynamics and the corre-sponding computational methods. To support the theoretical work that pushes beyond the realm of phonon perturbation theory, we need experimental results. In my work, phonons were mainly measured by inelastic neutron scattering (INS) experiments[42] on powders or single crystals. The INS data were acquired with the time-of-flight Wide Angular-Range Chopper Spectrometer (ARCS) at the Spallation Neutron Source at Oak Ridge National Laboratory. Fig.1.2 shows the structure of the ARCS instrument[43].
The technical details vary for different experimental measurements. In the following chapters, I present studies of anharmonic phonons in the metals Pd and Pt, the intermetallic compound FeGe2and the polar material NaBr. These different studies address the differences between harmonic, quasiharmonic and anharmonic phonon behaviors, showing the importance of phonon anharmonicity in the thermodynamic properties. Last but not least, I present the discovery of a new phonon branch in NaBr driven by phonon-phonon interactions. Paired with an intrinsic localized mode, this new pair of features turns out to be phonon intermodulation sidebands, a totally new concept in phonon physics that parallels recent developments in laser-cavity experiments.
C h a p t e r 2
PHONON ANHARMONICITY AND COMPONENTS OF THE
ENTROPY IN PALLADIUM AND PLATINUM
2.1 Introduction
Phonon scattering has long been a subject of interest for transport properties and thermodynamics of solids. In insulators, phonon-phonon scattering is the dominant mechanism, but electron-phonon scattering is also important for metals[44–46]. The interplay between the scattering of phonons and electrons originates with the basic electronic and phonon structures of a metal, but leads to thermodynamic behavior that is challenging to understand. In previous studies of nearly-free elec-tron metals with low elecelec-tron densities of states near the Fermi level[18, 47, 48], electron-phonon interactions were weak, so phonon-phonon interactions were pri-marily responsible for the lifetime broadening of phonon energies. Transition met-als, with their much higher densities of states near the Fermi level, generally have stronger electron-phonon interactions at low temperatures[49–53], giving these met-als and alloys high critical temperatures for conventional superconductivity, for example. Electron-phonon interactions persist well above the superconducting tran-sition temperature, however, and their effects on high temperature thermodynamics can be significant[54–56]. Phonon-phonon interactions increase with more thermal phonons, and the effects of temperature on thermodynamics can involve a number of competing mechanisms beyond the harmonic or quasiharmonic approximations of phonon behavior[57].
Effects of phonon-phonon scattering can be observed by inelastic neutron scattering experiments. These anharmonic effects cause shifts and broadenings of the mea-sured phonon spectra[45, 46, 58, 59]. Unfortunately, it is usually not possible to decouple the effects of phonon-phonon interactions from effects of electron-phonon using measurements alone[46]. First-principles calculations of the scattering rate of each mechanism are useful for identifying the dominant scattering mechanism, and for better understanding the materials physics at the atomic level.
Palladium and platinum have commercial and technological importance for chemi-cal engineering, electronics, dentistry, medicine, and fashion[60–62]. Their thermal physics is interesting to compare because they lie in the same column of the periodic
table, with similar electronic and phonon band structures. Both have strong electron-phonon interactions owing to their high densities of electronic states at the Fermi level. However Pd was believed to have an electron-phonon coupling strength twice that of Pt[44]. A previous first-principles study[63] of electron-phonon interactions in Pd gave phonon linewidths comparable to the measured linewidth at 4.5 K, indi-cating that electron-phonon interactions dominate the linewidth. However, a parallel calculation for Pt is no yet available. Furthermore, the temperature dependences of electron-phonon and phonon-phonon interactions have received little study.
Here we report results from a combined experimental and theoretical study on the phonon dynamics of face-centered-cubic Pd and Pt metals. Inelastic neutron scatter-ing experiments were performed to measure the phonon density of states of Pd and Pt at temperatures from 7 K to 1576 K. The contributions of electron-phonon and phonon-phonon scattering to the phonon linewidths were calculated by perturbation theory using methods based on density functional theory (DFT). We present the measured phonon density of states of Pd and Pt at several temperatures, then show the calculated phonon linewidths from both electron-phonon and phonon-phonon interactions and their variations with temperature. We find slightly stronger electron-phonon interactions in Pd than Pt, but slightly stronger electron-phonon-electron-phonon interactions in Pt. With some care to define the different contributions to the entropy[45], we report the temperature dependences of the entropic contributions from thermal ex-pansion, phonon anharmonicity and the adiabatic electron-phonon interaction. The sum of all contributions is compared with the entropy from calorimetric measure-ments, with excellent results.
2.2 Experiment
Platinum and palladium metals of 99.9% or higher purity were formed into plates with thicknesses of 0.82 and 2.25 mm respectively, giving ratios of multiply- to singly-scattered neutrons of 9.0% and 9.6%. Neutron inelastic scattering measure-ments were performed with the time-of-flight Fermi chopper spectrometer, ARCS, at the Spallation Neutron Source at Oak Ridge National Laboratory. The incident neutron energy was 50.0 meV, and each measurement included a total of approxi-mately 6.0 C proton charge on the spallation target. For temperatures of 7 and 300 K, the sample was mounted in a closed-cycle helium refrigerator. For temperatures of 326, 576, 876, 976, 1176, 1376, and 1576 K, the sample was mounted in a high temperature, electrical resistance furnace (MICAS furnace) designed for vacuum operation in the ARCS spectrometer.
Data reduction was performed with a standard software package for the ARCS instrument[64]. The raw data of individual neutron detection events were first binned to get𝐼(𝐸 ,2𝜃), where 2𝜃is the scattering angle and𝐸 is the energy transfer, and normalized by the proton current on target. Bad detector pixels were identified and masked, and the data were corrected for detector efficiency using a measurement from vanadium. The𝐼(𝐸 ,2𝜃)were then rebinned into intensity,𝐼(𝑄 , 𝐸), whereℏ𝑄 is the momentum transfer to the sample. The𝐸 ranged from –49.75 to 50.25 meV, with a bin width of 0.5 meV. The elastic peak was removed below 3.0 meV and replaced by a function of energy determined from the inelastic scattering just past the elastic peak [65]. The phonon DOS curves were obtained after corrections for multiphonon and multiple scattering, as described previously [65]. The averaging over all 𝑄 for a given 𝐸 will eliminate effects of coherent interference between single- and two-phonon scattering.
2.3 Computational Methodology
The contribution to the phonon linewidth from phonon-phonon scattering (2Γph−ph) is[58,59] 2Γph−ph(q, 𝑗) = 𝜋ℏ 8𝑁 Õ q1,q2, 𝑗1, 𝑗2 Δ(q1+q2−q) |Φ(−q𝑗;q1𝑗1;q2𝑗2) |2 𝜔(q𝑗)𝜔(q1𝑗1)𝜔(q2𝑗2) × (𝑛1+𝑛2+1)𝛿(𝜔−𝜔1−𝜔2) +2(𝑛1−𝑛2)𝛿(𝜔+𝜔1−𝜔2) , (2.1)
where 𝑁 is the number of unit cells, ℏ is the Planck constant over 2𝜋, and 𝑛 is the Planck distribution function. Here Φ is the phonon-phonon coupling matrix element for a three-phonon process.
The contribution to the phonon linewidth from electron-phonon scattering (2Γe−ph) is 2Γe−ph(q, 𝑗) = 2𝜋𝜔q, 𝑗 Õ k,i,f |𝑔(ki,kf,q, 𝑗) |2 × 𝛿(𝐸k i−𝐸𝐹)𝛿(𝐸kf −𝐸𝐹), (2.2)
where 𝜔q, 𝑗 is the phonon frequency. The 𝑔(ki,kf,q, 𝑗) is the electron-phonon matrix element, where the phonon (q, 𝑗) scatters an electron from the initial state
kiwith energy𝐸k
ito the final statekf with energy𝐸kf.
All calculations were performed in the local density approximation with pseudopo-tentials and a plane-wave basis set. The phonon-phonon coupling matrixΦof Eqn.
Figure 2.1: Calculated phonon dispersions of (a) Pd and (b) Pt along high symmetry directions, with points from experimental data of Refs. [1,2].
2.1was calculated using the small-displacement supercell method with forces from density functional theory implemented in VASP code [66–68]. Details of imple-mentation can be found in our previous study[48]. This real-space method used 256-atom supercells, with both positive and negative displacements of 0.02 Å to cancel effects from higher-order anharmonicities. Phonon linewidths were calcu-lated with Eqn. 2.1 using a 𝑞-point grid of 24× 24×24 for the Brillouin zone integration.
For the electron-phonon linewidth 2Γe−ph at 0 K, the electron-phonon matrix ele-ment𝑔(ki,kf,q, 𝑗) was calculated using density functional perturbation theory as implemented in the QUANTUM-ESPRESSO package [69]. The first-order Hermite Gaussian smearing technique with a width of 0.022 Ryd was used to account for the presence of a Fermi surface. A 𝑘-space sampling grid of 24× 24×24 was used for the Brillouin zone integration of Eqn.2.2. Since both 2Γph−ph and 2Γe−ph are calculated with respect to the phonon energy itself, the inconsistency of using two different ab-initio computing engines is minimized by choosing the PAW-LDA pseudopotentials that yield comparable phonon and electron bandstructures.
2.4 Results and Discussion
Phonon dispersions and DOS, Kohn anomalies
Figures2.4 and2.4 show the calculated phonon dispersions along high symmetry directions at 0 K, along with previous inelastic neutron scattering measurements at 296 K for Pd[1] and 90 K for Pt[2]. The agreement is excellent. The dispersion curves of Pd and Pt have similar features, but the energies are shifted upwards for Pd compared to Pt. The shifts are about 50 to 65% of what is expected from the mass difference alone, indicative of stronger interatomic forces in Pt. This is also
0 5 10 15 20 25 30 35 0.0 0.1 0.2 0.3 0.4 0.5 0.6 0.7 0.8 0.9 1.0 N o r m a l i ze d P h o n o n D O S [ m e V -1 ] Energy [meV] 1576K 1376K 1176K 976K 876K 576K 326K 300K 7K Pd 0 5 10 15 20 25 30 35 0.0 0.1 0.2 0.3 0.4 0.5 0.6 0.7 0.8 0.9 1.0 N o r m a l i ze d P h o n o n D O S [ m e V -1 ] Energy [meV] 1576K 1376K 1176K 976K 876K 576K 326K 300K 7K Pt
Figure 2.2: Experimental phonon DOS curves of Pd (a) and Pt (b) normalized to unity. Curves are offset for clarity.
seen in Figs. 2.4 and 2.4 that show the phonon densities of states (DOS) of Pd and Pt measured in this work at temperatures from 7 K to 1576 K. With increasing temperature, features of the DOS shift downwards in energy (soften) and the features broaden in energy.
Kohn anomalies were previously reported in the phonon dispersions of both Pd and Pt along the [011] direction[1,2,70]. They are also reproduced by our calculations at qcal ' 2𝜋
𝑎 [0.31,0.31,0], slightly lower than the experimental result of qexp ' 2𝜋
𝑎 [0
.35,0.35,0]. Effects of Kohn anomalies are also seen around 8 meV in our experimental phonon DOS for both Pd and Pt at 7 K (Fig. 2.2). These features are diminished with temperature, and are no longer visible at temperatures around 900 K or so.
Measured phonon shifts and broadenings
Temperature causes the peaks in the experimental phonon DOS of both Pd and Pt to broaden, and shift to lower energy (Fig. 2.2). The thermal softening of phonons in Pd is more rapid than in Pt. This may reflect the stiffer interatomic forces in Pt. The thermal shift was approximated by rescaling all energies with a constant multiplier, 𝜂,
The thermal broadening, which was more prominent than the thermal shift, was modeled with the spectral weight function of a damped harmonic oscillator[71], centered about energy 𝐸0 with the quality factor Q. The broadening function 𝐵(Q;𝐸 , 𝐸0)is 𝐵(Q;𝐸 , 𝐸0) = 1 𝜋Q𝐸0 1 𝐸0 𝐸 − 𝐸 𝐸0 2 + 1 Q2 . (2.4)
Using Eqns. 2.3and2.4, the measured phonon DOS at temperature𝑇,𝑔
𝑇(𝐸), was fit to an convolution-like integral transform of 𝑔7K(𝐸), the rescaled phonon DOS measured at the lowest temperature of 7 K
𝑔
𝑇(𝐸) =
∫
𝐵(Q;𝐸 , 𝐸0)𝑔7K(𝜂 𝐸0)𝑑𝐸0
, 𝐵(Q;𝐸 , 𝐸0) 𝑔7K(𝜂 𝐸0) . (2.5) In principle, each phonon mode has a unique thermal shift and broadening, but it has proved useful and more practical to work with averaged values of 𝜂 and Q for the full phonon DOS, as was previously reported for Al[65]. This approach is demonstrated in Fig. 2.3a, and it is evident that the calculated broadening is too large for the low-energy peak of the DOS, and the broadening is too small for the high-energy peak. The high quality of our experimental phonon DOS for Pd and Pt made it practical to fit separately the two main features of the DOS, which originate primarily from transverse and longitudinal modes, by rewriting Eqn. 2.5as
𝑔 𝑇(𝐸) = 𝐵(Q TA; 𝐸 , 𝐸0) 𝑔TA 7 K 𝜂TA𝐸0 + 𝐵(QLA;𝐸 , 𝐸0) 𝑔LA 7 K 𝜂LA𝐸0 . (2.6) The𝑔TA 7 Kand𝑔 LA
7 K were obtained by fitting the two features of the DOS curve at 7 K to Lorentzian functions. For each temperature, the four factors {QTA, 𝜂TA; QLA, 𝜂LA}were determined through a least-squares algorithm implemented with gradient descent. A resulting fit is shown in Fig.2.3b, giving better agreement than when the transverse and longitudinal features are not differentiated as in Fig.2.3a. Figures2.4a and 2.4b show the temperature dependence of the shift and broaden-ing parameters {QTA, 𝜂TA; QLA, 𝜂LA}. The transverse modes soften faster with temperature than the longitudinal modes in both Pt and Pd, but all are linear with temperature,𝜂 ∝ 𝑇. An approximately linear temperature dependence is also seen for the broadening of the longitudinal modes as shown in Fig. 2.4b for 1/Qvs. 𝑇. However, the thermal broadening of the transverse modes is distinctly nonlinear, at least for temperatures below 1000 K.
Figure 2.3: Fittings of Pt phonon DOS at 1576 K using broadened, shifted DOS curve from 7 K. (a) Fit using Eq. 2.5. (b) Fit using Eq. 2.6with separate transverse and longitudinal components.
Electron-phonon and phonon-phonon interactions, phonon linewidths
Figures2.5 and2.6 present 2Γe−ph and 2Γph−ph for phonons along high symmetry directions for both Pd and Pt at 0 K. The phonon linewidths of Pd are in the range of 0 to 0.3 meV, similar to those of a previous study[63], and comparable to exper-imental measurements[70]. Although a substantial difference in electron-phonon scattering strength of Pd and Pt was suggested previously[44], we found that 2Γ𝑒−𝑝 is comparable for Pd and Pt.
The overall electron-phonon coupling strength can be described by a dimensionless parameter 𝜆= Õ q, 𝑗 𝜋 𝑁F𝜔2 q, 𝑗Γq, 𝑗 , (2.7)
where 𝑁F is the electron density of states at the Fermi energy, and 𝜔q, 𝑗 and Γq, 𝑗 are the phonon angular frequency and linewidth. The Fermi surface was broadened in energy with Gaussian functions as implemented in the QUANTUM-ESPRESSO package [69], so electron-phonon coupling strengths𝜆were calculated as a function of broadening,𝜎. The converged value of𝜆was𝜎 =0.25 Ryd, which is the minimal possible broadening that still achieves convergence[72]. Our calculated values of 𝜆 are 0.41 and 0.59 for Pd and Pt respectively, which are close to the empirical values[73] of 0.47 and 0.66.
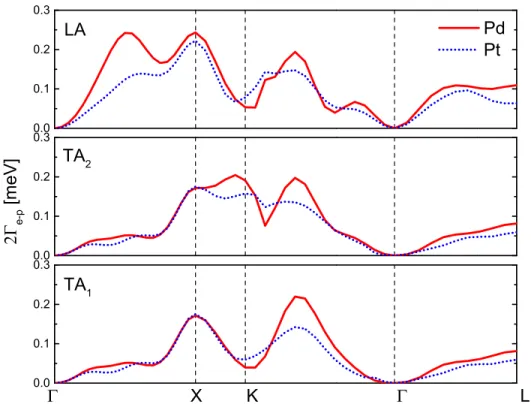
Figure2.6 shows 2Γph−ph at 0 K, which is similar for both Pd and Pt. At 0 K the TA modes are an order-of-magnitude narrower than the higher energy LA modes.
Figure 2.4: Temperature dependences from data of Fig. 2.2for (a) phonon shift 𝜂 vs. 𝑇, and (b) broadening 1/Q vs. 𝑇 for Pd and Pt.
0.0 0.1 0.2 0.3 0.0 0.1 0.2 0.3 0.0 0.1 0.2 0.3 TA 1 e -p [ m e V ] TA 2 Pd Pt X K L LA
Figure 2.5: Electron-phonon contributions to phonon linewidth of Pd (solid line) and Pt (dotted line) at 0 K.
Comparing Fig. 2.5 with Fig. 2.6, the 2Γe−ph and 2Γph−ph are comparable for LA modes, but the 2Γe−ph are much larger than the 2Γph−ph for TA modes. At 0 K, LA phonons are effectively scattered by both electrons and other phonons, whereas TA phonons are scattered mostly by electrons. Figure2.7shows the phonon linewidths at 900 K. Here the 2Γph−ph at 900 K are nearly 10 times larger than 2Γe−ph at 0 K, showing the dominance of phonon-phonon interactions at high temperatures. The trends of Fig. 2.4b are supported by Figs. 2.6 and 2.7. At low temperatures only down-conversion processes are possible, and there are more down-scattering channels for LA than TA modes. The broadening of transverse modes by up-scattering involves the annihilation of phonons, and does not occur unless enough thermal phonons are available. Figure2.4 shows that the thermal broadenings of phonons in Pd and Pt are very similar, however, consistent with experimental results from Sect. 2.4. At higher temperatures, three-phonon processes dominate the broadening. These are quite similar for Pd and Pt, consistent with their rather similar phonon dispersions shown in Fig. 2.1. Approximately, at 900 K the broadening of the longitudinal feature of the Pd phonon DOS has a breadth of 1/Q =0.09 from Fig.
0.0 0.1 0.0 0.1 0.0 0.1 0.2 0.3 TA 1 p -p [ m e V ] X K L Pd Pt LA TA 2
Figure 2.6: Phonon-phonon contributions to phonon linewidth of Pd (solid line) and Pt (dotted line) at 0 K.
is in agreement with the broadenings calculated from phonon-phonon interactions shown in Fig. 2.7.
Entropy
For Pd and Pt, the contributions to the entropy[74] are from phonons (𝑆ph), electrons (𝑆el), their interactions (𝑆ep), and the lattice configurations (𝑆cf)
𝑆tot =𝑆ph+𝑆el+𝑆ep+𝑆cf . (2.8)
The entropy from the nonadiabatic electron-phonon interaction, 𝑆na
ep, is from the mixing of the electron ground states from the nuclear motion. It dominates at low temperatures[45], but the adiabatic electron-phonon entropy𝑆ad
ep is larger at higher temperatures. This 𝑆ad
ep accounts for the thermal shifts of electron states caused by average nuclear motions[45]. The total entropy is now
𝑆tot =𝑆ph+𝑆el+𝑆na
ep +𝑆adep+𝑆cf . (2.9)
0.0 0.5 1.0 1.5 0.0 0.5 1.0 1.5 0.0 0.5 1.0 1.5 2.0 2.5 3.0 p -p [ m e V ] Pd Pt X K L LA TA 2 TA 1
Figure 2.7: Phonon-phonon contributions to phonon linewidth of Pd (solid line) and Pt (dotted line) at 900 K.
in Fig. 2.2using the expression 𝑆ph(𝑇) = 3𝑘B ∫ d𝐸 𝑔𝑇(𝐸) × 𝑛 𝑇 +1 ln 𝑛 𝑇 +1 −𝑛 𝑇ln 𝑛𝑇 , (2.10)
where 𝑔𝑇(𝐸) is the phonon DOS and 𝑛𝑇(𝐸) is the Planck distribution, both at the temperature of interest, 𝑇. When 𝑔𝑇(𝐸) is measured at the temperature of interest, Eq. 2.10is rigorously correct for the effect of harmonic and quasiharmonic vibrations on the entropy, and for the effects of electron-phonon interactions on these vibrations. It also provides a good accounting for the anharmonic shifts of vibrational frequencies[46,57,74].
For identifying the different types of non-harmonic behavior, an ideal harmonic crystal is a convenient reference. The harmonic entropy𝑆ph,His obtained by assum-ing the low-temperature phonon DOS is unaltered by temperature, so to obtain𝑆ph,H we used the DOS measured at 7 K in Eq. 2.10, with the Planck occupancy 𝑛𝑇(𝐸) for the (higher) temperatures of interest.
Δ𝑆ph,QH
Δ𝑆ph,QH(𝑇) =9
∫ 𝑇 0
𝐵𝑣 𝛼2d𝑇0, (2.11)
where𝐵is the isothermal bulk modulus, obtained from the literature[75–79],𝑣is the specific volume[80,81] and𝛼is the linear coefficient of thermal expansion[80,81], and all must be taken at the temperature𝑇0. [45] The anharmonic contribution to the phonon entropy (Δ𝑆ph,Anh) and the nonharmonic contribution (Δ𝑆ph,NH) are
Δ𝑆ph,Anh = 𝑆ph−𝑆ph,H−Δ𝑆ph,QH (2.12)
Δ𝑆ph,NH = 𝑆ph−𝑆ph,H (2.13)
Δ𝑆ph,NH = Δ𝑆ph,QH+Δ𝑆ph,Anh. (2.14)
As fermions, the entropy from the electrons is 𝑆el(𝑇) = −𝑘B ∫ d𝐸 𝑁𝑇(𝐸) × 1− 𝑓 𝑇 ln 1− 𝑓 𝑇 + 𝑓 𝑇 ln 𝑓𝑇 , (2.15) where 𝑁𝑇(𝐸) is the electronic DOS and 𝑓𝑇(𝐸) is the Fermi distribution function, both at the temperature of interest,𝑇. To separate the effect of thermal expansion, we define the “ground state” electronic entropy, 𝑆el,G(𝑇) by using the electronic DOS at𝑇0 = 0 K, 𝑁G(𝐸), but using the Fermi distribution at temperature𝑇 in Eq.
2.15. Taking dilation into account, the electronic DOS, 𝑁
𝐷(𝐸), was calculated for volumes consistent with thermal expansion. The dilation effect is separated from the ground state electronic entropy as
Δ𝑆el,D =𝑆el 𝑁 D −𝑆el 𝑁 G . (2.16)
Once Δ𝑆el,D is calculated at a low-temperature volume and a high-temperature volume, an interpolation can be performed for intermediate temperatures[82]. The adiabatic electron-phonon interaction (EPI) causes a thermal broadening of electron levels. Following Thiessen[83], we used an electronic broadening function of Lorentzian form with full-width-at-half-maximum 2Γ = 2𝜋𝜆 𝑘𝐵𝑇, and modified the electronic DOS by the convolution
𝑁
ep(𝐸) = 𝑁𝐺 (𝐸) ∗ L (2Γ = 2𝜋𝜆 𝑘𝐵𝑇). (2.17) The chemical potential changes with temperature to conserve electrons. The adia-batic EPI contribution to the change in the electronic entropy is
Δ𝑆ad el,ep =𝑆el 𝑁 ep −𝑆el 𝑁 G . (2.18)
0 200 400 600 800 1000 1200 1400 1600 0 2 4 6 8 10 ad Calorimetry S ph +S el + S el,ep (from MC) S ph +S el + S el,ep (from T =0K ) S ph S ph,H E n t r o p y [ k B / a t o m ] Temperature [K] ad Pd (a) 0 400 800 1200 1600 -0.4 -0.2 0.0 0.2 0.4 0.6 0.8 1.0 E n t r o p y [ k B / a t o m ] Temperature [K] Pd S el, G + S el, D S el, G S ph, QH S ph, NH S el, D S ph, Anh S el,ep ( ) ad S el,ep (MC) ad (b) 0 200 400 600 800 1000 1200 1400 1600 0 2 4 6 8 10 ad E n t r o p y [ k B / a t o m ] Temperature [K] ad Calorimetry S ph +S el + S el,ep (from MC) S ph +S el + S el,ep (from ) S ph S ph,H Pt (c) 0 400 800 1200 1600 -0.4 -0.2 0.0 0.2 0.4 0.6 0.8 1.0 ad S el.ep (MC) E n t r o p y [ k B / a t o m ] Temperature [K] Pt S el, G + S el, D S el, G S ph, QH S ph, NH S el, D S ph, Anh S el.ep ( ) ad (d)
Figure 2.8: The origins of entropy of (a,b) Pd and (c,d) Pt. (a,c) “Calorimetry” points are from Arblaster[3, 4], 𝑆ph are from data of Fig. 2.2 and Eq. 2.10, 𝑆ph,H was calculated with Eq. 2.10 and the measured phonon DOS at 7 K, and𝑆el is the sum of𝑆el,G andΔ𝑆el,D. (b,d) The different minor contributions make up less than 10% of the total entropy. They are from the lattice dilation influence on phonons and electrons (Δ𝑆ph,QH, Δ𝑆el,D), the anharmonicity (Δ𝑆ph,Anh) and the adiabatic EPI induced thermal broadening in electron DOS (Δ𝑆ad
el,ep). The Δ 𝑆ad
el,ep was first calculated using the electron-phonon coupling parameter,𝜆at𝑇 =0 K (Δ𝑆ad
el,ep( 𝜆)), and then rescaled by Monte Carlo calculations to give our preferredΔ𝑆ad


![Figure 3.5: Single crystal FeGe 2 along the [H00] direction. (a.)-(c.) The [H00]](https://thumb-us.123doks.com/thumbv2/123dok_us/1792677.2756375/55.918.179.731.115.590/figure-single-crystal-fege-h-direction-c-h.webp)
