CHAPTER 20
Building, Implementing, and Sustaining a Beginning Reading
Improvement Model:
Lessons Learned School by School
Deborah C. Simmons, Edward J. Kame’enui, and Roland H. Good III University of Oregon Beth A. Harn California State University-Fresno
Carl Cole and Drew Braun Bethel School District, Bethel, Oregon
INTRODUCTION
The goal of having all children read at or above grade level by the end of Grade 3 appears closer to reality than at any point in educational history. The scientific knowl-edge base of the causes and correlates of reading success and reading difficulty has never been more mature or convergent. Syntheses of reading research conducted by the National Research Council (1998) and more recently by the congressionally commis-sioned National Reading Panel (2000) provide ample and compelling evidence of the skills, experience, and knowledge children need to become successful readers in our alphabetic writing system. This research makes clear that children must develop and demonstrate proficiency in the “big ideas” (See Kame’enui & Simmons, 1998) of phonemic awareness, alphabetic understanding, and automaticity with the code. Equally important is the scientific evidence that early reading proficiency is best devel-oped through early, systematic, explicit instruction (National Reading Panel, 2000). Unfortunately, less understood is how to translate this scientific knowledge of early reading into the schools and classrooms charged with the monumental task of teach-ing all children to read.
An estimated 20% of students will encounter serious reading difficulty or reading disability (Lyon, 1997); another 20% will have reading difficulties so severe as to hin-der their enjoyment of reading (Grossen, 1997). The magnitude of reading difficulties
among America’s children compels us to rethink our system of reading education. Knowledge of effective, research-based practice is necessary but insufficient. The goal must, therefore, be to increase the probability that research-based effective practices (a) find their way into schools, (b) are implemented at sufficient levels to effect significant improvement, and (c) are sustained over time. Achieving this goal requires that we identify the essential curricular and instructional components in schools that interact with the scientific knowledge base of beginning reading to create an effective and effi-cient improvement model of reading for the full range of learners. In this chapter, we examine the intricacies of teaching beginning reading in schools and describe a pre-vention model of schoolwide beginning reading improvement.
Schools are complex educational environments that are made even more complex by social, political, economic, pedagogical, legal, cultural, demographic, and historical forces of the times. Although some of these forces are dynamic (e.g., cultural, social) and others coercive (e.g., legal, economic), they unwittingly shape the very nature and function of schools. Of course, as complex environments, schools come in all sizes, and the cultural, linguistic, and developmental variation of the student populations that occupy each of the more than 85,000 public elementary and secondary schools in the United States (National Center for Education Statistics, 1995) is also great. Given this complexity and diversity, schools have a formidable responsibility to improve the aca-demic and social outcomes of all students. This covenant is perhaps most significant to those students who are at serious academic risk and who present the biggest challenge for public schools every day of the school week. In addressing this challenge, it is imperative to identify those factors that matter most.
DO SIZE AND PLACE MATTER TO SUSTAINING EFFECTIVE EDUCATIONAL
PRACTICE IN READING?
In many cases, school size and location matter (Lee & Loeb, 2000). Not surpris-ingly, large, urban schools are likely to have more complicated administration and organization than small, rural schools. For example, the Los Angeles Unified School District (LAUSD) is the second largest school district in the country. LAUSD has 420 elementary schools, 72 middle schools, 49 high schools, an enrollment of 697,143 stu-dents who speak more than 88 different languages and dialects, a certified staff of more than 41,000, and a total district budget of $6.5 billion. In fact, the budget for the LAUSD is bigger than the state budgets of, for example, Alaska, Colorado, Delaware, Hawaii, New Hampshire, or Wyoming.
In contrast to LAUSD is Bethel School District (BSD) in Eugene, Oregon. Bethel has six elementary schools, two middle schools, and one high school, with a total enrollment of 5,246, a certified staff of 272, and a total district budget of $30 million. The numerical differences between these districts are staggering. LAUSD has 70 times more schools, 133 times more students, 150 times more certified staff, and a budget that is 220 times greaterthan BSD. In light of these manifest quantitative differences in the
admin-reasonable to pose several questions about what these differences mean for reading instruction. For example:
1. Should the classroom instructional practices and interventions be very differ-ent in design, scale, and impact for schools in large school districts compared to those in small school districts?
2. Does the extant research direct teachers and administrators to employ a very different curriculum and technology to address the instructional demands of large, urban schools in contrast to small, rural, or suburban schools?
3. Is there reliable evidence from the extant research about “scaling up” for large urban schools in ways that will lead to significant increases in students’ aca-demic achievement?
A reasonable response to each of the questions is an unequivocal “Yes.” After all, large urban schools are the gargantuans of the educational enterprise and are different in almost every aspect from small, rural schools. Yet, with respect to instructional fac-tors, there are critical features that are essential and generalizable irrespective of school size. In fact, there is substantial persuasive literature on scaling up for the implementa-tion of curriculum innovaimplementa-tions in such complex environments as LAUSD (Elmore, 1996). An organizing principle of this literature is that solving the problem of scaling up actually requires “scaling down,” which suggests that large, urban districts must behave organizationally, administratively, and pedagogically like small districts. They must recognize that the instructional variables (e.g., core curricular materials, time allo-cated for instruction) within school jurisdictions that account for differences in learn-er plearn-erformance are the sameacross districts. Though organizational factors such as dis-trict and school size clearly impact howthings operate, the common and essential ele-ments of effective schoolwide beginning reading improvement are fundamentally the same irrespective of size. We advance three principles to guide schools’ approach to improving reading achievement:
1. Although school districts vary greatly in size and resources, the principles and strategies for conceptualizing, designing, implementing, and sustaining instruc-tional and behavioral change are fundamentallythe same for all individual schools, whether they are in Los Angeles or Bethel.
2. If effective curriculum programs, instructional and assessment strategies, staff development support, and organizational structures are to be sustained for extended periods of time, they must be anchored, implemented, monitored, and supported at the school-building level where the instructional complexities unfold daily.
3. Implementing instructional, behavioral, and organizational change at the build-ing levelis a necessary, but insufficientcondition for increasing and sustaining stu-dent performance. District-level support and commitment are imperative for long-term sustainability.
The fundamental sameness about beginning reading improvement is that within every school’s jurisdiction are alterable variables (e.g., time, group size, curricular goals, instructional materials) (Carroll, 1963) that when carefully understood, strategically managed, and faithfully implemented, are capable of producing positive and sustainable results for the full range of learners.
ADDRESSING THE COMPLEXITIES OF SYMBOLS AND SCHOOLS
Schoolwide beginning reading improvement involves the integration of two com-plex systems: (a) the declarative knowledge of reading in an alphabetic writing system, and (b) the procedural knowledge of how to organize and implement what we know about reading in a complex host environment known as a school and, which is com-posed of people, practices, pedagogy, and policy. The elements of both systems and the need for strategic integration to assist schools in attaining the goal of all children reading by Grade 3 are detailed in Figure 1.
Figure 1 is simple by necessity and does not suggest the complexity of the process. Action plans for individual schools, however, are similar, regardless of school size, site, or socioeconomic status. In the following section, we (a) describe a set of tenets to guide schoolwide beginning reading improvement initiatives and (b) discuss a schoolwide improvement model of reading improvement for translating research into practice. The model and its decision-making processes draw extensively on the work in reading assessment of Kaminski and Good (1996), (e.g., Deno, 1985; L. S. Fuchs & Deno, 1991; Shinn, 1989, 1998 with respect to Curriculum-Based Measurement [CBM]), and M. R. Shinn, M. M. Shinn, Hamilton, and Clarke, this volume. These researchers’ proce-dures for identifying, grouping, problem solving, and performance monitoring are com-bined with Kame’enui and Simmons’ (1998) components of contextual interventions to build an integrated and comprehensive beginning reading improvement intervention model. This model represents an evolution of guidelines and procedures based on les-sons we’ve learned from our work with schools throughout the United States (e.g., Alabama, California, Hawaii, Minnesota, and Texas) and from three years of systemat-ic and sustained implementation in a local school distrsystemat-ict of Eugene.
SCHOOLWIDE BEGINNING READING IMPROVEMENT MODEL: TENETS AND STAGES
As emphasized earlier in the chapter, our perspective is that the individual school must be the fundamental unit of change if significant and sustainable reading improve-ment is to occur. Our model of beginning reading improveimprove-ment adheres to eight research-based tenets listed in Figure 2, on page 542.
Collectively, these eight tenets characterize a philosophy of beginning reading improvement that is proactive, intensive, and effective for the full range of learners in schools. In the sections that follow, we illustrate how each of these tenets is imple-mented in a schoolwide model and the actions and decisions involved in K-3 begin-ning reading improvement.
Stages and Levels of a Schoolwide Beginning Reading Improvement Model
The architectural blueprint of the model is framed by five successive stages (see Figure 3, on page 543). Within each stage are two distinct levels (school and individ-ual student) that operate concurrently. The premise of the two levels is that school-level decisions have consequences for individual students, for a schoolwide model that employs school-level procedures also must provide for the needs of individual students.
Two Complex Systems in a Schoolwide Beginning Reading
Improvement Model
GOAL
All children reading at grade level by Grade 3
State Reading & Language Arts Benchmarks
Two Complex System Symbolic System: Alphabetic Writing System BIG IDEAS • Phonological awareness • Alphabetic understanding • Phonological recoding • Automaticity with the code • Vocabulary knowledge • Reading comprehension
ACTIVE INGREDIENTS • Prioritized reading goals & objectives • Research-based core reading program • Focus on big ideas
• Dynamic & formative assessment • Intensified early identification & intervention • Prioritize & protected time
• Focused & sustained staff development
Organizational System: Schools as Host Environments Schoolwide Beginning Reading Improvement Model
Stage I: Conduct School Audit and Assess Student Performance K–3
Activities and actions in Stage I focus on two critical levels—the schooland the indi-vidual student. As illustrated in Figure 4, on page 544, the primary functions in Stage I are for the school to (a) conduct a thorough and instructionally focused audit of
cur-FIGURE 2
Tenets of the Schoolwide Beginning Reading Improvement Model
Schoolwide reading improvement:1. Addresses reading success and reading failure from a schoolwide systemic
perspective;
2. Embraces a prevention frameworkby intervening early and strategically during the critical window of instructional opportunity (National Research Council, 1998);
3. Recognizes and responds to the multiple contexts of reading achievement and includes carefully articulated goals, research-based programs, dynamic assessment, adequate and protected instructional time, quality instructional delivery, differentiated instruction, and effective organization and grouping (Editor, American Educator,1998);
4. Develops and promotes a comprehensive system of instruction based on a research-based core curriculum and enhancement programs (Editor,
American Educator, 1998);
5. Anchors instruction and practices to the converging knowledgebase of effec-tive reading practice (National Research Council, 1998);
6. Builds capacity in the school by using school-based teamsto customize inter-ventions to the host environment;
7. Relies on and fosters the ability of the school principalto serve as the instruc-tional leader; and
8. Uses ongoing tests sensitive to changes of student performance to identify students at risk, plan instructional groups, and modify instruction according to levels and rates of learning (Good, Simmons, & Smith, 1998).
rent reading practices, and (b) assess each student’s reading performance on a set of grade-appropriate and instructionally relevant measures.
Conduct school audit.The first goal for a school is to determine what is currently in place with respect to (a) instructional priorities, (b) reading assessment, (c) instruc-tional practices and materials, (d) time allocated to reading instruction, (e) grouping and organizational strategies, (f ) administrative involvement and decision making, and (g) professional development. To obtain this information, schools conduct an internal audit using the Planning and Evaluation Tool for Effective Schoolwide Reading Programs (Kame’enui & Simmons, 2000). The audit uses a 100-point scale divided across seven areas (e.g., goals and priorities, assessment) to quantify a school’s current state of prac-tice, and the resulting data provides a first step in identifying areas of improvement. The tool’s purpose is to quantify and develop awareness of a school’s current policies and practices in beginning reading. Figure 5, on page 545, presents items from the Administration, Organization, Communication element of the tool. As indicated, respondents complete six items in this area using a 0–2 scale (i.e., 0 = not in place, 1
STAGE 1: Conduct Schol Audit
and Assess Student Performance
• Use Planning and Evaluation Tool
(Kame'enui & Simmons, 2000).
School Level Identify Reading Priorities and Develop
Action Plan
• Review Audit • Identify strengths and areas of development based on audit summary scores
• Identify and develop three priorities • Establish Action Plan
Establish and Implement Progress-Monitoring
System
• Identity valid and reliable dynamic reading indicators • Establish absolute and relative goals • Commit resources • Determine schedule • Interpret and communicate results
Evaluate School-Level Performance
• Evaluate effectiveness three times per year • Examine components of interventions in Stage III • Make instructional adjustments • Determine whether and for whom to maintain or adjust intervention
Intensify Intervention
• Determine students who are and are not "learning enough" • Chart instructional profiles for students making little or no progress • Adjust components of interventions in Stage III Customize Progress-Monitoring System for Intensive and Strategic
Interventions
• Intensive: Monitor progress every 2 weeks • Strategic: Monitor progress every month • Benchmark: Monitor progress three times per year
Design Core Instructional Interventions
• Specify the following: Goals
Core Curriculum Program Time for Reading Instructional Grouping and Scheduling Instructional Implemen-tation Progress-Monitoring System Analyze Individual Performance and Plan Instructional Groups
• Identify students who require: Benchmark Intervention Strategic Intervention Intensive Intervention Conduct School Audit Assess Student Performance Student Level
• Use Dynamic Indicators of Basic Early Literacy Skills
(Kaminski & Good, 1998).
(CBM) (Deno, 1985; L. S. Fuchs & Deno, 1997; Shinn, 1998)
STAGE I1: Analyze School and Student Performance
STAGE III: Design Instructional
Interventions
STAGE IV: Set Goals and Monitor
Progress Formatively
STAGE V: Evaluate Intervention
Efficacy and Adjust Instruction
Customize Intensive and Strategic Interventions
• Specify the following: Goals
Core or Specialized Curriculum Materials Time for Reading Instructional Grouping and Scheduling Instruction Progress-Monitoring System
Stages and Levels of a Schoolwide Beginning Reading
Improvement Model
= partially in place, and 2 = fully in place) and document evidence to support the rat-ing. Schools work in grade-level teams or representative teams to evaluate prevailing practices and complete the seven components. The process can be unifying and instructive as teachers and administrators work together to take inventory of their schools’ reading disposition. For example, from the items illustrated, schools may real-ize that while they have a principal who is highly knowledgeable of state standards and priorities and works effectively with staff to create a coherent plan for reading instruc-tion, the coordination of instruction across Title I, special educainstruc-tion, and general edu-cation may not be complementary—and insufficient to realize schoolwide performance goals. A discussion on how to use this tool follows (see Stage II).
STAGE 1:
Conduct School Audit and Assess Student
Performance
Conduct School
Audit
• Use Planning and Evaluation Tool (Kame'enui & Simmons, 2000).
School Level
Assess Student Performace• Use Dynamic Indicators of Basic Early Literacy Skills (Kaminski & Good, 1998).
School Level
Example Items From Planning and Evaluation Tool for Effective
Schoolwide Reading Programs (Kame'enui & Simmons, 2000)
0 1 2
Not in place Partially in place Fully in place
EVALUATION CRITERIA DOCUMENTATION OF EVIDENCE
VI. Administration/Organization/Communication- Strong instructional leadership maintains a focus on high-quality instruction, organizes and allocates resources to support reading, and establishes mechanisms to communicate reading progress and practices.
2 1. Administrators are knowledgeable of state standards, priority reading skills and strategies, assessment measures and practices, and instructional programs and materials.
2 2. Administrators work with staff to create a coherent plan for reading instruction and institute practices to attain school reading goals.
2 3. Administrators maximize and protect instructional time and organize resources and personnel to support reading instruction, practice, and assessment. 2 4. Grade-level teams are established and
supported to analyze reading performance and plan instruction. 1 5. Concurrent instruction (e.g.,Title I,
special education) is coordinated with and complementary to general education reading instruction.
1 6. A communication plan for reporting and sharing student performance with teachers, parents, and other stakeholders is in place.
10/12 Total Points 80%
Percent of Implementation:
Assess student performance.As shown in Figure 4, the second goal of Stage I is to identify children who may be at risk of reading failure and to determine the need for early intervention (Kaminski & Good, 1996). All children, kindergarten through Grade 3, are screened on 1-minute measures that correspond to the big ideas in begin-ning reading: (a) phonological awareness, (b) alphabetic understanding, and (c) auto-maticity with the code (Simmons & Kame’enui, 1998). The tests are used as screening measures; Dynamic Indicators of Basic Early Literacy Skills (DIBELS) and Reading CBM (R-CBM) are not intended to tell us everything about each student’s reading skills. Rather, they serve as valid and reliable indicatorsor predictors of skills highly asso-ciated with later reading achievement.
In the area of early literacy, DIBELS (Kaminski & Good, 1998) are used to iden-tify children whose performance differs significantly from their same-age peers and who may need early intervention in kindergarten and first grade. DIBELS measures align with the big ideas in early reading and include (a) Letter-Naming Fluency, (b) Onset-Recognition Fluency, (c) Phonemic-Segmentation Fluency, and (c) Nonsense-Word Fluency. Once students are able to read words in connected text (typically mid-first grade) 1-minute measures of oral reading fluency from R-CBM passages are used as indicators of general reading achievement. R-CBM is then used as the primary indi-cator of reading progress through Grade 5. These measures provide “vital signs of growth in basic skills comparable to the vital signs of health used by physicians” (Deno, 1992, p. 6). In addition, they provide fast and efficient indications of a student’s read-ing well-beread-ing on skills that are essential to success in the general education curricu-lum (Kaminski & Good, 1998). For more information on these practices, see M. R. Shinn, M. M. Shinn, Hamilton, and Clarke, this volume.
A word of caution: reliance on vital-sign indicators does not dismiss or discount the importance of other reading dimensions such as vocabulary and comprehension. Rather, 1-minute R-CBM, fluency-based measures allow educators to identify poten-tial prereading and reading difficulties early and to monitor progress more frequently. The purpose of assessment in Stage I is not to label, but to identify children at risk of reading difficulty to provide levels of intervention necessary to alter and increase early learning trajectories. Figure 6 indicates the administration schedule of early literacy and reading tests by grade. We refer to these tests as big-idea indicators as they align with the critical skills necessary for early reading success (i.e., big ideas).
In Stage I, a centralized system for managing student performance data is estab-lished and maintained at the school level to enable timely and informed decisions. In the project described in this school, schoolwide data were collected three times per year, entered into a Web-based template, and forwarded to the Institute for the Development of Educational Achievement (IDEA), College of Education, University of Oregon.
Stage II: Analyze School and Student Performance
Identify reading priorities and develop an action plan. In Stage II, schools review results of the schoolwide audit conducted in Stage I (See Figure 7, on page 548). Audit results quantify what is in place,what is partially in place,and what is not in placealong a range of critical dimensions (e.g., reading goals and objectives, assessment tools and strategies, instructional programs). The audit provides information at three levels: (a) an overall score based on a total of 100 points that indicates relative ranking toward a standard, (b) dimension scores (i.e., curriculum programs and instruction, professional development), and (c) individual item scores (e.g., Is there a commonly articulated and understood set of goals in reading for each grade?). After reviewing and completing all items in the audit, schools summarize their overall level of reading implementation quantitatively (see Figure 8, on page 549), prioritize areas of improvement, and devel-op an “Action Plan” to direct schoolwide beginning reading improvement.
As the percentile scores reflect, this school rated itself high in administration (88%) and goals (81%) and low in differentiated grouping (55%) and assessment (59%). The resulting priorities from this audit included (a) using assessment data to establish flexi-ble grouping to provide differentiated instruction, (b) allowing time to share this infor-mation and inservice all teachers regarding the assessment system and instructional
Administration Schedule of Early Literacy
and Reading Tests by Grade
Fall Winter Spring
Kindergarten
Letter-Naming Fluency ◆ ◆ ◆
Onset Recognition ◆ ◆
Phonemic-Segmentation Fluency ◆ ◆
Nonsense-Word Reading Fluency ◆ ◆
First Grade
Letter-Naming Fluency ◆
Phonemic-Segmentation Fluency ◆ ◆ ◆
Nonsense-Word Reading Fluency ◆ ◆ ◆
R-CBM ◆ ◆
Second–Fifth Grades
implications, and (c) implementing assessments three times per year to assess progress and determine instructional needs. These priorities are documented in an action plan (see Figure 9, on page 550) and are used to guide reading improvement for the aca-demic year.
Analyze individual performance and plan instructional groups. In Stage II, schools examine each learner’s performance on critical prereading and reading skills to deter-mine the scope and scale of instructional needs. Grade-level summary data are provid-ed in the form of histograms that indicate the number of children by level of profi-ciency on a specific measure (See Figure 10, on page 551). For example, in the fall of 2000, all children enrolled in first grade were administered the Nonsense-Word
STAGE II:
Analyze School and Student Performace
School Level Identify Reading Priorities and Develop
Action Plan • Review Audit • Identify strengths and areas of development based on audit summary scores
• Identify and develop three priorities
• Establish Action Plan
Student Level Analyze Individual
Performance and Plan Instructional
Groups • Identify students who require:
Benchmark Intervention
Strategic Intervention
Intensive Intervention
Fluency measure. Results indicated that eight children identified fewer than four cor-rect letter sounds in one minute and six identified more than 75. The distribution of performance on this measure informs the school about the magnitude of need and how to allocate resources. In this school, 25% of students identified less than 20 correct let-ter sounds, 22% identified 20–39, and 52% identified 40 or more correct letlet-ter sounds. The benchmark goal is 40 correct letter sounds by January. From this information, schools determine children who have already reached benchmark goals and those who have not (See Figure 11, on page 552). Moreover, grade-level teams and teachers can identify children who are at risk of not meeting benchmark goals. Benchmark goals indicate a level of performance on a particular measure that (a) establishes a solid, flu-ent proficiency on the particular measure, and (b) forecasts future performance on higher-order skills. For example, reading 60 correct words per minute in the spring of first grade strongly correlates with reading 90 correct words per minute in the spring of second grade (Good, Simmons, & Kame’enui, in press).
Individual student performance on DIBELS and R-CBM is compared to the benchmark goals to identify children who may be at risk of reading disability or delay (see Figure 8). Performance expectations are derived from research-based criterion lev-els of performance (Hasbrouck & Tindal, 1992; Good et al., 2000), and students are identified as potentially at risk relative to how other students in their school and dis-trict perform and in comparison to research-based criteria. For example, a child enter-ing first grade scorenter-ing less than 20 letter sounds per minute on the Nonsense-Word Fluency measure may be at risk, as the target criterion for the mid-first-grade
bench-Summary of Level of Reading Improvement from School Audit
Element Score Percent
I. Goals/Objectives/Priorities 11.5/14 81.4%
II. Assessment 11.8/20 59.0%
III. Instructional Practices and Materials 15.0/22 68.0%
IV. Instructional Time 8.0/14 57.0%
V. Differentiated Instruction/Grouping 5.5/10 55.0%
VI. Administration/Organization/Communication 10.6/12 88.0%
VII. Professional Development 4.5/8 56.0%
mark of 40 correct letter sounds per minute. Likewise, a student exiting second grade reading 40 words correct per minute may be identified for more intensive intervention and follow-up, as the end-of-year target for correct words per minute is 90.
Teachers perform “instructional triage” on students by using a process developed by M. R. Shinn, M. M. Shinn, Hamilton, and Clarke (this volume) and elaborated by Kaminski and Good (1998), by assessing student performance on the critical reading skills using DIBELS, and by assimilating other information from teachers. Children
FIGURE 9
An Action Plan of Instructional Priorities
Planning and Evaluation Tool for Effective Schoolwide Beginning Reading Programs
Prioritization and Action
Based on the previous listing of areas to improve, rank order three areas. The areas may include one element or items from several different elements.
Priority #1 Action Plan Who & When?
To use our assessment data Teachers review data to Classroom teachers
to establish flexible grouping establish instructional 8/9/01
to provide differentiated groups.
instruction to benchmark, strategic, and intensive groups.
Priority #2 Action Plan Who & When?
To allow time to share this Review information in first Classroom teachers
information and inservice with faculty meeting. 8/9/01
others regarding DIBELS and the reading big ideas.To continuously analyze our program and make changes as needed.
Priority #3 Action Plan Who & When?
To implement assessment Develop schedule and Classroom, resource, and
timelines and measurements to assessment team. grade-level teachers
determine instructional needs 8/9/01
and interventions.
Support Team Members and Schedule
who are at greatest risk are identified from those at less risk. To operationalize this process, we use the following criteria.
Students benefiting from benchmark reading intervention. In the following discus-sion, we assign a label to the type of intervention that is indicated by a student’s per-formance rather than assign a label to the learner. This may appear to be a subtle shift, but it is one we consider important. Our focus is to use the student’s performance on indicator measures to help design the type of intervention necessary to change learn-ing outcomes. Therefore we focus on the factor of intervention opposed to learner. Further, we use the term intervention,rather than instruction program or practice,as inter-ventionconsists of multiple components. These dimensions will be discussed further in Stage III.
Benchmark interventions are those core instructional practices and programs pro-vided in general education that position students to meet or exceed commonly agreed-upon reading goals and priorities. By design, they are intended to ensure that the majority of students in a given school achieve adequate (i.e., benchmark) levels of per-formance. The elements of benchmark intervention vary across schools, but the
com-Fr
equency
Correct Letter Sounds per Minute
0-4 5-9 10-14 15-19 20-24 25-29 30-34 35-39 40-44 45-49 50-54 55-59 60-64 65-69 70-74 75+ 9 8 7 6 5 4 3 2 1 0
Distribution of Nonsense-Word Fluency in the Fall
First-Grade Fall 2000 DIBELS Nonsense-Word
Fluency Histogram Summary
Legend
Solid black = identified 40 or more correct letter sounds in 1 minute (75%) Diagonal = identified 20–39 correct letter sounds in 1 minute (20%)
mon factor is that the majority of students derive adequate benefit to pass school-, dis-trict-, and state-level assessments of reading. As a general rule, we suggest that bench-mark intervention should prepare 80% or more of the students in a school to read at grade level. The 80% criterion is a logical cut off point. If more than 20% of the stu-dents fail to reach benchmarks at designated intervals (see Figure 11), then the core reading program and practices are not adequately addressing the schools’ needs. Recent studies synthesized by Lyon and colleagues at the National Institute of Child, Health, and Human Development indicate that 20% of children in schools will experience sig-nificant reading difficulties.
Students who attain benchmark performance on critical literacy skills (e.g., 35–45 phonemes per minute by the end of kindergarten) are on track to attain later reading outcomes (Good, Simmons, & Kame’enui, 2001). Students receiving benchmark intervention are monitored three times a year in the fall, winter, and spring to evalu-ate growth toward common goals. If a child’s performance does not maintain adequevalu-ate growth toward benchmark goals, appropriate interventions are provided.
Students in need of strategic intervention.Students who receive strategic interven-tion typically are not acquiring and demonstrating foundainterven-tional reading skills at high levels and rates of success. They may begin moderately below their average-achieving peers in critical areas or may start at adequate levels but fail to progress over time. For
MEASURE
Onset-Recognition Fluency Measure (OnRF)
Phonemic-Segmentation Fluency Measure (PSF)
Nonsense-Word Fluency Measure (NWF)
R-CBM Measure (ORF)
• 25–35 Correct Onsets per minute by winter of Kindergarten
• 35–45 Correct Phonemes per minute by spring of Kindergarten
• 40–50 Correct Letter Sounds per minute by winter of First Grade
• 40–60 Words read correct per minute by end of First Grade
• 90 Words read correct per minute by end of Second Grade
BENCHMARK GOAL
FIGURE 11
Dynamic Indicators of Basic Early Literacy Skills and R-CBM
Benchmark Levels and Goals
ficiently and fluently, we recommend more explicit, systematic, and timely intervention and monitoring. In general, strategic intervention is for students who need more than what is typical of the general education curriculum and instruction. Of the 20% of chil-dren who are likely to have difficulty in beginning reading, we reason that approxi-mately 15% of students may need additional, strategic instructional support. Students in the strategic intervention group may exhibit mixed performance patterns; that is, some may perform well on one measure but low on another, while others may perform mod-erately below average on a range of measures. In some schools, students requiring strategic intervention may constitute a large number of students, while in other schools they may be a small number. The goal of strategic intervention is to identify children who are potentially at risk of serious reading difficulty and to provide sufficient system-atic instruction so that their performance rapidly reaches and exceeds benchmark lev-els. Shinn (1997) recommends frequent monitoring for students who are failing to demonstrate adequate rates of progress. In the schoolwide beginning reading improve-ment model, we monitor students who are receiving strategic intervention monthly.
Students in need of intensive intervention.Intensive intervention is recommended for students who are significantly at risk based on their extremely low performance on one or more big idea performance indicators. The greater the number of measures and the lower the performance across measures, the greater the risk. The need for imme-diate intensive intervention is even more urgent when students display continued low rates of progress even when provided with strategic intervention. With effective benchmark and strategic instruction in place in the primary grades, it is estimated that approximately 5% of students would need intensive intervention (Torgesen, 2000).
Much like children with serious medical conditions, children in need of intensive intervention in reading are in acute need of early identification, the most effective interventions available, and frequent monitoring to ensure that their reading perform-ance does not remain seriously low. Educators must intervene with a sense of urgency and with the most effective tools and strategies available. Moreover, the intensive interventions should be short-term and temporary, rather like an intensive care unit in a hospital.
As illustrated in Stage II, Student Level of the model, children with similar per-formance profiles are grouped according to intervention needs (i.e., benchmark, strate-gic, intensive). The purpose of grouping is to ensure that children are given ample opportunities to receive instruction and increased opportunities to respond at their instructional level. As a rule, the number of students who receive intensive instruction should be smaller than that in either the strategic or benchmark groups. Groups should be dynamic rather than static. Strategic, ongoing, and frequent monitoring of per-formance when students are grouped homogeneously has been demonstrated to con-tribute to overall achievement effects (Guitiérrez & Slavin, 1992) and is critical for adjusting groups in response to instruction and assessment.
As a rule, approximately 20% of students in the fall would require strategic or intensive intervention. Identifying 20% of children in the fall for intensive intervention
may constitute “overidentification;” however, the consequences of providing extra intervention are considered far less risky than a wait-and-see position that withholds opportunity for additional instruction until students are seriously discrepant com-pared to their peers. In addition to the 20% criterion, we employ research-based guidelines on selected measures that predict success. For instance, a first-grade stu-dent who can istu-dentify 40 or more letter sounds correctly on the Nonsense-Word Fluency measure in the winter is highly likely to read 40 correct words per minute on R-CBM (Good et al., 2000) in the Spring of Grade 1. The correlational nature of the early indicator measures allows schools and teachers to make high-probability predictions of success and risk. For example, a mid-year first-grader who identifies only nine correct letter sounds on the Nonsense-Word Fluency measure is at serious risk of not attaining the end-of-year first-grade R-CBM benchmark of 40–60 cor-rect words per minute and would warrant more instructional support than students performing in the benchmark range.
Stage III: Design Instructional Interventions
In Figure 12, we summarize the critical features of Stage III, which is arguably the most critical and complex component of the schoolwide beginning reading model— intervention. Of foremost importance to the model is the instructional fit of the instructional reading intervention within the school’s host environment; therefore, schools invest serious and sustained energy at this stage. Stage III decisions focus on (a) specifying and implementing core instructional interventions, and (b) customizing strategic and intensive interventions for students who are not benefiting adequately from the core curriculum or are at high risk of reading difficulty.
Designing a core instructional intervention.Two principles guide decisions in Stage III: (a) intervention is bigger than program alone, and (b) identification and implemen-tation of a research-based core intervention provides the highest probability of success in the host environment. A common misperception is that once a commercial program is identified and adopted, the reading intervention is “determined.” Commercial pro-grams constitute a critical component of a schoolwide model, but as documented in the Stage III figure, core intervention encompasses far more than the adoption of an instructional program. The entire core intervention begins with the review and adop-tion of grade-level goals. These goals may be state- or locally mandated standards; in some cases they may be school-determined. Specifying grade-level expectations for all students is fundamental to core intervention and provides the basis for other decisions. For example, if a kindergarten content standard is that students will be able to segment 2- and 3-phoneme words, core instructional programs should address this standard ade-quately and fully. Moreover, standards should specify the level of performance students should achieve. An example first-grade performance goal is for students to be able to read orally 60 correct words per minute on grade-level text. Goals specification is a crit-ical dimension of the schoolwide inventory conducted in Stage I and many schools in which we work allocate significant time specifying expectations for K–3 reading.
Once goals are specified and the magnitude of the school’s need is evaluated in relation to the goals, school teams design the optimal school-level intervention that fits their host environment. School teams consist ideally of all professionals in the school who are responsible for reading achievement, including the general education teach-ers, school administrators, school psychologist, speech and language specialist, Title I or reading support teacher, etc. In Stage III, school teams essentially move beyond the
STAGE III:
Design Instructional Interventions
School Level Design Core Instructional
Interventions
Goals
Core Curriculum Program
Time for Reading Instructional Grouping and Scheduling Instructional Implementation Progress-Monitoring System Student Level Customize Intensive and Strategic Interventions • Specify the following:
Goals
Core or Specialized Curriculum Materials Time for Reading Instructional Grouping and Scheduling Instruction
question of “What does reading instruction look like in our school?” to “What should reading instruction look like in our school?” Critical decisions such as time allocations for reading, instructional grouping procedures, who delivers instruction, where it is delivered, and so on are considered and specified explicitly. Schools invest consider-able time designing this intervention map, document their plan of action in writing, and review this map at critical decision points throughout the year. In essence, the out-come of Stage III is an intervention map that specifies what core instruction looks like for students in Kindergarten, Grade 1, Grade 2, and beyond.
Central to the instructional map is the selection of the research-based core program that fits the host environment. From the outset, schools are encouraged to review com-mercial programs that have solid, scientific evidence and that produce strong and posi-tive results for children when implemented faithfully. A short list of research-based com-mercial programs is currently available (Editor, American Educator,1998); however, the new generation of programs holds great promise because of their attention to research-based findings documented in NICHD research, summarized and synthesized by the National Research Council (1998) and the National Reading Panel (2000), and man-dated by populous states such as California and Texas. From the short list, we encour-age schools to (a) review scope and sequences; (b) conduct a discrepancy analysis with school-adopted expectations; (c) compare programs within the list to identify the one that aligns most closely with the needs of students, the instructional priorities, and the school environment; (d) pilot the program with faithful implementation; (e) monitor student performance; and (f ) evaluate performance toward key early reading outcomes. Through our work in schools and districts, we find that a site-based reading coor-dinator (e.g., a Title I teacher, school psychologist) greatly facilitates schoolwide begin-ning reading improvement coupled with strong administrative leadership. The site coordinator and principal work with collaborative grade-level intervention teams in initial intervention development and adaptation. Throughout the intervention process, collaborative intervention teams construct or customize the intervention from a menu of validated options. It is this “fit” within the school that further distinguishes this model from more traditional reading models.
Customize intensive and strategic interventions. With the core reading interven-tion specified, the next set of decisions involves how to customizeinterventions for stu-dents who are not benefiting adequately from that core intervention or for children who enter with high levels of risk on the big idea early reading indicators. Questions such as “Can the core commercial program be used, but in smaller groups?” “Could the student benefit from more instruction either through a longer period or an extra period of instruction, but with a different program?”, “Could preteaching critical les-son components such as new phonic elements or story vocabulary result in adequate progress?” These questions relate to customization. In some cases, students may require a specialized and intensified program that focuses prominently on the big ideas of early reading. In other cases, customization may involve adding a second reading period. The degree and kind of customization must be determined at the school level and gov-erned by school resources of time, programs, and personnel.
The efficacy of the schoolwide model hinges largely on the ability of a school to document whether students are learning enough (Carnine, 1997). In Stage IV, schools assess allstudents’ reading progress and evaluate eachstudent’s progress. A school’s abil-ity to document and act upon individual student performance dynamically, reliably, and formatively distinguishes it from the majority of schools in the traditional educational system. Although norm-referenced, commercially published measures of reading achievement do an adequate job of documenting groups of learners’ performance at a given point in time (e.g., spring), the purpose of these measures was never to inform instruction for individual learners or to monitor performance. Moreover, these meas-ures were never intended to monitor progress frequently and formatively over time.
Establish and implement a progress-monitoring system. A key feature of the Schoolwide Beginning Reading Improvement Model is the essential linkage between assessment and instruction. This linkage is predicated on a simple but vital proposition: We have valid, reliable, and efficient (one minute to administer) measures that, when given early in a child’s beginning literacy experience, serve as powerful predictors of later reading success or risk. Moreover, when these measures are administered fre-quently, they can document student progress or lack thereof. For any school seriously interested in serving allstudents, which requires serving eachand every student, this is a powerful proposition with practical implications.
An effective and efficient progress-monitoring system consists of five critical fac-tors: (a) reliable and valid measures with alternate forms that can be administered fre-quently, (b) established absoluteand relativelearning targets to evaluate whether the rate and slope of learning is adequate, (c) resources and personnel to prepare assessment materials, administer and score measures, and enter data, (d) a confirmed and com-monly agreed-upon schedule for collecting data, and (e) an efficient process for ana-lyzing, summarizing, and reporting data to constituencies and for using student per-formance to inform instruction. Integrating assessment and instruction is not a novel concept and has long been a signature of effective special education (Deno, 1992; D. Fuchs & L. Fuchs, 1994). What is innovative and effective about this process is that the technology can be applied at the school level in time to catch children before they fail (Torgesen, 1998). At the present time, Good, Kame’enui, and Simmons are building and refining a website through which schools enter DIBELS and R-CBM data and immediately receive reports of student performance at classroom, school, and district levels. Information from these reports includes the percentage of students at bench-mark, strategic, and intensive intervention levels and class profiles delineating the indi-vidual performance of each learner across measures.
In summary, in the upper box of Figure 13, on page 558, we highlight the school-wide system of monitoring student performance as an essential element in a beginning reading improvement model. In the bottom box of Figure 13, we outline how to use the formative assessment system for students who are at greater risk of reading failure than the majority of children in the school.
STAGE IV:
Set Goals and Monitor Progress Formatively
School Level Establish and Implement
Progress-Monitoring System
Student Level Customizing Progress-Monitoring System for Intensive and Strategic
Interventions • Identify valid and reliable dynamic indicators
• Establish absolute and relative goals • Commit resources • Determine schedule • Interpret and communicate results • Intensive: Monitor progress every two weeks
• Strategic: Monitor progress every month
• Benchmark: Monitor progress three times per year
FIGURE 13
Customize progress-monitoring system for intensive and strategic interventions. For children who are at risk of reading difficulty or for those whose reading performance is not within “acceptable” zones of proficiency, we recommend frequent progress monitoring. For frequent progress monitoring, we use the same measures used in schoolwide assessment. The primary difference between the schoolwide and cus-tomized progress monitoring is the frequency of administration and analysis. At the school level, all students are assessed quarterly on critical performance indicators to
determine their progress toward goals. Students in strategic interventions are moni-tored monthly, and students in intensive interventions are monimoni-tored more frequently (e.g., every 2–4 weeks). Learning targets are established, and each learner’s perform-ance on target goals is documented. Figure 14 depicts one kindergarten student’s monthly progress on the Phonemic-Segmentation Fluency measure. The student whose performance is reflected in Figure 14 was identified at the beginning of the year as needing intensive intervention based on his performance on Onset-Recognition and Letter-Naming Fluency measures. As indicated in the graph, he met the end-of-kindergarten goal of 35–45 phonemes per minute in March and continued to make progress through April. Through monthly monitoring, teachers can evaluate each child’s progress precisely and adjust instruction as needed.
Stage V: Evaluate Intervention Efficacy and Adjust Instruction
In the final stage of the model (see Figure 15, on page 560), the effects of inter-vention conducted in Stages I–IV are evaluated directly and interinter-ventions are
intensi-Kindergarten Example of Progress Monitoring
on the Phonemic Segmentation Fluency Measure
Jan. Scores Week 1 Week 2 Week 3 1/24 21 1/28 33 2/15 21 3/28 40 3/10 39 4/13 43 Week 4 50 40 30 20 10 Feb. Scores March Scores April Scores May Scores June Scores Goal Line
STAGE V:
Evaluate Intervention Efficacy and Adjust
Instruction School Level Evaluate School-Level Performance Student Level Intensify Intervention • Evaluate effectiveness three times per year
• Examine components of interventions in Stage III
• Make instructional adjustments
• Determine whether and for whom to maintain or adjust intervention
• Determine students who are and are not "learning enough"
• Chart instructional profiles for students making little or no progress
• Adjust components of interventions in Stage III
FIGURE 15
fied as indicated by student performance. In this stage, schools address the following questions: “Are the instructional interventions working for the full range of learners? Are students learning enough? What instructional adjustments must be made to enhance beginning reading performance?”
Evaluate school-level performance. In the Bethel Reading Project, each school evaluates the performance of all students three times a year on big idea early reading
indicators. Progress is reviewed at each grade to evaluate the efficacy of the instruc-tional intervention in the respective grades. Classroom teachers also receive summaries of students in their classrooms to identify specific children who need more effective instructional interventions.
The histogram in Figure 16 displays the performance distribution of all first-grade students in one school (N = 54) on the Nonsense-Word Fluency measure. The target goal for first graders in January is 40–50 letter sounds per minute. As illustrated, 75% of students in the school met the target. Another 20% demonstrated emerging letter-sound knowledge (i.e., 20–39 letter letter-sounds per minute). Five percent, or three chil-dren in this school, identified fewer than 20 correct letter sounds in one minute and are considered to have marked difficulty with the alphabetic principle.
This indicates that a relatively small percentage of children (i.e., cross-hatched bars) are at serious risk of difficulty as judged by students’ ability to identify letter sounds. This is important information because it allows schools to reallocate instructional resources for children who have not made sufficient progress. The information from this performance period may also be compared to performance in the previous assess-ment period to determine how much growth has occurred. In essence, by comparing performance over time, schools can address the question, “Is the instructional inter-vention working?”
Legend
Solid black = identified 40 or more correct letter sounds in 1 minute (75%) Diagonal = identified 20–39 correct letter sounds in 1 minute (20%)
Cross hatch = identified fewer than 20 correct letter sounds correct in 1 minute (5%)
Fr
equency
Correct Letter Sounds per Minute
0-4 5-9 10-14 15-19 20-24 25-29 30-34 35-39 40-44 45-49 50-54 55-59 60-64 65-69 70-74 75+ 12 10 8 6 4 2 0
Distribution of Nonsense-Word Fluency in January
The Number of Correct Letter Sounds Correctly Identified by 54
First-Grade Students in January 2000
TABLE 1
Percent of Students in Each Level Based on
Nonsense-Word Fluency (N = 387)
At Risk—Deficit Emerging Established
(0-19) (20-39) (40-60)
September 1999 47% 36% 17%
January 2000 5% 20% 75%
Table 1 compares the performance of first-grade students in the entire district (i.e., six elementary schools) on the Nonsense-Word Fluency measure at two points in the year: September 1999 and January 2000. Comparative performance data indicate that students in the district made significant progress, since 75% attained the benchmark. Moreover, the findings inform schools and teachers to concentrate energy on the 25% of students who did not reach the benchmark of 40 letter sounds per minute.
When a large number of students fail to reach target benchmarks (e.g., 40-50 let-ter sounds per minute), school teams return to the instructional inlet-terventions planned in Stage III. First, school teams evaluate critical dimensions of the core intervention to identify the source of the difficulty. First-order questions include:
1. Was the intervention implemented as planned or prescribed?
2. Did students receive the amount of intervention specified for the time allocated? 3. Were there high rates of absence for many learners?
4. Did the size of instructional groups permit adequate opportunities for students to respond?
5. Was progress monitored frequently to evaluate learning?
If a review of the core dimensions of intervention indicates one or more devia-tions from what was planned, procedures should be put in place to increase the fideli-ty of the planned intervention. If analysis reveals that all intervention components were implemented as planned, school teams should review the list of alterable variables to determine what and how much to intensify. If performance trends are positive and adequate for all but a few children, then large-scale intervention adjustment is not war-ranted. Only if many students are failing to progress adequately is full review and adjustment of the core intervention components necessary.
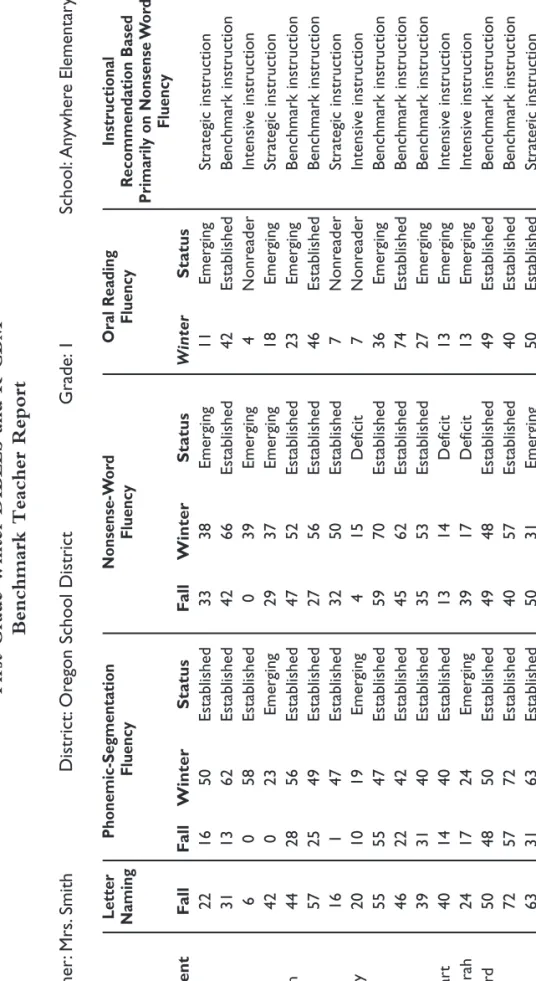
data at each of the three assessment periods to determine whether specific children have an inadequate rate of reading growth to attain targeted proficiency goals on crit-ical measures of early reading. From this information, teachers assess each child’s per-formance on multiple measures to determine whether the student’s perper-formance is deficit, emerging, or established. Instructional recommendations are then based on the number of essential skills on which the student is experiencing difficulty and the mag-nitude of their educational need. The following winter report for a first-grade class illustrates a mid-first-grade goal of 35–45 phonemes per minute on the Phonemic Segmentation Fluency measures and 40–50 letter sounds per minute on the Nonsense-Word Fluency measure (see Figure 17, on page 564). In this class, nine children (e.g., John, Gillian, Beth) are benefiting from benchmark instruction. Benchmark instruc-tion is the instrucinstruc-tional recommendainstruc-tion for all children who score (a) 35 or more on phonemic segmentation, and(b) 40 or more on nonsense word fluency. Four children require strategic intervention. The criteria for recommending strategic intervention are (a) 11–34 on phonemic segmentation fluency, or (b) 20–39 on nonsense word fluen-cy, or (c) less than 10 words correct per minute on oral reading fluenfluen-cy, or (d) any combination of a, b, or c. Four children are recommended for intensive intervention. The criteria for intensive intervention include scores of (a) less than 10 on phonemic segmentation fluency, (b) less than 20 on nonsense word fluency, or (c) less than 10 on oral reading fluency.
In addition to evaluating absolute performance (i.e., where a student scores at one point in time), it is important to evaluate growth and the nature of performance dif-ferences. For example, although Suzy and Mandy both are recommended for intensive intervention, Suzy made enormous growth on phonemic segmentation from fall (0) to winter (58) and on nonsense words (from 0 to 39). Yet, she read only four words cor-rect in the Oral Reading Fluency passage; hence, the reason for the intensive inter-vention recommendation. Mandy, however, grew from 10 to 19 on phonemic seg-mentation and from 4 to 15 on nonsense words. Though the intervention recom-mendation is for both children, the type of instructional focus would differ.
As indicated in the Student Level component of Figure 17, determining how to intensify intervention is essential in Stage V of the Schoolwide Beginning Reading Improvement Model. A first-order question for students identified as being in need of intensive and strategic intervention is, “Have these children been enrolled in the school and received instruction?” or are there obvious attendance and enrollment issues that shed light on their low progress or performance levels? Answers to these questions may explain the differential progress rates of children such as Suzy and Mandy. If low per-formance cannot be explained by attendance factors, teachers then review and intensi-fy levels of intervention to increase the probability that students will attain adequate lev-els of proficiency. Common adjustments used to intensify intervention are (a) increas-ing the amount of time by providincreas-ing double doses of readincreas-ing instruction, (b) reducincreas-ing the size of the instructional group, (c) using a more specialized and explicit instruction-al program, and (d) monitoring progress more frequently. A table of instruction-alterable compo-nents and specific adjustments is shown in Table 2, on page 565.
FIGURE 17
First-Grade Winter DIBELS and R-CBM
Benchmark Teacher Report
Teacher :M rs. Smith District: Or eg on School District Grade: 1 School: An ywher e Elementar y Letter Phonemic-Segmentation Nonsense-W or d O ral Reading Instructional Naming Fluency Fluency Fluency Recommendation Based Primaril y on Nonsense W o rd Fluency Student F all F all Winter Status F all Winter Status Winter Status Andy 22 16 50 Established 33 38 Emerging 11 Emerging Strategic instruction John 31 13 62 Established 42 66 Established 42 Established Benchmark instruction Suzy 6 0 58 Established 0 3 9 Emerging 4 N onr eader Intensiv e instruction Erin 42 0 2 3 Emerging 29 37 Emerging 18 Emerging Strategic instruction Gillian 44 28 56 Established 47 52 Established 23 Emerging Benchmark instruction Beth 5 7 2 5 4 9 Established 27 56 Established 46 Established Benchmark instruction Jo e 1 6 1 47 Established 32 50 Established 7 N onr eader Strategic instruction Mandy 20 10 19 Emerging 4 1 5 Deficit 7 N onr eader Intensiv e instruction Sarah 55 55 47 Established 59 70 Established 36 Emerging Benchmark instruction Fr ed 46 22 42 Established 45 62 Established 74 Established Benchmark instruction Neil 3 9 3 1 4 0 Established 35 53 Established 27 Emerging Benchmark instruction Ste war t 4 0 1 4 4 0 Established 13 14 Deficit 13 Emerging Intensiv e instruction Deborah 24 17 24 Emerging 39 17 Deficit 13 Emerging Intensiv e instruction Edwar d 5 0 4 8 5 0 Established 49 48 Established 49 Established Benchmark instruction Katie 72 57 72 Established 40 57 Established 40 Established Benchmark instruction Josh 63 31 63 Established 50 31 Emerging 50 Established Strategic instruction Da ve 36 24 50 Established 35 49 Established 27 Emerging Benchmark instruction
Summary of the Schoolwide Beginning Reading Improvement Model
Schoolwide beginning reading improvement involves the integration of two com-plex systems: (a) the scientific knowledge base of reading in an alphabetic writing sys-tem and (b) the design and implementation of the knowledge base in a complex host environment (i.e., schools) comprising people, practices, pedagogy, and policy.
We advocate that the processesand procedures required to effect and sustain reading improvement are fundamentally the same whether the school is in Los Angeles, California or Eugene, Oregon. The translation of the knowledge base of beginning reading from the research literature to practice in schools is built on and nurtured by
Alterable Components and Specific Adjustments
Used to Intensify Intervention
Alterable
Components Specific Adjustments
Opportunities Develop plan Ensure instruction Increase number Increase teacher- Add another to Learn to increase is provided of opportunities directed instructional
attendance daily for learner instruction period
to respond (double dose)
Program Efficacy Preteach Use materials Supplement Replace current Implement components that are extensions program with core program specially of core program of the core appropriate designed
materials program
Program Model lesson Monitor Provide coaching Provide additional Implementation delivery implementation and ongoing staff development
frequently support
Grouping for Check to see Reduce number Provide Change Instruction students are of students individual instructor
appropriately in group instruction placed
Coordination Clarify Establish Provide Establish a of Instruction instructional concurrent complementary communication
priorities reading periods/ reading system across sessions instruction instructors
across reading periods
a common set of components operationalized in the five stages of the Schoolwide Beginning Reading Improvement Model.
Carnine, D. (1997). Instructional design in mathematics for students with learning dis-abilities.Journal of Learning Disabilities, 30,130-131.
Carroll, J. B. (1963). A model of school learning. Teachers College Record, 64,723-733. Deno, S. L. (1985). Curriculum-based measurement: The emerging alternative.
Exceptional Children, 52,219-232.
Deno, S. L. (1992). The nature and development of curriculum-based measurement. Preventing School Failure, 36(2), 5-10.
Editor. (1998). Every child reading: An action plan of the Learning First Alliance. American Educator, Spring/Summer,52-63.
Elmore, R. F. (1996). Getting to scale with good educational practice. Harvard Educational Review, 66(1), 1-26.
Fuchs, L. S., & Deno, S. L. (1991). Paradigmatic distinctions between instructionally relevant measurement models. Exceptional Children, 58,232-243.
Fuchs, D., & Fuchs, L. (1994). Classwide curriculum-based measurement: Helping general educators meet the challenge of student diversity. Exceptional Children, 60, 518-537.
Good, R., Kaminski, R., Shinn, M., Bratten, J., Shinn, M., & Laimon, D. (2000). Technical adequacy and decision making utility of DIBELS (Tech. Rep. No. 7). Eugene, OR: University of Oregon, Early Childhood Research Institute.
Good, R. H., III, Simmons, D. C., & Kame’enui, E. J. (2001). The importance and decision-making utility of a continuum of fluency-based indicators of foundation-al reading skills for third-grade high-stakes outcomes. Scientific Studies of Reading, 5(3), 257-288.
Good, R., III, Simmons, D. C., & Smith, S. (1998). Effective academic interventions in the United States: Evaluating and enhancing the acquisition of early reading skills. School Psychology Review, 27(1), 45-56.
Grossen, B. (1997). Thirty years of research: What we now know about how children learn to read.Santa Cruz, CA: The Center for the Future of Teaching and Learning. Guitiérrez, R., & Slavin, R. E. (1992). Achievement effects of the nongraded
ele-mentary school: A best evidence synthesis. Review of Educational Research, 62(4), 333-376.
Hasbrouck, J. E., & Tindal, G. (1992). Curriculum-based oral reading fluency norms for students in grades 2 through 5. Teaching Exceptional Children, 24,41-44. Kame’enui, E. J., & Simmons, D. C. (1998). Beyond effective practice to schools as
host environments: Building and sustaining a school-wide intervention model in reading. OSSC Bulletin, 41(3), 3-24.
Kame’enui, E. J., & Simmons, D. C. (2000). Planning and evaluation tool for effective schoolwide reading programs.Unpublished manuscript.
Kaminski, R. A., & Good, R. H., III. (1996). Toward a technology for assessing basic early literacy skills. School Psychology Review, 25(2), 215-227.
Kaminski, R. A., & Good, R. H., III. (1998). Assessing early literacy skills in a prob-lem-solving model: Dynamic indicators of basic early literacy skills. In M. R. Shinn (Ed.), Advanced applications of curriculum-based measurement. New York: Guilford.
Lee, V. E., & Loeb, S. (2000). School size in Chicago elementary schools: Effects on teachers’ attitudes and students’ achievement. American Educational Research Journal, 37(1), 3-31.
Lyon, G. R. (1997, July 10). How do children learn to read?: Statement before the Committee on Education and the Workforce, U.S. House of Representatives, Washington, DC. National Center for Education Statistics. (1995). Digest of Education Statistics.Washington
DC: U.S. Dept. of Education.
National Reading Panel. (2000). Teaching children to read: An evidence-based assessment of the scientific research literature on reading and its implications for reading instruction [on-line]. Available Internet: www.nichd.nih.gov/publications/nrp/smallbook.htm.
National Research Council. (1998). Preventing reading difficulties in young children. Washington, DC: National Academy Press.
Shinn, M. R. (Ed.). (1989). Curriculum-based measurement: Assessing special chil-dren. New York: Guilford Press.
Shinn, M. (1997). Instructional decision making using curriculum-based measurement. Un-published workshop materials.
Shinn, M. R. (1998). Advanced applications of curriculum-based measurement. New York: Guilford Press.
Simmons, D. C., & Kame’enui, E. J. (Eds.). (1998). What reading research tells us about children with diverse learning needs: Bases and basics.Mahwah, NJ: Lawrence Erlbaum Associates.
Torgesen, J. K. (1998). Catch them before they fall: Identification and assessment to prevent reading failure in young children. American Educator, 22(1), 32-39. Torgesen, J. K. (2000). Individual differences in response to early interventions in
reading: The lingering problem of treatment resisters. Learning Disabilities Research & Practice, 15(1), 55-64.
AUTHORS’ NOTE
The contents of this document were developed in part for the Office of Special Education Programs, U.S. Department of Education under Contract Number H324M980127. This material does not necessarily represent the policy of the U.S. Department of Education, nor is the material necessarily endorsed by the federal gov-ernment.
We gratefully acknowledge and warmly thank the dedicated, hard-working, and enthusiastic Bethel District elementary administrators, teachers, and educational assis-tants who so expertly implemented the Schoolwide Beginning Reading Model. We extend a special thanks to the reading coordinators for their leadership and
persever-in the Bethel School District. We further acknowledge the contributions of Katie Tate in her expert preparation of this manuscript.