Lessons Learned in the Southern Region after
the First Year of Implementation of the New
Commodity Programs
Jody Campiche and Wes Harris
The development of the commodity programs in the 2008 Farm Bill involved the origination of two complex revenue support initiatives. The two new programs, Average Crop Revenue Election (ACRE) and Supplemental Revenue Assurance (SURE), expanded the risk man-agement tool kit of agricultural producers. The SURE program is a permanent disaster as-sistance program, whereas the ACRE program is a revenue-based commodity program offered as an alternative to the price-based Direct and Counter-Cyclical Program (DCP) created in the 2002 Farm Bill. For the 2009 signup, only 7.7% of eligible U.S. farms enrolled in the ACRE program. In the southern region, three states had no farms electing ACRE and four others had less than 50. Excluding Oklahoma, less than 1% of all farms in 13 southern states made the ACRE election.
Key Words: farm policy, Food Conservation and Energy Act of 2008, Average Crop Revenue Election Program (ACRE), Supplemental Revenue Assistance (SURE)
JEL Classification: Q1
The development of the commodity programs in theFood, Conservation, and Energy Act of 2008
(2008 Farm Bill) was a process that involved the origination of two very complex revenue support initiatives. The two new programs, Average Crop Revenue Election (ACRE) and Supplemental Revenue Assurance (SURE), expanded the risk management tool kit of agricultural producers. The SURE program is a permanent disaster as-sistance program, whereas the ACRE program is a revenue-based commodity program offered as an alternative to the price-based Direct and Counter-Cyclical Program (DCP) created in the
2002 Farm Bill. Producers enrolled in the DCP program are eligible for direct payments, counter-cyclical payments (CCPs), and marketing loans.
Producers with established base acreage and direct payment yields receive an annual direct payment for covered commodities. The annual direct payment rate is a fixed rate established in each Farm Bill. Base acreage and payment yields are based on historical parameters spec-ified in the 2002 Farm Bill. Provisions are unchanged in the 2008 Farm Bill for most commodities except for newly designated oil-seed crops or newly eligible pulse crops. Base acreage and payment yields for pulse crops and other oilseeds are established in the same man-ner used for other oilseeds in the 2002 Farm Bill. Under the CCP program, producers with historical enrolled production are eligible to re-ceive payments on covered commodities. CCP payments are only made when the effective price
Jody Campiche is assistant professor, Department of Agricultural Economics, Oklahoma State University, Stillwater, OK. Wes Harris is special projects coordi-nator, Public Policy, Center for Agribusiness and Economic Development, The University of Georgia, Athens, GA.
is less than the fixed target price (as established in each Farm Bill). The effective price is equal to the direct payment rate for the commodity plus the higher of the national loan rate or the na-tional average price for the crop year. To cal-culate the CCP payment rate, the effective price is subtracted from the target price. The CCP payment is equal to the product of the CCP payment rate, payment acres (85% times base acres), and the historical CCP payment yield. The key element of the CCP program is the target price. Target prices set in 2002 for corn, soybeans, and wheat were established to meet cost of production practices within budget pa-rameters. However, the next 7 years manifested higher marketing year average prices for most covered commodities as well as increasing costs of production relating to energy and technology. Higher prices precluded counter-cyclical pay-ments for many commodities.
Marketing assistance loans (MAL) are avail-able to producers for covered commodities. The loans provide temporary financing to producers at harvest to meet cash flow needs without selling their commodities at low market prices at harvest. Producers can store the commodity and sell at a later time. The loans are non-recourse in nature because the producer has the option to forfeit the commodity as collateral and pay off the loan by delivering the pledged collateral to the Commodity Credit Corpora-tion (CCC). However, two opCorpora-tions are built into the program to discourage forfeiture. Under certain circumstances, a producer may repay less than the original loan principal and accrued interest and other charges, thus receiving a ‘‘marketing gain’’ equivalent to the waived portion of the debt. The second option for producers is to receive a loan deficiency pay-ment (LDP) paypay-ment. Instead of securing a commodity loan from the CCC, producers can receive marketing loan benefits (LDP) when the market price is lower than the loan rate. Marketing loan and LDP provisions make for-feiture of loan collateral to CCC less likely, which reduces the government’s exposure to storage and liquidating expenses. Perhaps more importantly from the management of a price risk standpoint, the program generally creates enhanced net value for the crop.
Development of a New Revenue Commodity Support Program
Although the DCP program does provide sup-port to producers, many were concerned that the program does not provide an adequate safety net for farm income. Therefore, alternative pro-grams were designed to provide a better safety net by covering both price and yield risk. The development of a revenue-based commodity support program to replace the price-based commodity program was widely debated. The ACRE program was eventually chosen after various alternatives were proposed. The pro-posals ranged in the level of coverage of sys-tematic risks in the target and actual revenue calculations as well as the use of a fixed or moving target price. Several authors analyzed the various revenue proposals during the 2008 Farm Bill debate (Coble and Miller, 2006; Aakre, Haugen, and Swenson, 2007a, 2007b, 2007c; Dicks and Anderson, 2007; Higgins et al., 2007; Olson and DalSanto, 2007; Richardson and Outlaw, 2007; Thomas, Coble, and Miller, 2007; Zulauf, 2007, 2008).
Babcock and Hart of Iowa State University submitted a proposal for a county revenue guarantee (Babcock and Hart, 2005). The Bab-cock and Hart proposal was used as the basis for the proposal by the National Corn Grower’s Association (NCGA). The target revenue cal-culation was based on the county trend yield and a moving target price (National Corn Grower’s Association, 2006). Farm Bureau also submitted a proposal that fell in between the two proposals by the Administration and the NCGA. The tar-get revenue calculation was based on the aver-age state yield and the same fixed target price used in the Administration’s proposal. Zulauf of Ohio State University submitted a proposal for a revenue plan, called the Integrated Farm Revenue Proposal, based on U.S. yields and a moving target price (Zuluaf, 2004). The Zulauf revenue proposal was also integrated with crop insurance and was later adopted by the Ameri-can Farmland Trust.
The Administration submitted a proposal for a national revenue CCP that was not in-tegrated with crop insurance. The target reve-nue was based on a fixed target price (2002
Farm Bill target price minus direct payment rate) and the average U.S. yield (United States Department of Agriculture, 2007). Under this plan, producers would only receive a payment if the national revenue for a given year was below the target national revenue. The House adopted the Administration’s proposal in its language, but Midwest and Plains commodity groups were not supportive.
The Senate ultimately trumped the House provisions for a national revenue support pro-gram and instead chose a state-level revenue support program designated as the ACRE pro-gram, which combined several key aspects from the various proposals. However, the Senate also decided to provide producers with the option to enroll individual farms in the old DCP program or the new ACRE program. The ACRE program was designed to protect against declines in market revenue involving state- and farm-level revenue changes from guaranteed revenue levels based on national prices, state-planted yields, and farm-planted yields. ACRE is a one-time irrevocable election beginning in 2009. Once a producer enrolls in the ACRE program, he or she must remain in the program for the re-mainder of the Farm Bill. However, producers can choose to enroll in any year between 2009 and 2012. Once a producer enrolls in the ACRE program, direct payments are reduced by 20%, marketing loans are reduced by 30%, and CCP payments are no longer available.
ACRE is a production program that applies only to planted acres of a crop on the ACRE farm. ACRE enrollment occurs by individual farm number and payments are made on 83.3% of planted acres up to the number of base acres on the farm. A double trigger mechanism exists to determine payment eligibility. The first trig-ger is met if the actual state revenue for the crop year is less than the state ACRE program guar-antee. A second trigger is achieved when the actual farm revenue for the crop is less than the farm ACRE benchmark revenue for the crop. ACRE payments will be made to producers only if both triggers are met. The state and farm benchmark revenue calculations use a moving average rather than a fixed target price.
The state benchmark revenue guarantee is calculated by taking 90% of the benchmark
state yield (Olympic average state yield for the five most recent crop years) times the ACRE guarantee price (average of the national aver-age market price for the most recent 2 crop years). Separate ACRE benchmark revenues are calculated for states with a substantial amount of irrigated and nonirrigated acreage. The actual state revenue for a crop year is equal to the actual state yield for each planted acre (total production divided by the number of acres planted) times the national average mar-ket price for the crop year (greater of the na-tional average marketing year price or 70% of the MAL loan rate).
The state benchmark revenue guarantee for a crop year cannot increase or decrease by more than 10% from the guarantee for the preceding crop year for the 2010, which creates a ‘‘cup and cap’’ parameter. This feature greatly in-creases the possibility that farmers will receive substantial support when market prices are high. The probability exists because support is determined by variations in prices and yields and can be triggered when market prices are above DCP target prices, whereas farmers still receive most of the direct payments that they previously received.
The farm benchmark revenue guarantee is equal to the farm benchmark yield (Olympic average farm yield per planted acre for the five most recent crop years) times the ACRE guar-antee price plus the per-acre crop insurance premium. Actual farm revenue is calculated by multiplying the actual farm yield times the na-tional average market price. The farm benchmark and actual revenues are only used to determine eligibility for an ACRE payment and are not actually used in the calculation of an ACRE payment. However, as a result of the incor-poration of the insurance premium in the farm benchmark revenue calculation, producers could elect a higher level of insurance coverage to increase their farm revenue guarantee. Al-though this does not affect the actual payment, it could help a farm qualify for an ACRE payment. The ACRE payment is only based on the state benchmark revenue and the actual state revenue. ACRE payments are equal to the minimum of the state benchmark revenue guarantee minus actual state revenue or 25% of
the state benchmark revenue guarantee. ACRE payments are only paid on 83.3% of planted acres for the 2009–2011 crop years and 85% of planted acres for the 2012 crop year.
Supplemental Revenue Assistance Program The House chose not to incorporate a permanent disaster program into its version of the Farm Bill, much to the dismay of a few commodity advocacies. However, the Senate supported a permanent disaster program and chose to fund the new program with customs fees. SURE provides crop disaster assistance payments to eligible producers on farms in disaster counties that have incurred crop production losses, crop quality losses, or both during the crop year. Crop disaster payments to eligible producers will be made at 60% of the difference between the di-saster assistance program guarantee and the total farm revenue for the farm. The disaster assis-tance program guarantee for a crop used to calculate the payments for a farm may not be greater than 90% of the sum of the expected revenue for each of the crops for the farm.
A disaster county is a county included in the geographic area covered by a qualifying natural disaster declaration and any county contiguous to a declared county. However, a farm could also qualify if a crop year production loss re-lating to weather is greater than 50% of the normal production of the farm. Assuming the farm meets one of these criteria, an additional requirement is that the actual production yield (APH) for at least one crop of economic sig-nificance (generates greater than 5% of the total crop revenue for the operation) must be reduced by at least 10% from the APH yield as a result of the disaster.
The SURE program provides whole-farm disaster assistance. The calculation of SURE benefits is inclusive of the entire farming op-eration regardless of the location of farms. A key requirement of the SURE program is that producers must have private crop insurance or NAP coverage on all mechanically harvested crops of economic significance. Producers growing multiple crops during the crop year could suffer a loss on one crop but not be eli-gible for a SURE payment as a result of the
revenue of the other crops on the farm. Large SURE payments will only occur where signif-icant disaster assistance program guarantees are high as a result of high indemnity elections and primarily monocultural crop systems. Ad-ditionally, SURE is a revenue-based program unlike the old ad hoc disaster programs that were specifically yield-based and priced by the crop insurance price for the year of claim. SURE will account for decreases in price from the crop insurance price levels as it calculates farm revenues from Market Year Average pri-ces. The program is designed to provide ‘‘gap’’ assistance for crop insurance indemnities and ACRE revenue shortfalls. If ACRE is not elected, the old DCP program will provide some price support through CCP.
SURE program guarantees are based on crop insurance coverage elected by the producer. High-value crops such as cotton, peanuts, and rice are on premium scales that can be un-attractive to producers to attain greater than a 65–70% indemnity as a cost of production decision. Production histories for many areas in the South have remained depressed, which fur-ther diminishes the crop insurance indemnity and the SURE guarantee. The new USDA Risk Management Agency’s enterprise unit option increases subsidies, which decreases premiums for one crop on all farms within a county. If a producer is willing to accept greater risk of localized crop failures combined into the whole farming operation, he or she can increase his or her indemnity level for lower premiums. In fact, this approach parallels the SURE program in its whole farm approach. Again, higher indemnities create stronger program guarantees elevating the gap coverage offered by SURE. This strategy will vary year to year based on cropping de-cisions and insurable price elections.
2009 Commodity Program Participation
Average Crop Revenue Election
ACRE participation was not equal across all cropping systems. The new commodity pro-grams do not provide the same opportunities for all producers, especially those with cotton, rice, and peanut acreage. The comparative higher
production and base value of these crops cre-ates greater participation costs for the producer if ACRE is elected. Interest in the ACRE pro-gram was somewhat diminished for all three crops as a result of the impact of the 20% re-duction in direct payments, loss of CCPs, and 30% reduction in loan rates.
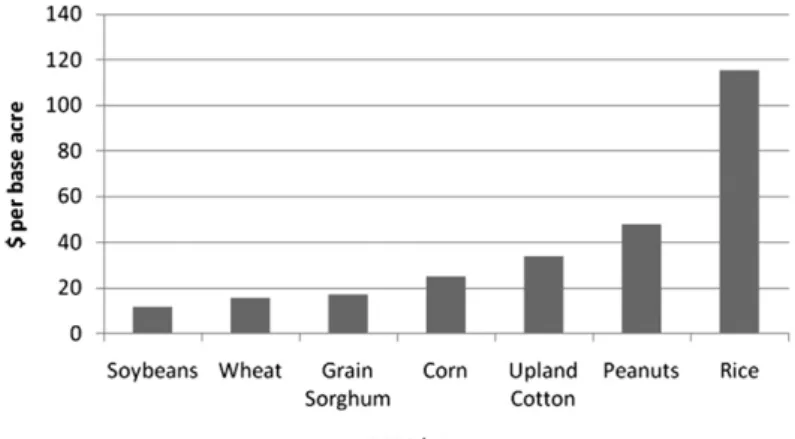
As shown in Figure 1, direct payments per base acre are higher for cotton, peanuts, and rice producers. The target prices for cotton and peanuts established in the 2002 Farm Bill and maintained in the 2008 legislation have his-torically been significantly higher than average marketing year prices. Under the DCP pro-gram, lower prices create higher CCPs. Since 2002, peanut producers have received CCPs every year except 2009–2010 and cotton every year except for 2008–2009 and 2009–2010 (Figure 2). Conversely, soybeans and wheat have never gained a CCP and corn and grain sorghum only received a CCP payment in 2 of the 8 years. Rice producers received a CCP payment in only 3 of those years. The loss of potential LDPs or marketing loan gains (MLGs) could be more of an issue for cotton and peanut producers.
Corn, wheat, and soybean producers and their respective representative organizations lobbied strongly for the ACRE program to create moving target prices rather than maintain the low target values in the DCP program. If prices for corn, wheat, soybeans, and rice remain above DCP target values, no CCPs will be realized. High market year prices in 2007 and 2008 established strong ACRE guarantee prices for 2009.
Although the 2009 marketing year average prices are not final, it appears that a substantial 2009 ACRE payment could be realized for wheat producers in some southern states. Because the ACRE price guarantee is the average of the previous two crop year prices, an ACRE payment could still be triggered in diminishing price years. Conversely, low market year prices for cotton and peanuts establish low program guarantees that diminish revenue coverage from ACRE.
The complexity of farm structure in the South reduced the incentive for many pro-ducers to elect ACRE for the 2009 crop year. Operations tend to have many farm numbers that involve a multitude of owners. Each farm has its own base structure, which affects the amount of direct and CCP payments regardless of what is or is not planted. The producer is faced with a myriad of decisions and solicita-tion of acceptance from all farm owners. The double signup requisite for an ACRE contract (election and enrollment) further exacerbates the activity required. The apprehension of in-creased lease cost exposure from involving landlords in a new program is a major concern. These circumstances framed the lack of par-ticipation of producers in the ACRE program for 2009. Oklahoma’s participation in ACRE was driven by the disaster in wheat production combined with the drop in prices. Because of the late signup date, producers were able to ascertain that a significant ACRE payment would be forthcoming because yields and projected prices for 2009 were well known. Figure 3 shows the
percent of farms enrolled in ACRE by state. Oklahoma had the second largest percent of farms enrolled in the ACRE program (only fol-lowing Washington, which has a much lower total ACRE farm count). Before the signup deadline, Oklahoma, Washington, and Texas producers had information suggesting that a high 2009 ACRE payment was likely.
However, few Texas producers enrolled in the ACRE program. In Texas, many wheat producers have a significant amount of cotton base acreage, which discouraged enrollment in the ACRE program. In addition, differences in farm structure in Texas may have prevented many from enrolling in ACRE. According to recent estimates by Barnaby (2010a), Texas, Oklahoma, Arkansas, North Carolina, Virginia, and Kentucky are the top six states most likely to receive a 2009 ACRE payment on wheat
based on estimates of the 2009–2010 marketing year average wheat price.
Although the majority of producers in Oklahoma enrolled wheat acres in the ACRE program, a significant amount of corn and soy-bean acres were also enrolled across the country. As shown in Figure 4, enrolled wheat acreage followed behind corn and soybean acreage. Wheat producers did have a definite advantage at signup because the wheat marketing year ends earlier than the corn and soybean marketing years and producers had more information on the August 14 deadline. However, because corn, wheat, and soybean producers were at the fore-front of the push for the new ACRE program, it is not surprising that these three crops domi-nated ACRE enrollment. Producers of these crops know that the probability of a CCP pay-ment for the 2009–2012 crop years is low and Figure 2. Counter-Cyclical Payments by Crop Year
some were willing to forfeit 20% of their di-rect payment for a potential ACRE payment. According to Barnaby (2010a), some southern producers of these crops are likely to receive a 2009 ACRE payment as well.
If prices for cotton and peanuts improve in the future, ACRE could become a viable risk man-agement tool for more southern producers. Oth-erwise, the election of a revenue-based pro-tection program that has a high participation cost with low potential coverage will continue to be avoided. Irrigated ACRE benchmark revenues for corn, cotton, and peanuts exist in many southern states. Because yields are generally stable as a result of available water, ACRE sup-port for irrigated crops will be relevant to price alone, further discouraging program election.
Supplemental Revenue Assurance
Producers accustomed to the historical ad hoc disaster programs found the new SURE crop assistance program to be quite complex and potentially weaker in its support capacity in comparison. Ad hoc programs were yield-based crop and farm-specific in their calculation of assistance with no consideration of any revenues. The new permanent program is diametrically opposite of the old programs. Southern crop di-versity historically has shown that one or two crops may fail but other crops may not. One crop with adequate production can pull the total farm revenue up to a level that precludes a significant SURE payment or could even result in no SURE payment. In addition, cropping systems using
cotton, peanuts, and rice are often more diver-sified than corn, soybeans, or wheat farms and typically will not enjoy the level of coverage SURE provides for more mono- or bicultural systems. The old ad hoc program would allow for segregation of crops and farms and a suc-cessful crop would not be included.
Producers with irrigated acreage discovered that crop revenues that are combined into the total farm revenue will create dramatic de-creases in SURE coverage. In fact, many sce-narios indicate that irrigated production could negate any SURE benefit. Many southern pro-ducers use irrigation extensively, which will impact their risk mitigation as opposed to the ad hoc programs in which irrigated farms were normally exclusive of dryland farms.
Producers were able to start applying for 2008 SURE payments in January 2010. As a result of favorable 2008 growing conditions in much of the South, 2008 SURE payments are not expected to be large in much of the southern region. However, for the 2009 crop year, poor weather conditions in the South combined with low prices could lead to significant SURE payments for many producers.
Interaction between Commodity Programs
The interaction between the commodity pro-grams will become more apparent at the end of 2010. Because both ACRE and SURE pay-ments are delayed for an entire crop year, actual results cannot be tabulated at this point. The 2009 ACRE payments will not be issued until at least October 2010 and the application pro-cess for 2009 SURE payments will occur after November 2010. However, the potential in-teractions between the programs are discussed subsequently.
SURE is implicitly impacted by ACRE, DCP, and crop insurance. The farm revenue calculation includes 15% of all direct payments and the total of all CCPs and ACRE payments. Election of ACRE reduces the direct payment for each individual farm by 20%, thereby re-ducing the effect of the direct payment calcu-lation to the farm revenue. High-value base crops such as cotton, peanuts, and rice should gain a small benefit from this feature. ACRE Figure 4. 2009 U.S. Average Crop Revenue
payments will reduce SURE payments by 60% of the total ACRE payment. In some cases, producers receiving a large ACRE payment will not be eligible for a SURE payment. However, some producers will hit the payment limit on ACRE payments and will be eligible for additional SURE payments.
CCPs influence SURE considerably, par-ticularly because they are decoupled from production unlike ACRE. Market-based plant-ing decisions usually dictate the selection of crops with higher price opportunities, which leads producers to plant other crops when cot-ton, rice, or peanut prices are down. If the price of a high-value crop remains depressed for the market year, a large CCP will be earned on the base irrespective of the crops planted. This scenario will diminish the SURE coverage on the crops actually planted although the base crop receiving the CCP benefit may not have been planted. Conversely, should the price on the commodity not planted rise and the CCP decline or disappear, the producer will gain a greater gap indemnity from SURE.
The ACRE program only covers eligible crops that are planted (or considered planted). This coupling of production to program support creates a balancing of exposure by the gov-ernment in declining revenue situations. SURE is triggered by a loss of primarily yield and ACRE payments can be initiated by a loss in price and/or yield. The relationship between ACRE and SURE is quite complex because a multitude of variables are in play. If ACRE is triggered mainly by yield loss on a state basis, then a corresponding increase in price for the commodity may occur. This would affect the SURE calculation on revenue for crop pro-duction and may drop the ACRE payment as well as creating a double negative. However, if the price moves enough to reduce ACRE pay-ments substantially, a gain in the gap coverage by SURE could be realized.
Many have expressed concerns that ACRE revenue payments overlap with crop revenue insurance. However, Zulauf, Schnitkey, and Langemeier (2010) note that although pro-ducers can receive both an ACRE payment and a crop insurance indemnity on the same crop, the programs do not necessarily cover the same
portion of the risk distribution. In their analysis, the overlap between ACRE payments and in-surance indemnities was less than 5%. How-ever, they found a much larger overlap between ACRE and SURE payments. Barnaby (2010b) also discusses potential overlap between com-modity programs and various methods to re-duce the overlap.
Summary
Producers in the southern region of the U.S. were confronted with a choice between the old DCP program and a new coupled revenue pro-gram in the 2008 Farm Bill. As discussed, many factors shaped their decisions to remain with the traditional policy. The signup data for the DCP and ACRE programs certainly illuminate the profound differential in target prices vs. actual market prices as incorporated by each support program. Three states had no farms electing ACRE and four others had less than 50. Ex-cluding Oklahoma, less than 1% of all farms in 13 southern states made the ACRE election. The policy implication reinforces the attested reality that farm bills and farm policy are regional in scope and nature. It is unfortunate that the ACRE program could not have been more in-clusive in its context, but the same could be said for the DCP program in the 2002 statute that seemingly favored southern crops.
The tool kit for managing risk was aug-mented by the Supplemental Agricultural Di-saster Assistance program and specifically the SURE component for crops. Southern farmers discovered that the differences between the traditional ad hoc programs and the new ‘‘per-manent’’ program are quite considerable. Cor-relating crop insurance indemnity levels with associated costs to production with the SURE gap indemnity will be a challenge for agricul-tural educators throughout the life of the bill. The higher-value cropping systems in the south and the diversity of those systems may very well preclude the value of the additional tool.
The U.S. Congress (2008) has put into play five systems of farm support for the American Farmer: the Marketing Assistance Loan, Crop Insurance, DCP, ACRE, and SURE. The intent of the legislated policy is to provide broad-based
revenue assistance to producers. Unfortunately, the unintended consequence of expanding pro-grams is the complexity that follows. Given the choice between analyzing all the variables and using new directions in their operations and maintaining their proven course, most growers will choose the latter. It is incumbent on our educational system to assist them in graduating above that level to fully realize all the benefits of the programs that can mitigate their risk. References
Aakre, D.G., R.H. Haugen, and A.L. Swenson. Staff Paper AAE 07003. Department of Agri-business and Applied Economics, North Dakota State. Fargo, ND: Base Revenue Protection and Revenue Countercyclical Programs for Corn in North Dakota, March 2007a.
———.Staff Paper AAE 07005. Department of Agribusiness and Applied Economics, North Dakota State University. Fargo, ND: Base Revenue Protection and Revenue Countercy-clical Programs for Soybeans in North Dakota, March 2007b.
———.Staff Paper AAE 07004. Department of Agribusiness and Applied Economics, North Dakota State University. Fargo, ND: Base Revenue Protection and Revenue Countercy-clical Programs for Spring Wheat in North Dakota, March 2007c.
Babcock, B., and C. Hart. ‘‘County Revenue Counter-Cyclical Proposal.’’ Iowa Ag Review 11(Spring 2005):1–3, 11.
Barnaby, G.A. ‘‘Expected ACRE Payments Up-date with NASS Yields.’’ Ag Manager, Kansas State University Research and Extension, March 2010a. Internet site: www.agmanager. info/crops/insurance/risk_mgt/rm_pdf10/AB_ MYA_Wt-price_04-08-10.pdf (Accessed April 29, 2010).
———. ‘‘Should Basic Underwriting Rules be Applied to ACRE and SURE?’’Journal of Ag-ricultural and Applied Economics42,3(2010b): 517–35.
Coble, K.H., and J.C. Miller. ‘‘The Devil’s in the Details: Why a Revenue-Based Farm Program is No Panacea.’’ Mississippi State University, Department of Agricultural Economics, Staff Report 2006-01, March 2006.
Dicks, M., and K. Anderson. ‘‘Analysis of Reve-nue Assurance Proposals.’’Western Economics Forum6(Fall 2007):15–27.
Higgins, L.M., J.W. Richardson, J.L. Outlaw, and J.M. Raulston. ‘‘Farm Level Impacts of a Rev-enue Based Policy in the 2007 Farm Bill.’’ Selected paper prepared for presentation at the American Agricultural Economics Association Annual Meeting, Portland, OR, July 29–August 1, 2007.
National Corn Grower’s Association. ‘‘National Farm Security Act Proposal.’’ Farm Policy Is-sue Brief, Washington, DC, December 2006. Olson, K.D., and M.R. DalSanto. ‘‘Alternative
Farm Bills: Impacts on Minnesota Farms.’’ Staff Paper P07-5. St. Paul, MN: Department of Applied Economics, University of Minnesota, April 2007.
Richardson, J.W., and J.L. Outlaw. AFPC Briefing Paper 07-3. Agricultural and Food Policy Center, Texas A&M University. Col-lege Station, TX: Comparison of the Counter Cyclical Payment Program to a Proposed Counter Cyclical Revenue Program, March 2007.
Thomas, S.E., K.H. Coble, and J.C. Miller. ‘‘The Effect of Changing Government Subsidy Pro-grams: An Analysis of Revenue at the Farm Level.’’ Selected paper prepared for pre-sentation at the Southern Agricultural Eco-nomics Association Annual Meeting, Mobile, AL, February 4–6, 2007.
United States Department of Agriculture. U.S. Department of Agriculture’s 2007 Farm Bill Proposals. Washington, DC: Report to Con-gress, 2007.
U.S. Congress (2008). Food, Conservation, and Energy Act of 2008. H.R. 2419.
Zulauf, C. ‘‘Integrated Farm Revenue Proposal (IFRP).’’ Basic Concepts in Ohio’s Country Journal (December 2004):12.
———. ‘‘Comparison of Revenue Proposals.’’ Ohio State University, Department of Agricul-tural, Environmental, and Developmental Economics, May 2007.
———. ‘‘Comparison: Average Crop Revenue’s (ACRE) Variable Payment Program with Rev-enue Counter-Cyclical Program (RCCP).’’ Ohio State University, Department of Agri-cultural, Environmental, and Developmental Economics, Report AEDE-RP97-08, January 2008.
Zulauf, C., G. Schnitkey, and M. Langemeier. ‘‘ACRE, Crop Insurance, and SURE: Inter-actions and Overlap for U.S. Midwest Crops.’’ Journal of Agricultural and Applied Economics 42,3(2010):501–15.