Corner effects for oblique shock
wave/turbulent boundary layer interactions
in rectangular channels
X. Xiang
†
and H. Babinsky
Department of Engineering, University of Cambridge, Trumpington Street, Cambridge CB2 1PZ, UK
(Received xx; revised xx; accepted xx)
In a rectangular cross-section wind tunnel a separated oblique shock reflection is set to interact with the turbulent boundary layer (oblique SBLI) both on the bottom wall and in the corners formed by the intersection of the floor with the side-walls. To examine how corner separations can effect the ‘quasi-two-dimensional’ main interaction and by what mechanisms this is achieved, an experimental investigation has been conducted. This examines how modifications to the corner separation affect a M = 2.5 oblique shock reflection. The nature of flow field is studied using flow visualisation, Pressure Sensitive Paint and Laser Doppler Anemometry. The results show that the size and shape of central separation vary considerably when the onset and magnitude of corner separation changes. The primary mechanism explaining the coupling between these separated regions appears to be the generation of compression waves and expansion fans as a result of the displacement effect of the corner separation. This is shown to modify the three-dimensional shock-structure and alter the adverse pressure gradient experienced by the tunnel floor boundary layer. It is suggested that a typical oblique SBLI in rectangular channels features several zones depending on the relative position of the corner waves and the main interaction domain. In particular, it has been shown that the position of the corner ‘shock’ crossing point, found by approximating the corner compression waves by a straight line, is a critical factor determining the main separation size and shape. Thus, corner effects can substantially modify the central separation. This can cause significant growth or contraction of the separation length measured along the symmetry line from the nominally two-dimensional baseline value, giving a fivefold increase from the smallest to the largest observed value. Moreover, the shape and flow topology of the centreline separation bubble is also considerably changed by varying corner effects.
Key words:
1. Introduction
The interaction of a shock wave with a boundary layer (Shock-wave/Boundary-Layer Interaction SBLI) is one of the fundamental problems of high speed flows in air. SBLIs have been studied for many decades, often by investigating simplified canonical problems which form the building blocks of more complex flows. Of these, the transonic interaction of a normal shock wave with a turbulent boundary layer and the supersonic oblique shock wave reflection are probably the most important problems. Both of these flows
sidewall
floor
oblique shock reflection
corner separation
corner shock Flow
Figure 1.Schematic diagram of corner separation shock wave in an oblique SBLI, adapted
from Babinskyet al.(2013).
are nominally two-dimensional and past research has generally concentrated on the flow behaviour well away from sidewalls or edge effects (refer to the reviews of classic 2-D SBLI of Adamson & Messiter 1980; D´elery & Dussauge 2009; Babinsky & Harvey 2011). However, more recently it has been found that when such flows are studied in rectangular channels, which is the most common geometry for such investigations, any flow separation occurring in the streamwise corners formed by the junction of the floor with the sidewall can significantly change the flowfield. In the transonic normal SBLI, it has been suggested by Burton & Babinsky (2012) that this is due to so-called corner shocks altering the adverse pressure gradient (APG) experienced by the flow elsewhere. These corner shocks arise from the displacement effect of the corner separation, which generally occurs well upstream of any separation around the central regions of the channel walls, because corner boundary-layers typically feature considerable regions of low-momentum as a result of the viscous interactions with two surfaces. For the case of a supersonic oblique shock-wave reflection interacting with the boundary layer on the floor of a channel (as sketched in figure 1) a similar mechanism has been suggested by Babinsky et al. (2013), but a comprehensive understanding of the role of corner shocks has not yet been reached.
The purpose of this study is to extend the current state of knowledge on the three-dimensional flow structures induced by sidewall effects and their effect on the flow elsewhere for an oblique SBLI. The aim is to determine how the relative magnitude of corner separation modifies the size and shape of ‘quasi-two-dimensional’ separation observed in the centre of a duct and by what physical mechanisms this is achieved. To achieve these goals, experiments have been conducted where the corner separations for an established reflecting shock interaction are manipulated to produce corner effects varying in relative size from moderate to significant. The baseline flow conditions are chosen to result in substantial separations both in the corners and along the centreline, which is thought to be a good starting point for this study.
86mm M=2.5
x=0
End of nozzle Suction Plenum
x y z
M=2.5 nozzle block Deployable shock generator
Window
80 Half-linear tunnel floor
5
Figure 2.Setup for the working section.
2. Methodology
2.1. Wind tunnel setup
Experiments have been performed in the supersonic wind tunnel No.1 in the Cambridge University Aerodynamics Laboratory. This tunnel is of the intermittent blow-down type driven by a high-pressure reservoir of dry air. A nominal freestream Mach number of 2.5 is used for all experiments with a unit Reynolds number of 40∗106m−1. The
stagnation pressure is set to 380kP a (fluctuating by about 0.5% during a typical run) and the stagnation temperature is set at 296K ±3K. During tunnel runs the stagnation temperature in the settling chamber is observed to increase at a rate of 0.1Ks−1, giving
a maximum variation of 6K. The set-up for the working section and key dimensions are shown in figure 2. A half-liner configuration with a single nozzle block is used here. By blocking the lower half of the tunnel, the streamwise distance for observation through the sidewall window is almost doubled and the possible run time is increased. The resulting working section is 114mm wide and 86mm tall. A deployable wedge on the ceiling of the tunnel is lowered to 8oto generate an oblique shock once the desired supersonic flow
is developed. A gap of 5mm between the leading edge of the deployed shock-generator and the upper surface of the tunnel enables the boundary layer on the nozzle block to disappear into the gap and therefore creates a ‘cleaner’ environment for the generation of the incident shock. A coordinate system following convention is used where xrefers to the streamwise direction withx= 0mmcorresponding to the end of the nozzle. The theoretical inviscid shock reflection location is atx= 135mm.y is measured vertically upwards with y = 0 referring to the tunnel floor. Spanwise position is denoted by z, measuring from the centreline of the tunnel floor with the sidewalls being atz=±57mm.
2.2. Flow measurement techniques
Two flow visualisation techniques are utilised to develop an intuitive understanding of the flow field. A two-mirror z-type horizontal schlieren system enables the observation of regions with high density-gradients such as shock waves and boundary layers. Surface
oil-(a)
(b)
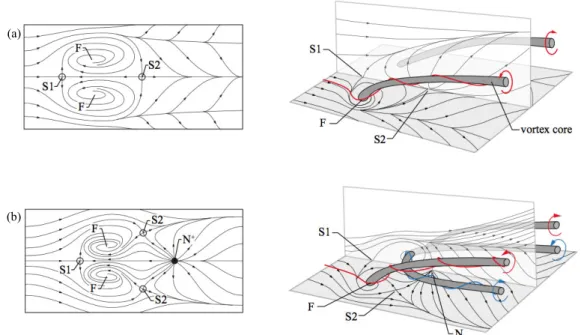
Figure 3.Three-dimensional flow fields associated with flow separations described by Perry &
Hornung (1984): (a) owl-face of the first kind; (b) owl-face of the second kind, adapted from Colliss (2014). S stands for saddle point, N refers to Node, F represents focus.
flow visualisations provide time-averaged surface-streamline patterns on the tunnel floor and sidewalls. A mixture of kerosene, finely-powdered titanium dioxide, oleic acid and a small amount of lubricating oil to add viscosity is used. The resulting oil-flow patterns are photographed once the tunnel runs have finished. A live video is recorded along with the still image to help eradicate any ambiguity caused by mixture smearing upon tunnel shutdown. To allow an accurate estimation of separation sizes, images presented here are corrected for perspective distortion and processed to improve the visibility of flow patterns. The obtained oil streak images are then used to infer the existence of critical points, determine the locations of separation and reattachment and hence construct the surface flow topology. While the oil mixture follows the surface streamlines well and represents the flow topology accurately for attached flows, it has been noted by Squire (1961) that an early (i.e. more upstream) indication of separation can occur as the oil tends to stop moving before the surface skin friction vanishes in an adverse pressure gradient. More specifically, oil streaks can underestimate the distance to separation by up to 5% of the upstream influence, making the error in indicated separation location of the order of 0.2 incoming boundary layer thickness (approximately 1.2mm) for this study. Squire (1961) also showed that for a boundary layer developed by supersonic external flows, the effect of the oil film on the skin-friction pattern is negligible. Given that the errors are relatively small,the lengths of shock-induced separated regions shown in the oil-flow visualisation can therefore still be compared among different experiments with confidence.
A common feature of three-dimensional separation is the ‘owl-face’ proposed by Perry & Hornung (1984). Figure 3(a) shows an ‘owl-face of the first kind’, containing a leading edge saddle point (S) which diverges the upstream streamlines. In this flow several friction lines coming from upstream, and the separation line, spiral into the focus points (F), which are the surface traces of ‘tornado-like’ vortices. Fluid then escapes through these
vortices, creating an ‘open’ separation. To ensure topological consistency, a second saddle pointS2exists on the reattachment line. Shown in figure 3(b), the ‘owl-face of the second
kind’ is of a similar yet more complicated organization. More specifically, the downstream portion differs in the way the rear saddle point is split into two and offset laterally, with an additional node (N) added to build a topologically consistent and physically possible pattern. The effect on the outer flow is to induce an additional horseshoe vortex, which partially offset the upwash around the centre-span produced by the more widely spaced primary vortices.
The average wall pressure measurements are conducted via static tappings (internal diameter 0.15mm) embedded in the wind tunnel floor and sidewall. They are connected by neoprene tubing to a differential pressure transducer NetScanner 9116. Accounting for the manufacturer quoted accuracy and calibration uncertainty, the measurements from the NetScanner system give a total error on normalised pressures from taps of ±0.5%. Pressure Sensitive Paint (PSP) supplied by Innovative Scientific Solution Incorporated (ISSI) is introduced to provide higher spatial-resolution data. To apply PSP, the surface of interest is sprayed with a special polymer binder seeded with luminescent molecules.
When irradiated by UV light, the resultant luminescence intensity is proportional to the normalised surface pressure. A reference image with no air flow is recorded immediately before each run to minimise any effects of paint degradation. This intensity ratio of two distinct conditions can then be calibrated by the in-situ pressure taps to map out the pressure distribution for the complete flow field. A comparison between pressure taps and the calibrated PSP data suggests an error bound of±3% for the PSP measurement. However it should be pointed out that this ±3% value excludes surface temperature variations. In regions where the thermal properties of the wall change (attachment screws, fillers) a much greater error is observed. Static wall pressure distributions along the tunnel floor centreline are obtained from the PSP images. Noise is reduced by averaging 15 spanwise pixels either side of the centreline (corresponding to a 1.5mmspan on the tunnel floor). Averaging over 10 pixels (0.4mm) in the streamwise direction allows a further reduction in noise, without significant deterioration of spatial resolution.
Streamwise velocity is measured with a two-component Laser Doppler Anemometry (LDA) system. Two pairs of coherent laser beams, with wavelengths of 561nmand 532nm respectively, are intersected at a specific point in the working section to produce an interference fringe pattern, measuring 98µm in diameter by 1.4mm in spanwise length. The system is aligned at 45oto the free-stream direction, enabling the measured vectors
by both channels to carry similar magnitudes of velocities and signal-to-noise ratios. The positional uncertainty of the measured volume is ±0.2mm,±0.02mm,±0.01mmfor x, y, and z respectively. The incoming flow is seeded with droplets of paraffin, formed by passing high-pressure air through an oil reservoir. An investigation by Collisset al.(2014) estimated the mean diameter of the particles as approximately 0.5µm, and determined that the droplets are adequately small to follow the flow.
Continuous streamwise traverses are used to examine the velocity variation along the centreline, with the measurement volume moving through the oblique shock interaction at a rate of 4mms−1. The seeding density is high in the outer inviscid flow, ensuring
that at least 5,000 samples are collected to calculate the time-averaged velocities. Taking alignment errors and the manufacturer quoted uncertainty into consideration, the free-stream velocities shown here are determined to an accuracy better than 1.5%. Boundary layer traverses are conducted atx= 80mmto characterise the inflow properties, and also further downstream from the interaction atx= 160mm. Due to the low seeding levels near the wall and optical reflection, data measured within 0.18mmof the tunnel floor are rejected. Integrating directly from the raw data can lead to overestimation of integrated
Corner obstacles Corner vanes
Corner suction slots
(a)
Corner obstacles Corner vanes
Corner suction slots
(b)
Figure 4.Experimental arrangements: (a) corner obstacles; (b) corner control techniques.
boundary layer properties. A fitting scheme is therefore applied to the measured points to more faithfully represent the boundary layer profiles. More specifically, a wall-wake velocity profile suggested by Sun & Childs (1973), transformed by the equation of van Driest (1951) to account for compressibility effects, is adopted to fit the measured data in the logarithmic and wake regions. The fitted scheme is further extrapolated towards the wall with the method of Musker (1979). The model provides an excellent fit to the turbulent boundary layer data, with the thickness and incompressible integral parameters calculated with an accuracy within 5% of the true value (Titcheneret al.2015).
2.3. Corner flow manipulation
To examine how changes in the corner flow field can affect the main oblique SBLI, modifications to the corner geometry are applied to change the onset and magnitude of corner separations. Two obstacles, as depicted in figure 4(a), are utilised to increase the size of corner separations. These obstructions, consisting of blocks with dimensions 10×10×20mm3, are placed ahead of the inviscid shock location. The streamwise positions
of the block front edge range fromxblock= 75mm toxblock= 130mm, with a minimum
distance of 5mm between two consecutive locations. A pair of elongated blocks with a length of 40mm is also tested atxblock = 85mm. Corner suction and vane-type
micro-vortex generators (VGs), as shown in figure 4(b), are introduced to study the effect of a reduced corner separation. The vane height is 3mm(approximately 50% of the incoming boundary layer thickness) and the vanes are set at an angle of 15◦ to the inflow. The trailing edge of the micro-VGs is placed at xvg = 50mm, making the non-dimensional
distance between the inviscid shock reflection location and the VG trailing edge roughly 28 device heights. Corner suction is placed in the interaction zone, with the leading edge of the bleed slots located atxslot= 100mm.The slot is 32mmlong by 5mmwide, with
the angle set to be 20◦. The suction mass flow rate is 0.28% of the mass flow through the wind tunnel working section. This achievable amount of bleed is limited due to the low local surface pressure associated with the high Mach number. The aim of all these corner flow manipulations is to compare flow fields with an incident shock of identical strength and location, but different corner separation geometry.
3. Results and discussion
3.1. Baseline flow
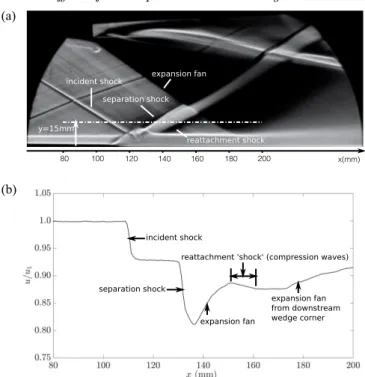
Figure 5(a) shows a schlieren image of the unmodified baseline interaction, which is seen to be globally stable in the high-speed video recording. The standard pattern of a separation and reattachment shock bounding an expansion fan suggests the presence of a separated region. The oblique interaction domain spreads from x = 110mm to
(a) (b) 140 100 120 160 180 200 y=15mm x(mm) incident shock separation shock reattachment shock expansion fan 80 incident shock separation shock incident shock separation shock expansion fan expansion fan from downstream wedge corner reattachment 'shock' (compression waves)
Figure 5.Flow structure of undisturbed baseline interaction presented by (a) schlieren photograph and (b) streamwise velocity aty= 15mm,z= 0mm.
(a) (b)
(c) (d)
Figure 6. Boundary-layer profiles measured with LDA along the tunnel floor centreline for
baseline case: (a) inflow boundary layer profile atx= 80mm; (b) inflow boundary layer profile in law-of-the-wall coordinates; (c) downstream boundary layer profile at x = 160mm; (d) downstream boundary layer profile in law-of-the-wall coordinates.
(b)
(a) centreline separation
streamwise length Lsep
central separation spanwise extent charaterised by Lf corner interaction extent S1 S2 F1 F2 x(mm)
Figure 7.Interpretation of flow topology on the tunnel floor for baseline flow by (a) surface oil-flow visualisation; (b) schematic illustration of separation sizes extracted from the oil flow. Limiting streamlines and the footprint of the separation are suggested for clarity; the vertical line indicates the inviscid shock location.
(a)
x(mm)
90 110 130 150
(b)
x(mm)
Figure 8.Surface pressure distribution through baseline interaction on the tunnel floor: (a)
PSP map; (b) static wall pressure distribution along the tunnel floor centreline.
x= 140mmwith the inviscid shock reflection located atx= 135mm. At the top of the image, a strong expansion fan emanates from the downstream wedge corner, impinging on the tunnel floor at approximately x = 200mm, roughly 10δ behind the inviscid shock reflection location. The streamwise velocity variation measured alongy = 15mm on the central symmetry plane (marked by a white dot-dashed line in figure 5a) is shown in figure 5(b). The flow is initially at the incoming free-stream velocity (u1),
and then decelerates through the incident shock. The following two deceleration steps bounding a re-acceleration region correspond to the typical separated interaction wave pattern depicted in the schlieren photograph. The LDA measurements indicate that the reattachment shock is weak and quite smeared-out, even in the outer inviscid flow. The boundary layer profiles measured at two streamwise positions along the centreline are presented in figure 6. Here the inflow boundary layer obtained at x = 80mm, shown in figures 6(a) and 6(b), is 6.1mm thick, and the incompressible integral values are: displacement thickness δ∗ = 0.84mm, momentum thickness θ = 0.61mm, and shape factorHi= 1.37. There is a well-defined log region and the agreement with the analytical
profile is excellent throughout. A rapid thickening of the boundary layer can be observed across the interaction. The boundary layer measured atx= 160mm(figures 6c-d), around 4δ downstream of the inviscid shock reflection, is 7.6mm thick, with a displacement thickness of 2.14mm, momentum thickness of 1.17mmand a shape factor of 1.83.
y=20mm compression waves expansion waves 90 100 110 120 Floor (a) (b) 90 100 110 120 x(mm)
Figure 9.Structure of the wave pattern induced by the corner separation illustrated by: (a) PSP
map on the right sidewall; (b) static wall pressure distribution measured by pressure tappings atz= 57mm, y= 20mm.
Figure 7(a) shows the oil-flow visualisation on the tunnel floor. The corner separation regions are indicated with a red line, while the black lines mark the centreline separation and reattachment locations. Limiting streamlines are also shown for clarity, with the surface flow topology presented and annotated schematically in figure 7(b). Here the inviscid shock location, from an extrapolation of the incident shock seen in figure 5(a), is marked by a vertical line. The skin friction lines suggest that the centreline separation topology falls into the ‘owl-face of the first kind’ category, with two saddle points (S) and a pair of foci (F) clearly identifiable. The sizeable separation region in the centre of the tunnel floor exhibits a relatively two-dimensional pattern for much of its spanwise extent. However towards the sidewalls the streamwise separation length reduces and the separated region is bounded by distinct foci on either side. On the centreline the separation starts at x = 112mm, measuring 25mm in streamwise direction (termed Lsep). The spanwise separation width Lf is defined as the distance between the two foci
and covers 62mm(54% of working section width). In each corner region, the presence of reversed flow is suggested by the displacement of the incoming streamlines, originating approximately 18mm ahead of the centreline separation. The corner interaction ‘foot-prints’ are seen to extend to approximately 22mmfrom the side wall (20% of full span). Although critical points are not clearly seen in the corners, the recirculating streamlines suggest the presence of a focus and the formation of a corner vortex on both sides. A narrow attached flow channel is observed between the central and corner separations.
The static pressure on the tunnel floor is presented in figure 8, as a PSP map (figure 8a) and the distribution along the centreline (figure 8b). The simplified separation topology
(b) (a)
boundary layer edge
separation bubble sonic line compression waves corner shocks incident shock expansion waves separation shock reattachment shock S R corner expansion corner separation sidewall floor corner region
expansion over separation crest
compression waves
footprint of the leading wave
Flow
Figure 10.Schematic illustration of corner effects on baseline flow: (a) diagram of corner wave structure; (b) diagram of SBLI structure on the central symmetry plane.
is superimposed on the PSP map (figure 8a) to allow a comparison with the oil-flow visualisation. It can be seen that there is a uniform region of low pressure upstream of the oblique interaction. This is followed by a rapid pressure rise starting near the separation onset. This separation shock footprint presents little spanwise variation, except for the additional pressure smearing as the sidewalls are approached. Comparing the pressure distribution with the separation boundaries, it can be seen that the more upstream pressure rise near the sidewalls corresponds well to the onset of corner separation. This smeared-out corner pressure distribution is therefore likely linked to the corner separation.
The PSP map shown in figure 9(a) presents the pressure distribution on the right sidewall. Here, no quantitative data can be extracted due to a combination of more prominent image noise (poor UV light access) and thermal effects. As identified from the oil-flow image, the corner separation on the sidewall extends approximately 18mmaway from the tunnel floor, with the separation onset located atx= 87mm. The wall pressure measured with taps located in 3mmintervals along the white-dashed line aty= 20mmis shown in figure 9(b). It is observed that the pressure near the onset of corner separation first increases and then reduces again. This suggests that the wave pattern, caused by the corner separation, consists of a compression fan followed by expansion waves of equal strength. The presence and strength of the expansion waves has been overlooked in previous studies (Burton & Babinsky 2012; Eagle & Driscoll 2014).
proposed that the separation acts like an aerodynamic bump, which first deflects the supersonic flow away from the corner, generating compression waves, and then returns the flow towards the streamwise direction, which is the cause of the observed expansion waves. An adverse and then favourable pressure gradient is therefore produced, which can alter the pressure distribution elsewhere in the flow field as the corner waves propagate downstream. For further analysis of the oblique SBLI flow field, it is important to trace the pattern of these waves generated by corner separation, as this helps to determine which and how other flow regions are influenced by corner effects. Of particular interest is the location of the most upstream leading compression wave along the floor. The PSP image on the tunnel floor (figure 8a) shows this wave very clearly in the region ahead of the SBLI. Once the wave enters the interaction zone its footprint is however no longer easily identifiable. It is expected that the corner waves will change direction as they penetrate into non-uniform regions and interact with other waves. However, these changes of direction are relatively small. Therefore, a rough approach to determine the upstream boundary of corner influence region is to define a ‘corner shock footprint’ which combines the leading compression into a single line. The location and direction of this line is determined from the PSP map on the floor and, for simplicity, the footprint is assumed to follow a straight line across the interaction domain (until the central-span is reached where it will cross with the equivalent wave from the opposite corner). When this footprint is applied to the oil-flow image, as shown in figure 12, it is observed that the lines generally pass through the point where inflow skin friction lines near the sides of the tunnel are initially deflected towards the centre by the displacement effect of corner separation.
The modification of the pressure gradient by the corner waves appears to be the primary mechanism behind the link between the corner separation size and the other areas of separation. As shown in figure 9(b), the pressure downstream of the expansion fan is approximately the same as that of the inflow, indicating that the pressure rise induced by the corner shock is offset by the following expansion waves. For the region close to the corner separation, a milder APG is hence produced due to a combination of an earlier onset of pressure rise caused by corner shock and an unchanged total shock-induced pressure rise as in the two-dimensional oblique SBLI because of the cancellation effect of the subsequent expansion. This reduced APG, as evidenced by the tunnel floor pressure distribution (figure 8a), is the most likely cause of the attached channel observed between the corner and central separations.
Figure 10(b) shows schematically the influence of the corner wave pattern on the flow in the central symmetry plane. Here the corner shocks and the following expansion waves arrive well behind the oblique interaction, with the streamwise intersection point of the corner shocks estimated to be atx= 160mm. The SBLI is therefore not influenced by corner effects, which explains the localised quasi-two-dimensional separation topology seen in figure 7.
The results suggest that for an oblique SBLI the influence of corner effects depends on the relative position of corner waves to the main interaction. For the actual region of corner flow, where the floor and sidewall boundary layers meet, separation is generally observed to occur earlier than elsewhere. In the central region the corner waves are too far downstream to influence the interaction. In the region between the corner separations and the centre, the oncoming flow along the floor first meets the corner waves before encountering the main interaction. This has the effect to smear out the pressure rise through the SBLI, leading to a reduction or even absence of separation.
oblique shocks from micro-VGs expansion fan by suction 140 80 100 120 160 180 200 x(mm)
Figure 11.Schlieren photograph with micro-VGs (xvg= 50mm) and corner suction
(xslot= 100mm) employed in tandem to reduce corner effects.
50 70 90 110 130 150 170 190
30 70 90 110 130 150 170 190
corner suction slot
vortex generator F1
F2
S1 S2
(a) (b)
x(mm) x(mm)
Figure 12.Surface flow visualisation on the tunnel floor for the experiment with combined control applied: (a) oil-flow image; (b) PSP map.
separations are deliberately altered, thus changing the positions of corner waves relative to the impinging shock.
3.2. Interaction with reduced corner separations
Figure 11 shows a schlieren image for a flow where a combination of micro-VGs (xvg=
50mm) and corner suction (xslot= 100mm) has been used to reduce the size of corner
separation. Here, no prominent difference from the baseline flow can be observed except for some evidence of an expansion fan originating from the suction slots and the oblique shock waves created by the leading and trailing edges of the VGs. The main SBLI appears unaffected by the changes to the corner flow.
Figure 12(a) provides the oil-flow visualisation. It can be seen that the corner separa-tions are considerably reduced, spanning only 8mm, which is a 65% decrease from the baseline. The three-dimensionality of the overall flow field ia also reduced. The spanwise extent of the central separation Lf is now 72mm (16% greater than that of baseline)
while Lsep remains unchanged at 25mm. This is also reflected in the surface pressure
distribution presented in figure 12(b), which exhibits a wider region with little spanwise variation at the start of the interaction and reduced pressure smearing near the sidewalls. The corner shock footprint traced by the PSP map suggests that the waves cross at x= 181mm, 21mmdownstream from the uncontrolled case. It is also noteworthy that on the oil-flow image this footprint passes through the two focal points bounding the centreline separation, and that the region in-between the corner waves is characterized
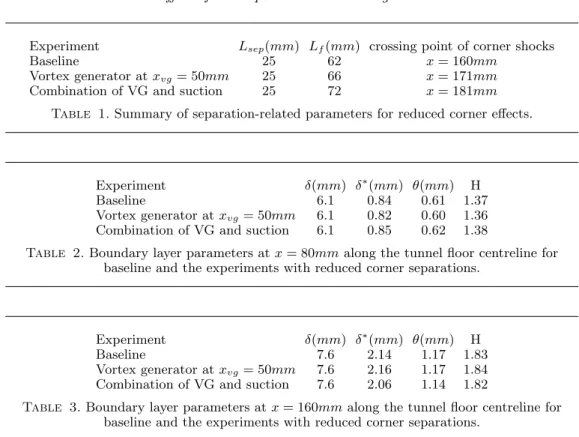
Experiment Lsep(mm) Lf(mm) crossing point of corner shocks
Baseline 25 62 x= 160mm
Vortex generator atxvg = 50mm 25 66 x= 171mm
Combination of VG and suction 25 72 x= 181mm
Table 1.Summary of separation-related parameters for reduced corner effects.
Experiment δ(mm) δ∗(mm) θ(mm) H
Baseline 6.1 0.84 0.61 1.37
Vortex generator atxvg= 50mm 6.1 0.82 0.60 1.36
Combination of VG and suction 6.1 0.85 0.62 1.38
Table 2.Boundary layer parameters atx= 80mmalong the tunnel floor centreline for baseline and the experiments with reduced corner separations.
Experiment δ(mm) δ∗(mm) θ(mm) H
Baseline 7.6 2.14 1.17 1.83
Vortex generator atxvg= 50mm 7.6 2.16 1.17 1.84
Combination of VG and suction 7.6 2.06 1.14 1.82
Table 3.Boundary layer parameters atx= 160mmalong the tunnel floor centreline for
baseline and the experiments with reduced corner separations.
by relatively straight separation and reattachment lines. The central separation topology can still be classified as an ‘owl-face of the first kind’.
A configuration employing micro-VGs atxvg = 50mm alone is also tested, resulting
in a flow field somewhere between the previous two cases, and the relevant geometric measurements are also included in table 1. Tables 2 and 3 summarise the boundary layer profile data upstream and downstream of the interaction for all cases discussed so far. It can be seen that there is very little difference, confirming that corner effects did not change the flow on the centreline in these locations. The main effect of reducing the size of corner separation is therefore an increase in the uniform main interaction region while the central separation length is unaffected. Such quasi-two-dimensional behaviour has also been observed in the large-eddy simulations of Wanget al.(2015) for relatively large wind-tunnel widths, where the corner shocks determined by the pressure gradient contours are shown to reach the symmetry plane well behind the interaction zones.
3.3. Interaction with increased corner separations
Figure 13 shows schlieren images for two experiments where corner blocks are applied to increase the size of corner separations. The horizontal white dot-dashed lines represent the position at which streamwise LDA traverses are conducted. Figure 13(a) presents the flow with the corner obstacles placed across the interaction domain atxblock= 120mm.
A much larger interaction length with an onset 20mmupstream of the unmodified SBLI is observed, and the boundary layer downstream of the interaction appears to be thicker than in the baseline flow. Both observations suggest that the oblique shock-induced separation has increased in size. In contrast, when the blocks are located even further upstream, atxblock= 75mm(figure 13b), the separation shock is more pronounced while
140
80 100 120 160 180 200 80 100 120 140 160 180 200
y=15mm
intensified separation shock
Larger interaction length
x(mm) x(mm)
(a) (b)
Figure 13. Schlieren photographs with corner obstacle introduced to increase corner effects: (a) streamwise position of the block front edge atxblock = 120mm; (b) streamwise position of
the block front edge atxblock= 75mm.
Experiment Lsep(mm) Lf(mm) crossing point of corner shocks
xblock= 130mm 35 35 x= 145mm xblock= 125mm 38 37 x= 140mm xblock= 120mm 45 37 x= 137mm xblock= 115mm 37 31 x= 131mm xblock= 105mm 35 23 x= 128mm xblock= 95mm 34 19 x= 123mm xblock= 90mm 32 14 x= 112mm xblock= 85mm 16 16 x= 105mm xblock= 85mm (40mmobstacles) 15 21 x= 105mm xblock= 75mm 9 25 x= 97mm
Table 4.Summary of separation-related parameters for increased corner effects.
the size of interaction zone exhibits no prominent difference compared to the undisturbed SBLI.
A series of oil-flow images with various corner-block positions are shown in figure 14. Compared to the baseline surface streamline pattern (figure 7a), it can be seen that for all corner block locations the corner separations are significantly increased in size by up to 50%. As the blocks move upstream the onset of corner separation shifts forward as well and the corner shock footprints (and the approximate crossing points) are found to move accordingly (as indicated by the red lines). This is accompanied by significant changes in the size and shape of centreline separation, as shown by the geometric parameters in table 4.
Figures 14(a-g) show that when the corner waves cross inside the separated region, the centreline separation lengthLsepexperiences a sharp increase. More specifically, the value
of Lsep reaches a maximum when the intersection point approaches the reattachment
position of the unmodified SBLI at x = 137mm, as shown in figure 14(c). Here the separated flow reattaches further downstream than in any of the other tests. This is followed by a progressive decrease inLsep as the corner shock intersection point moves
upstream. Due to the more prominent displacement effect caused by enlarged corner separations, corner shocks are located increasingly closer to the mid-span symmetry line and hence affect a larger proportion of flow field. This is reflected by a change in the spanwise extent of the central separation which clearly shows a trend of decreasing as the corner shocks move upstream. The central separation topology is also observed to transit from ‘owl-face of the first kind’ to the more complicated ‘second kind’ (as seen in
50 70 90 110 130 150 170 190 50 70 90 110 130 150 170 190 50 70 90 110 130 150 170 190 50 70 90 110 130 150 170 190 50 70 90 110 130 150 170 190 50 70 90 110 130 150 170 190 50 70 90 110 130 150 170 190 50 70 90 110 130 150 170 190 50 70 90 110 130 150 170 190 50 70 90 110 130 150 170 190
(a)
(b)
(c)
(d)
(e)
(f)
(g)
(h)
(i)
(j)
x(mm) x(mm) x(mm) x(mm) x(mm) x(mm) x(mm) x(mm) x(mm) x(mm) Figure 14. Surface oil-flow visualisation on the tunnel floor for the oblique SBLIs withincreased corner effects: (a) xblock = 130mm; (b) xblock = 125mm; (c) xblock = 120mm;
(d) xblock = 115mm; (e) xblock = 105mm; (f) xblock = 95mm; (g) xblock = 90mm;
(h) xblock = 85mm; (i) xblock = 85mm with elongated blocks at a length of 40mm; (j)
S1 S2 F1 F2 S1 F1 F2 S4 S3 N F1 F2 S1 S2 S3 N F3 F4 S4 S5 S1 S2 F1 F2 S1 F1 F2 S4 S3 N F1 F2 S1 S2 S3 N F3 F4 S4 S5 (a) (b) (c) S1 S2 F1 F2 S1 F1 F2 S4 S3 N F1 F2 S1 S2 S3 N F3 F4 S4 S5
Figure 15.Surface flow topology of the centreline separation underneath the oblique SBLIs with increased corner effects: (a) crossing point of corner shocks downstream to the separation onset of baseline flow; (b) crossing point at the separation onset of baseline flow; (c) crossing point upstream of the separation onset of baseline flow.
figures 15a-b), with the approximate footprint of the corner shocks once again crossing through the focal points identified at the edges of centreline separation.
As the crossing point of corner shocks shifts ahead of the separated zone (figures 14h-j), the trend of reducing separation length continues, even beyond the baseline. For the most upstream location of the corner blocks, the centreline separation length reduces to 9mm, which is a 64% decrease from the baseline value. Closer inspection reveals that the reduction in Lsep is due to a delayed separation onset, while the reattachment location
remains approximately unchanged from the undisturbed interaction. The topological structure of the central separation is seen to exhibit a more complicated pattern. As shown in figure 15(c), an additional pair of saddle points (S1, S2) and foci (F1, F2)
respectively are observed in the upstream portion, while the rest of the flow field closely resembles an ‘owl-face of the second kind’. The more extensive corner separations deflect the flow near the sidewalls toward the mid-span more strongly. This, along with a reduced centreline separation distance, gives rise to an additional pair of vortices, which act to help the flow accumulated in the central region lift off and escape from the tunnel floor. In this case, the spanwise width Lf is defined as the distance between F3 and F4, the
two focal points inside the shock-induced separated region.
In figure 16 the static wall pressure distribution on the tunnel floor is shown for the two corner-block experiments with reducedLsep. Compared to the baseline flow (figure 8a),
Corner effects for oblique SBLIs in rectangular channels 17
(a)
(b)
x(mm) 50 70 90 110 130 150 30 50 70 90 110 130 150 30 50 70 90 110 130 150 30 50 70 90 110 130 150 30 50 70 90 110 130 150 30 x(mm) Figure 16.P/P0 for the tunnel floor for the oblique SBLIs with increased corner effects: (a)xblock= 85mm; (b)xblock= 75mm. The approximate footprint of the corner shock is indicated
by red lines.
Figure 17.Static wall pressure distribution on the tunnel floor centreline.
of the more upstream position of corner shocks, there is no longer a uniform flow region directly ahead of the interaction domain.
Figure 17 compares selected wall pressure distributions along the tunnel floor centre-line. The xblock= 85mm case shows an increased upstream influence, with the pressure
rise occurring approximately 12mmearlier than in the baseline flow. This is followed by a less steep APG across the interaction and an unchanged total shock-induced pressure rise. For thexblock= 75mmexperiment, the upstream influence is further increased with
the onset of pressure rise located 20mmupstream compared to the baseline, exhibiting a larger interaction length with a noticeably milder adverse pressure gradient. If the centre-span flow behaved quasi-two-dimensionally, the larger interaction length would be associated with an increase in centreline separation. This, however, contradicts the considerably reduced Lsep shown in the oil-flow images (figures 14h, j), suggesting that
the increase in pressure smearing is not caused by the local separation ‘bubble’ but rather a consequence of the changes to the corner wave positions and their influence on the centreline flow.
The inflow boundary layer parameters along the tunnel floor centreline are listed in table 5. The data for the configuration xblock = 75mm is not available as this block
corner shock
stronger separation shock
stronger reattachment shock
intensified re-acceleration corner expansion waves
Figure 18.Variation in streamwise velocity aty= 15mm,z= 0mm.
Experiment δ(mm) δ∗(mm) θ(mm) H
xblock= 120mm 6.1 0.84 0.61 1.37
xblock= 85mm 6.2 0.84 0.61 1.38
Table 5.Boundary layer parameters atx= 80mmalong the tunnel floor centreline for the experiments with increased corner separations.
Experiment δ(mm) δ∗(mm) θ(mm) H
xblock= 120mm 10.4 3.10 1.61 1.93
xblock= 85mm 7.0 1.77 1.04 1.71
xblock= 75mm 6.8 1.66 1.00 1.67
Table 6.Boundary layer parameters atx= 160mmalong the tunnel floor centreline for the
experiments with increased corner separations.
are almost unchanged from the baseline. This confirms that the corner obstacles, located well away from the tunnel mid-span, do not affect the centre-span flow ahead of the interaction.
Table 6 compares the boundary layer parameters measured 25mmdownstream of the inviscid shock reflection point. A much thicker boundary layer is seen in the xblock =
120mmexperiment (also observed in the schlieren visualisation in figure 13a). This is in accordance with the delayed reattachment process and the largest separation lengthLsep
among all the tests. Lower incompressible shape factors are observed for the experiments with the corner blocks applied at xblock = 85mm and xblock = 75mm, which indicate
fuller boundary layer profiles recovering quicker from the effect of the oblique interaction. This is most likely a consequence of the reduced centreline separation.
Figure 18 presents the streamwise velocity variation through the impinging SBLI above the boundary layer edge at y = 15mm, z = 0mm. The measurements show that the deceleration through the separation shock occurs approximately 10mmfurther upstream in the three corner-block tests than in the baseline experiment, in line with an increased interaction length and an earlier onset of pressure rise. For thexblock= 120mmtest the
reattachment shock strengthened by corner shocks
corner expansion waves arrive downstream of the interaction zone
separation shock strengthened by corner shocks
expansion fan intensified by corner expansion waves
‘smeared-out’ separation shock foot
S R S R increased separation reduced separation (a) (b)
Figure 19.Schematic illustration of corner effects on the oblique SBLIs with increased corner
effects along the symmetry line: (a) corner shocks cross inside the centreline separation; (b) corner shocks cross ahead of the centreline separation.
flow deceleration through the reattachment shock is more pronounced, indicating that the strength of the pressure rise is intensified by the corner shock waves which reach the symmetry line at this location (see also the approximate footprint of the corner shocks marked in figure 14c). The expansion waves generated by the corner separation can be seen in the flow acceleration downstream of the reattachment shock. In thexblock= 85mm
experiment where corner shocks arrive ahead of the centreline separation, the flow is decelerated to a lower velocity than the baseline case through the combined effects of the corner and separation shocks. This is followed by a more pronounced re-acceleration caused by the subsequent corner expansion waves, which also meet inside the interaction zone. For the case of xblock = 75mm, an additional velocity reduction occurs ahead of
the incident shock. This is due to the corner shocks being shifted further upstream, now located approximately 30mm (5 inflow δ) ahead of the centreline separation onset, as shown in figure 14(j). The following deceleration of the incident shock appears to be almost the same as for the baseline case. A similar intensified re-acceleration is again observed.
The effect of the corner waves on the SBLI in the central plane is shown schematically in figure 19. Figure 19(a) describes interactions where the corner shock crosses around the reattachment region (e.g.xblock= 120mm). In this scenario, the reattachment shock is
strengthened by the corner shocks. Thus, the pressure rise at re-attachment is intensified which requires an increased separation bubble size to accommodate the greater overall pressure jump across the interaction. The subsequent corner expansion waves, which
might relieve the additional pressure rise, however arrive too far downstream to cancel the effects of the corner shocks before reattachment (as shown in figure 18). This leads to the increased separation length observed in the oil-flow visualisation (figure 14c) and a downstream shift of the reattachment line compared to the baseline flow. The enlarged centreline separation then gives rise to an increased interaction domain, which explains the earlier onset of deceleration through the separation shock compared to the baseline case (figure 18).
An equivalent schematic illustration for the interaction where the corner shocks are even further upstream and cross ahead of the separated region is provided in figure 19(b). Here the corner shocks reach the centreline before the separation point. The additional pressure rise caused by the corner shock might be expected to increase the central separation, whereas the evidence (figures 14h, j) shows the opposite behaviour. This can be explained by two factors. First, the corner ‘shock’ is of relatively limited strength and consists of a series of compression waves rather than a single strong shock. This means that the overall pressure jump is smeared over a larger area. Second, the corner shock is followed by expansion waves which now reach the symmetry plane within the interaction zone (as seen in figure 18 by the strong re-acceleration of the flow above the interaction region for xblock = 85mm and xblock = 75mm). This means that they can
now relieve the overall pressure rise which reduces the separation length.
As the corner expansion waves play a significant role in the physical mechanism proposed for the interactions with reduced Lsep, an additional experiment has been
conducted with obstacles of a different length to test whether the prominent corner expansion waves seen here are induced by the corner separation or the rear edge of the block. The oil-flow visualization shows that Lsep of the flow disturbed by the
elongated obstacles (figure 14i) is almost the same as that altered by the standard blocks (figure 14h), confirming the corner expansion fan emanating from the tunnel sidewall is a consequence of the displacement effect of the corner separation.
3.4. Discussion
In the above it has been shown that modifications to the size of corner separations have a direct effect on the location of corner shock and expansion waves. The position of the corner shock crossing point (found by approximating the corner compression waves by a straight line) is a good indication of the impact of the corner waves on the size and shape of the central separation. If the crossing point falls downstream of the interaction the separation on the centreline is unaffected. If the crossing point falls inside the interaction zone the separation is increased, while a crossing point ahead of the interaction leads to a reduction in central separation. This behaviour is well illustrated by figure 20 which shows the separation length measured on the symmetry line Lsep as a function of the corner
shock crossing point for all experiments conducted. As a guide, the extent of the baseline separation is also given. For corner shock crossing points downstream of the interaction there is no influence on the separation length and the central separation is at its most ‘two-dimensional’. It can be seen that the largest separation is observed when the corner shocks cross near the end of the baseline separation. This is likely because no beneficial expansion waves can reach the interaction in this scenario. As the shock crossing point moves upstream, more expansion waves help to gradually alleviate the detrimental effects of the corner shocks until eventually the influence of compressions and expansions on the interaction reverses and the separation length reduces even beyond the nominal two-dimensional value. This is aided by the more gentle ‘pre-compression’ from the corner compression waves now arriving ahead of the interaction to reduce the overall adverse pressure gradient. The change in streamwise separation length due to corner effects is
baseline separation
inviscid incident shock impingement Lsep
Lf quasi-2d increased sep.
reduced sep.
Figure 20.Variation of the centreline separation lengthLsep and widthLf as a function of
streamwise position of corner shocks intersection point.
significant, with the largest separation being five times greater than the smallest. The spanwise extent of the central separation Lf presents a general trend of decreasing as
the crossing point shifts upstream until it moves outside the separated region, where the central separation expands wider in spanwise direction with the corner shocks intersection point located further upstream.
4. Conclusion
Experiments have been conducted to study an oblique shock wave/boundary layer interaction in a rectangular cross-section supersonic wind tunnel. The inflow Mach number is 2.5 and a flow deflection of 8ois generated by a wedge mounted at the ceiling.
The adverse pressure gradient resulting from the oblique shock reflection on the floor of the working section is sufficient to cause substantial separations both in the corners and around the central-span. The magnitude and onset of corner separations are modified with flow control to produce corner effects varying in relative size from moderate to significant.
The results demonstrate that changes to the geometry of corner separation can strongly effect the size and shape of separation observed in the centre of the tunnel floor. A decrease in the size of the corner separation generates a more two-dimensional flow field with the central separation having a greater spanwise extent. An increase in the size of the corner separation drastically changes the surface flow topology of the separated region in the centre, which is observed to transit from the quasi-two-dimensional ‘owl-face of the first kind’ to the more complicated second kind. The separation length measured
along the symmetry line is also seen to be considerably altered, presenting an increasing and then decreasing trend as the onset of corner separation shifts upstream.
The primary mechanism behind this appears to be the waves induced by corner separations, which act to alter the separated interaction wave structure and in turn influence the adverse pressure gradient imposed upon boundary layers elsewhere. The blockage effect of the corner separation first deflects the supersonic flow away from the corner through a series of compression waves, or ‘corner shock waves’, and then returns the flow towards the streamwise direction by an expansion fan. The impact of these corner waves on the central separation is found to be well illustrated by the position of the corner shock crossing point. If the corner shocks reach the symmetry plane downstream of the interaction zone the centreline separation is unaffected. If the crossing point is inside the separated flow, an increase in separation length and a more three-dimensional separation bubble can result because of the detrimental effect of the corner shocks. In cases where the corner shocks are shifted further upstream and intersected ahead of the interaction, a reduction in centreline separation length even beyond the two-dimensional value is observed due to the beneficial effect of the corner expansion waves.
The experimental conditions tested show that the presence of corner effects can cause the centreline separation length to vary from 36% to 180% of the nominally two-dimensional baseline value. The results illustrate the significance of corner effects for oblique SBLIs in rectangular channels.
While the current study has only investigated one particular free-stream Mach number and oblique shock strength, it is the authors’ view that the fundamental wave interactions and their effect on the overall flow topology is similar for all oblique shock reflections, and this allows a few basic ‘predictions’. Given that the corner shock crossing point has been identified as a critical parameter, it is suggested that interactions with greater Mach number inflows are likely to exhibit more ‘two-dimensional’ behaviour as the wave angle would be expected to decrease with increasing Mach numbers. On the other hand, stronger shock strengths are expected to increase the size of corner separations, which would lead to a more upstream position of the corner waves and thus promote more ‘three-dimensional’ interactions.
The footprint of the corner shocks has also been applied to the surface flow visualisation of previous numerical studies with different wedge angles, Mach numbers and aspect ratios, such as those performed by Wanget al.(2015) and Beneket al.(2016). The relative position of the corner shock crossing point and the main interaction domain is shown to capture the extent of sidewall effects, and correctly predict the general behaviour of central separations. This suggests the generality of the experimental findings, which can be tested by future research for different shock strengths and incoming boundary-layer conditions.
REFERENCES
Adamson, T. C. & Messiter, A. F. 1980 Analysis of two-dimensional interactions between
shock waves and boundary layers.Annual Review of Fluid Mechanics12(1), 103–138.
Babinsky, H. & Harvey, J. K. 2011 Shock wave-boundary-layer interactions. Cambridge University Press.
Babinsky, H., Oorebeek, J. & Cottingham, T. 2013 Corner effects in reflecting oblique
shock-wave/boundary-layer interactions.AIAA paper 2013-859 .
Benek, J. A., Suchyta, C. J. & Babinsky, H.2016 Simulations of incident shock boundary
layer interactions.AIAA paper 2016-0352 .
wave/turbulent boundary layer interactions in rectangular channels. Journal of Fluid Mechanics 707, 287–306.
Colliss, S. P.2014 Vortical structures on three-dimensional shock control bumps. PhD thesis,
University of Cambridge.
Colliss, S. P., Babinsky, H., N¨ubler, K. & Lutz, T.2014 Joint experimental and numerical approach to three-dimensional shock control bump research. AIAA journal 52(2), 436– 446.
D´elery, J. M. & Dussauge, J.-P.2009 Some physical aspects of shock wave/boundary layer
interactions.Shock Waves 19(6), 453–468.
van Driest, E. R. 1951 Turbulent boundary layer in compressible fluids. Journal of the Aeronautical Sciences 18(3), 145–160.
Eagle, W. E. & Driscoll, J. F.2014 Shock wave–boundary layer interactions in rectangular inlets: three-dimensional separation topology and critical points. Journal of Fluid Mechanics 756, 328–353.
Musker, A. J.1979 Explicit expression for the smooth wall velocity distribution in a turbulent
boundary layer.AIAA Journal 17(6), 655–657.
Perry, A. E. & Hornung, H. 1984 Some aspects of three-dimensional separation. ii-vortex skeletons.Zeitschrift fur Flugwissenschaften und Weltraumforschung 8, 155–160.
Squire, L. C.1961 The motion of a thin oil sheet under the steady boundary layer on a body.
Journal of Fluid Mechanics 11(2), 161–179.
Sun, C.-C. & Childs, M. E. 1973 A modified wall wake velocity profile for turbulent
compressible boundary layers.Journal of Aircraft 10(6), 381–383.
Titchener, N., Colliss, S. & Babinsky, H. 2015 On the calculation of boundary-layer parameters from discrete data.Experiments in Fluids56(8), 159.
Wang, Bo, Sandham, Neil D, Hu, Zhiwei & Liu, Weidong 2015 Numerical study of
oblique shock-wave/boundary-layer interaction considering sidewall effects. Journal of Fluid Mechanics 767, 526–561.