Trust
and Expected Trustworthiness:
An experimental investigation
WPS/2001.12
Abigail Barr
Centre for the Study of African Economies University of Oxford
January 2001
Acknowledgements: Many thanks to Michael Shambare for his tireless efforts in the
field. Thank you also to Bill Kinsey for introducing me to the villages where the experiments were conducted and to the participants of the MacArthur Foundation Conference on Cross-Cultural Experimental Economics and CSAE members who offered invaluable comments. Finally, I owe a huge debt of thanks to the villagers who took part in the study. All remaining errors are my own. This research was funded by the Department for International Development through ESCOR grant R7650.
Abstract: An economic experiment involving separate sessions in 24 small, tightly knit
communities reveals that trust is higher where greater trustworthiness is expected and lower variance in levels of trustworthiness is perceived. A model in which potential trusters behaviour is likened to a risky investment explains nearly fifty percent of the variation in their behaviour between communities. The predicted relationships continue to exist following the introduction of an additional, important variable relating to resettlement into the model, although the precise forms of the relationships vary between different types of community. The 24 communities are all Zimbabwean, 18 resettled and 6 not.
Key words: trust, trustworthiness, field experiment, Zimbabwe, resettlement
1. Introduction
Trust, we are told, is valuable. It ‘is an important lubricant of a social system. It is extremely efficient; it saves a lot of trouble to have a fair degree of reliance on other people’s word’ (p. 23, Arrow (1974)). Empirically trust has been associated with well functioning formal institutions and governments, the emergence of large organisations able to reap returns to scale, and with higher rates of economic growth (Fukuyama (1997), LaPorta, Lopez-de-Silanes, Shleifer and Vishny (1997), Knack and Keefer (1997)). But what is trust and is it an appropriate focus for our interest? Definitions of trust generally contain two components. The first is vulnerability: an act of trust involves putting oneself in a vulnerable position in the hope of gaining a positive benefit as a result. The second is expectation: the potential truster bases his decision on an expectation about whether the potential trustee will exploit his vulnerability, given that the trustee faces a ‘raw’, as Bacharach and Gambetta (1999) would call it, incentive to do so. Thus, Gambetta (1988) describes trust as ‘a threshold point, located on a probabilistic distribution’ (pg. 218). The first component describes the type of situation in which it is appropriate to talk about trust and is the subject of a debate that I describe briefly below. The second relates to its nature. It is on this second, uncontested component that I wish to focus. If trust is no more than an expectation, to describe it as valuable in and of itself is inappropriate. It is trustworthiness that is of value as an aid to efficiency, while trust’s value, like that of other expectations, depends on its accuracy, i.e., on whether it is well placed.
An expectation is formed with reference to an information set that contains some or all of the information that is relevant to the possible future outcomes. This information set affects behaviour through an expectation-forming process. Thus, ceteris paribus, if variations in the content of an information set are associated with variations in behaviour, it can be taken as evidence that an expectation has been formed and is affecting behaviour. With this in mind, the experimental economics literature does provide some evidence that trust is a form of expectation. So, for example, Burg, Dickhaut, and McCabe (1995) (BDM) show how trusters adjust their behaviour in a one-shot investment game following the expansion of their information set to include the results of earlier investment games, while Yamagishi and Kakiuchi (2000) show how trust develops between pairs of players in a modified repeated prisoner’s dilemma game following the expansion of their information set as play progresses.
While interesting, both of these results relate only to the formation of expectations within the context of the experiment being conducted. Thus, both the decision faced by the players and their information sets are limited in terms of their complexity. This is quite different to the situations faced by people in everyday life; they are likely to have more information about potential trustees but to face the problem of deciding what is believable, what is relevant, and what weights to apply to possibly contradictory information.1 This paper looks at whether people use information gleaned during everyday life to construct trust-like expectations.
One way to do this would be to bring ready-made social relations into the context of the experiment. Then one could investigate whether players use the information learnt during the course of the relations as a basis for their expectations within an experimental situation involving trust. Glaeser, Laibson, Scheinkman, and Soutter (1999) conducted
1 See Bacharach and Gambetta (2000) for an interesting exploration of the complexity of the problem faced by potential trusters.
such an experiment. Prior to playing an investment game similar to that devised by BDM, they introduced the pairs of players and then asked how well and by what means they knew each other. They found that the level of investment by trusters increased with the degree of social connection between the players and argued that this was because of greater opportunities for post-play punishment. Following Dasgupta (1988), the authors interpreted this finding as evidence that social relations and the associated information led to enhanced trust. However, this interpretation would be contended by other authors. Some, including Hardin (1991) and Yamagishi and Yamagishi (1994) would argue that the social relations in Glaeser et al.’s experiment are reducing the need for rather than increasing trust because the opportunity for post-play punishment reduces the vulnerability of players who choose to invest. Other authors recognise the need to distinguish trusting behavour based on an ability to deter, from trust that has no such basis, while still referring to the former as trust. Thus, Weber (1968[1922]) and Shapiro, Sheppard and Cheraskin (1992) would say that the relations in Glaeser et al’s experiment enhance ‘enforceable trust’ or ‘deterrence-based trust’ respectively. This debate is salient to my question as an expectation based on the knowledge that one can deter non-reciprocation is entirely different from an expectation based only on information about the disposition of a person. There are certain advantages to focusing on the latter, not least of all because it can serve as a baseline: trust in the absence of any other mechanism that could facilitate cooperation. This makes it a good place to start the current investigation and renders it necessary to find an alternative research approach to that of Glaeser et al.
To this end, I present the findings from an economic experiment in which social relations and associated information are brought into the context of an economic experiment in such a way that the vulnerability of those who choose to behave in a trusting manner is nevertheless maintained. The experiment, which involved BDM’s one shot investment game, was played in 24 small, tightly knit, communities. In each of the 24 community-specific sessions the players did not know the precise identity of the person they were paired with but did know that it was someone from their own community. Hence, while there was no easy means at their disposal to deter untrustworthy behaviour, they would have had some information emanating from their everyday lives about the dispositions of the pool of people from which their partner was drawn. The results of this experiment suggest that people do indeed use information gleaned during their everyday lives to create expectations and guide their decisions in strategic situations. In communities where trustworthiness waslow, players behaved in a less trusting manner. In addition, consistent with the joint hypothesis that players are risk averse and take account of information gleaned during their everyday lives, in communities where there was a higher variance in trustworthiness, players behaved in a less trusting manner.
Before proceeding, it is useful to dwell briefly on what this paper is not about. Throughout the analysis I simply take it as given that people behave trustworthily to varying degrees. This renders it rational to, at least, contemplate trusting behaviour. For discussions about the origins and rationality of trustworthiness see, for example, Hardin (1991), Hausman (1998), and Bacharach and Gambetta (2000).
The paper contains five sections. Following this introduction, section 2 contains a description of the experimental design. In section 3 I describe the framework used in the data analysis. The results are presented in Section 4. After briefly describing the data,
this section provides a circumspect comparison of my results with those of BDM and another US replication of the investment game by Cox (2000). Then comes a more detailed analysis of trustees’ behaviour in the 24 Zimbabwean communities. This feeds into the analysis of the Zimbabwean trusters’ behaviour which generates the key results of the paper. Finally in this section, I exploit the fact that 18 of the 24 villages are the consequence of a resettlement exercise to explore the robustness of these key results. Section 5 concludes with some comments about the implications of the results for past and future research.
2. Experimental Design
BDMs investment game is a one shot game played by pairs of subjects. Both players are given an initial endowment of money. The first player has the option of giving some of his/her money to the second player, i.e., of making an investment. Whatever he/she chooses to invest is tripled before being given to the second player. The second player then has the option of giving some portion of the tripled amount back to the first player. The one-shot nature of the game combined with player anonymity, implies that there is no possibility that reputation mechanisms based on repeated interactions, contractual pre-commitments or potential threats of punishment are generating the results. It ensures that first players who chose to invest more than zero are vulnerable to exploitation by the second player. The more they invest, the greater their potential return, but the greater their vulnerability.
In my version of the game each player’s initial endowment was 20 Zimbabwean dollars units and all play was conducted in Zim$5 notes.2 Thus, the first player had to choose s 0 S, where S = {0, 5, 10, 15, 20}. The choice of s by the first player determined the '(s) subgame, in which the second player chose r 0 R, where R(s) = {0, 5, 10, 15, ..., 3s}. This game was played once in each of 24 sessions. Each session was held in a different Zimbabwean village. Each player was paired with someone from their own village and informed accordingly. In each village there were between 4 and 11 pairs of volunteers playing the BDM game. A total of 141 pairs played this game. In every session there were other volunteers present who were playing an ultimatum game instead. Each volunteer came from a different household and attended the experimental session in their own village.3 Just under half of the volunteers (47 percent) were female and just over half (52 percent) were heads of households. The allocation of partners, games and roles was determined randomly prior to the start of each session.
Because of the relatively low level of education and the potentially high incidence of illiteracy among subjects, experimenters working in developing countries have to adopt procedures that deviate significantly from those typically adopted in Europe and the US. I adopted a procedural design similar to Henrich’s (2000). During a pilot exercise a
2 This lead to average earnings of approximately half a day’s casual wage. The exchange rate at the time of the sessions was in the region of 50 Zim $ per GB pound.
3 The households from which the players originate are participants in an on-going assessment of the effects of resettlement in Zimbabwe. Each household in the assessment was asked to send one adult (above the age of 14) volunteer to the session in their village. In 13 of the villages the assessment and, hence, the experiment involve all households. In the remaining 11 a random sample of households is involved. The chairman or headman of each village was charged with the duty of ensuring that the volunteers arrived at the session. They were told that the volunteers would be playing games and could win some money.
script for the game was developed in Shona, the local language in all the villages. 4 The script contained three components: a detailed and repetitive description of the game; a set of examples and questions showing how particular combinations of decisions yield particular pay-offs for each player; and, for second players only, a description of what their corresponding first players had decided to do. One set of examples was used for all first players and another for all second players. These were designed to demonstrate the key features of the games, while minimising the extent to which players might be led to behave in a certain way. Once the pilot was over the script was closely adhered to. When players had questions, the relevant part of the script was repeated. Players who could not demonstrate that they understood were not allowed to play. The need to test players’ understanding verbally rendered a double blind procedure impractical. Hence, potential subject-experimenter effects had to be considered.5 To minimise the impact of such effects on the comparative results, great care was taken to follow the same procedure with each player. This notwithstanding, different subject-experimenter effects on male and female players could have biased the results.6 The proportion of women volunteers varied from 14.3 percent to 81.3 percent across village sessions. Econometric methods were used, ex post, to test and control for this possible source of bias.
In each session the players of both games were gathered together. One-by-one they were called to meet with the experimenter and a Shona-speaking research assistant (RA) in private. In order to avoid player contamination the players were told nothing about the games prior to their individual meetings with the experimenter and RA. Within villages, those who had already played were not allowed contact with those who were still waiting. Where there was a risk of contamination between villages, sessions were held on the same or consecutive days. Interviews with players and other villagers indicated that between-village contamination did not occur. Finally, in the villages where there were relatively few players, their sense of anonymity might have been partially compromised.7 While no experimental solution could be applied, econometric methods were used, ex post, to test and control for this possibility.
3. Analytical Framework
If trust is, in essence, an expectation then we should be able to model first player’s behaviour as an investment decision under uncertainty. Thus, let the random variable
r
~ with probability distribution S defined on R(s) represent a the first player’s expectation of the amount that will be returned by the second player in subgame '(s). Assuming that their utilities can be represented by a constant relative risk aversion utility function, the first players’ problem can then be written as
(
)
− − + − − Ω g r s E g s 1 1 ~ 20 max 1(1)
where g is the coefficient of relative risk aversion. This implies that the chosen s will depend positively on the expected value of r~ and, if the players are risk averse,
4 Data from the 16 pairs of players in the pilot have been included throughout the analysis. Excluding these observations from the analysis does not alter any of the conclusions.
5 Hoffman et al. (1994) provide evidence that subject/experimenter anonymity affects behavior. However, Roth (1995) reviews several other studies that report the opposite.
6 Eagly and Crowley (1986) found that subject-experimenter effects can differ for men and women. 7 Hoffman et al. (1996) show that reduced subject/subject anonymity leads to greater observed generosity.
negatively on the perceived variance of r~ . Linearizing the resulting investment function yields s = "0 + "1E(r~ ) + "2 2 ~ r σ (2)
If the theory holds, when this function is estimated, "1 will be positive and, if the players are also risk averse, "2 will be negative.
Data on each first player’s expectation and perceived variance of r~ does not exist.
However, the design of the experiment is such that the actual responses of the second players can be used to construct proxies for both E(~ ) and r 2
~
r
σ . This approach is potentially problematic as the set of possible responses from which each second player chooses is determined by the choice made by the corresponding first player. Thus, using second players’ actual responses to construct an explanatory variable to include in the analysis of first players’ behaviour could lead to problems of reverse causality and endogeneity. An alternative base for these two explanatory variables is the proportional response, i.e., the ratio r/s. This is attractive for two reasons. First, certain values of the proportional response lend themselves to easy interpretation. A proportional response of zero corresponds to self-interested, money maximization, a proportional response of one corresponds to what one might call ‘pure reciprocity’, i.e., returning exactly what was given, and a proportional response of two corresponds to what one might call ‘pure sharing’, i.e., to dividing the total money in the game equally.8 These focal points might be as attractive to the players as they are to the author and so assume an important role in determining their behaviour and expectations. Second, the ratio r/s is bound by 0 and 3, whatever the value of s. This reduces but does not eliminate the possibility of a reverse causal link; a second player might give a higher proportional response to a more trusting first player. To eliminate this possibility, I conduct an analysis of second player behaviour, estimating both
r = b0 + b1s + e1 and
s r
= c0 + c1s + e2 (3a, 3b)
where the error terms, e1 and e2, are assumed to be i.i.d. normal, before moving on to the
analysis of first player behaviour. As long as r/s is found not to depend on s, this analysis can be based on an estimation of the following
0 1 2 var e3 s r a s r a a s + + + = (4)
where s is the village mean first players’ choice, (r/s) is the village mean proportional response by second players, var(r/s)is the village-level variance in the proportional responses, and e3 is assumed to be i.i.d. normal. This analysis must be conducted at the
village level because of the way in which the explanatory variables are constructed. If a1
is significantly greater than zero it lends support to the idea that first players are forming expectations and investing accordingly, i.e., that trust is an expectation. If a2 is
significantly less than zero it lends further support to these ideas, while also indicating that the players are risk averse.
8 After the first player has chosen s, she has 20 – s and the second player has 20 + 3s making the total money in the game 40 + 2s. If the second player chooses to return r = 2s (a proportional response of 2), she is left with 20 + s and the first player ends up with 20 – s + 2s = 20 + s.
Each of the equations is estimated as it is presented above and then re-estimated including female, a dummy which takes the value one for female players and zero otherwise, and session, the number of volunteers present in the session that the player attended, as additional explanatory variables. In some cases still further specifications are presented in order to explore issues relevant to the primary investigation.
4. Results
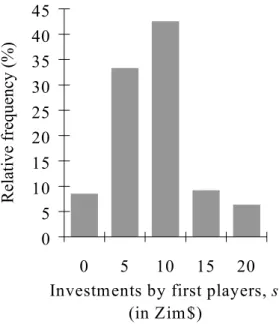
Figure 1 shows the distribution of investments made by the 141 first players. There is one modal investment at Zim$10, half of the initial endowment. Figure 2 shows the distribution of proportional responses made by the 129 second players who received positive, tripled investments. There are three modes at zero, one, and two, indicating that these values did indeed serve as focal points for the players. Whether this is because these values are associated with behavioural norms remains to be seen, although the following comparison suggests not.
4.1 Comparison with results of other BDM games
Table 1 contains comparable summary statistics for the Zimbabwean BDM games and those conducted in the US by BDM and Cox (2000). Due to the impracticality of a double blind procedure in Zimbabwe, one must exercise caution when conducting the comparison. This notwithstanding, the comparison serves as a useful check on whether efforts to make the game comprehensible to Zimbabwean villagers, who rarely act anonymously or face situations in which payoff’s depend on abstract mathematics, succeeded.
Both BDM and Cox observed very few first players investing zero (6 and 3 percent respectively). A marginally greater proportion (9 percent) of the Zimbabwean first players invested nothing. Further, the mean investment by Zimbabwean first players was lower as a proportion of their initial endowment than those observed in the two US experiments (43 percent as opposed to 52 and 60 percent). On average, second players in the BDM experiment returned less than the first players invested (0.89), while those in Cox’s and the Zimbabwean games returned more (1.17 and 1.28 percent respectively). The Zimbabwean second players returned a marginally higher proportion than Cox’s.
Finally, the tri-modal distribution observed in Figure 2 is not present in either the BDM or Cox’s data. The former has a mode at zero only and in the latter over fifty percent of the second players’ proportional responses fall between one and two and twenty percent fall between zero and one. This casts some doubt on the hypothesis that the tri-modal distribution in Zimbabwe is the result of ‘competition’ between behavioural norms. Instead, it could be due to the measures taken to ensure that players understood the game. While efforts were made to minimise the extent to which we biased players’ responses to any one of the focal responses, they did feature heavily in the examples because they involved easier mathematics. This notwithstanding, the results of the comparison give us no reason to doubt the understanding of the Zimbabwean players.
4.2 The trustworthiness of the second players
Table 2 contains the results of a series of regressions based on the responses of the 129 second players who received positive tripled investments from their respective first players. The top half of the table contains the regressions that take r, the amount of money returned by the second player, as the dependent variable. The bottom half of the table contains the regressions that take r/s, the proportional response, as the dependent variable. The regressions in the first column correspond exactly to equations (3a) and (3b) above. The coefficient on s is significantly greater than zero (0.01 level) in the regressions that takes r as its dependent variable and indistinguishable from zero (0.1 level) in the regression that takes r/s as its dependent variable. Allowing standard errors to vary between villages does not significantly alter these results. Introducing the square of r as an additional explanatory variable neither alters these results nor improves the fit of the model.
In the second column female and session are included as additional explanatory variables. Both have negative and significant coefficients, although the coefficients on
session become insignificant if the standard errors are allowed to vary between villages. In the third column session is replaced with a set of village dummies. In both regressions these are jointly significant (0.1 level for r and 0.05 for r/s) indicating that there is significant variation in second player behaviour between villages. Allowing standard errors to vary between villages does not significantly alter these results.
4.3 The investment behaviour of the first players
Given no evidence that r/s depends on s, we can use the former to derive explanatory variables for our analysis of first players’ behaviour. Table 3 contains the results of a series of regressions based on the investments made by the 141 first players. Before turning to the estimation of equation (4), consider the individual-level regression in the first column of Table 3. Here, female and a set of village dummies are the only explanatory variables. The dummies are jointly highly significant (0.001 level), while the coefficient on female is insignificant. The apparent irrelevance of our only individual-level variable combined with evidence of significant between-village variations indicates that little information will be lost as we move to the village-level analysis.
The regressions in the second column of Table 3 correspond exactly to equation (4). The coefficient on (r/s) is positive and significantly greater than zero (0.05 level) and the coefficient on var(r/s)is negative and significantly less than zero (0.1 level). In the third column femalep, the proportion of females among first players from that village, and session are introduced. This does not alter the main results although the coefficient on session is positive and significant (0.1 level).
These results support the hypotheses that first players’ behaviour can be modelled as a risky investment, that they are risk averse, and that trust is essentially an expectation. It also indicates that strategic information is accumulated as a result of village life.
4.4. Testing the robustness of the key results
One way to further test the verisimilitude of this model is to introduce additional, potentially important, variables into the analysis. Here, I use the fact that 18 of the 24 villages are the result of a resettlement exercise that took place in the early 1980s, to generate an additional village-level variable, resettled, that takes the value one for resettled villages and zero otherwise. The resettled villages differ from their traditional counterparts in many ways. Most importantly in the context of the current analysis, while in traditional Zimbabwean villages everyone is related to everyone else by blood or marriage with very few exceptions, in the resettled villages included in the study this is not the case. This is because the resettlement in the early 1980s involved applications by individual households, who were then assigned to villages with no regard for the whereabouts of their kinsmen. Exceptions to this rule are rare.
Using this variable, I seek to answer two questions. First, and most importantly, do the key results presented in section 4.3 continue to hold following the inclusion of another, potentially important, variable in the model? And second, can variations in first player behaviour between traditional and resettled villages be explained in terms of movements along the functions estimated in section 4.3? The potential importance of resettlement is evident from the comparison of the mean levels of investment in traditional and resettled villages presented in Table 4. The mean investments by first players in traditional and resettled villages are Zim$10.47 and Zim$8.03 respectively and the difference is significantly greater than zero (0.05 level). That there is a difference between the two distributions is confirmed by the result of an Epps-Singleton test.9
The first column of Table 5 presents the results of a regression that includes resettled
as and additional explanatory variable. Including this variable does not alter the key results presented above. However, the coefficient on the resettled dummy is significantly greater than zero (0.1 level). In the second column, in an effort to preserve scarce degrees of freedom, femalep and session are excluded. The significance of
resettled increases as a result. Then, in the third column two interaction terms, one between resettled and (r/s) and one between resettled and var(r/s), are introduced. The coefficients on both of these interaction terms are significant (0.05 level and 0.1 level respectively). Their inclusion also increases the significance of the coefficients on
) /
(r s and resettled, although the coefficient on var(r/s) is rendered insignificant. Further, the fit of the model has improved considerably. It now explains nearly 50 percent of the variation if first players’ behaviour between villages.
These results suggest that variations in first player behaviour between traditional and resettled villages cannot be explained in terms of movements along the functions estimated in section 4.3 above. Instead, the difference in first player behaviour between traditional to resettled villages is associated with a change in the position of the estimated functions. Resettled villagers, while positively and positively responsive to increases in the expected trustworthiness (0.1 level), are less so than traditional
9 The Epps-Singleton (1986) test is a very powerful non-parametric test that is based on the difference between the characteristic functions of the two samples being compared.
villagers.10 In contrast it is only resettled villagers that are negatively and significantly responsive to increases in the variance of trustworthiness (0.1 level).11
5. Conclusions and Final Comments
This analysis suggests that trust can be appropriately characterised as an expectation. In villages where first players might reasonably expect second players to be more trustworthy, they invest more. Further, consistent with the joint hypothesis that first players are risk averse and trust is an expectation, in villages where first players might reasonably perceive a higher variance in second players’ responses, they invest less. These relationships continue to exist even after a distinction is made between resettled and traditional villages. However, they vary between the two village types. Whether this is because the expectation forming process varies or the preferences with which it combines to yield player’s decisions varies remains to be seen. Additional research in this area could further improve our understanding of the cognitive processes and the preference parameters with which trust is associated.
That trust is appropriately modelled as an expectation indicates that we should revisit some of the earlier empirical results relating higher trust to better economic outcomes. These results are generally based on answers to the World Values Survey question ‘In general do you believe that people can be trusted?’ answers too which relate more closely to the trustworthiness of the respondents than to their degree of trust in others (Glaeser el al (1999)). Hence, the revisit would primarily involve rewriting the conclusions so that they link greater trustworthiness rather than higher trust to better economic outcomes.
The revisit would also need to take account of another issue. Recall that as an expectation, the value of trust depends on it being well placed. Further, the ‘accuracy’ of trust may have a bearing on the realized value of trustworthiness. If an individual or group are trustworthy, but this is not perceived accurately by potential trusters, then potentially beneficial exchanges with the individual or group may not take place. That responses to the WVS question are linked with better economic outcomes implies that trust is at least sometimes well placed, but it tells us nothing about the opportunities that are missed and the costs that are incurred when trust is misplaced. Further, it tells us nothing about the cognitive processes that are associated with placing trust well. To the author’s knowledge, only the study by Bacharach, M., and Gambetta, D. (2000) addresses such issues of cognition and, even then, only theoretically. The results reported above suggest that this could be a fruitful avenue for future empirical research. REFERENCES
Arrow, K. J. (1974). The Limits of Organization, New York: W. W. Norton and Co. Bacharach, M., and Gambetta, D. (2000). ‘Trust in signs’ in Cook, K (ed) Trust and Social Structure, New York: Russell Sage Foundation, forthcoming.
10 Reported level of significance is based on an F-test of the hypothesis that the coefficient on (r/s) and the coefficient on the interaction between (r/s) and resettled sum to zero.
11 Reported level of significance is based on an F-test of the hypothesis that the coefficient on
) /
Berg, J., Dickhaut, J., McCabe, K. (1995). ‘Trust, Reciprocity, and Social History.’
Games and Economic Behavior, vol. 10, pp. 122-42.
Cox, J. (2000). ‘Trust and Reciprocity: Implications of Game Triads and Social Contexts.’ mimeo, University of Arizona.
Dasgupta, P. (1988). ‘Trust as a commodity.’ in Gambetta, D. (ed.) Trust: Making and Breaking Cooperative Relations. Oxford: Basil Blackwell.
Eagly, A. H., Crowley, M. (1986). ‘Gender and Helping Behavior: A Meta-Analytic review of the Social Psychological Literature.’ Psychological Bulletin, vol. 100, pp. 283-308.
Epps, T. W., and K. Singleton (1986). ‘An Omnibus Test for the Two Sample Problem Using the Empirical Characteristic Function.’ Journal of Statistical Computation and Simulation, vol. 26, pp. 177-203.
Fukuyama, F. (1995). Trust, New York: Free Press.
Gambetta, D. (1988). ‘Can we Trust Trust?’ in Gambetta, D. (ed.) Trust: Making and Breaking Cooperative Relations. Oxford: Basil Blackwell.
Glaeser, E., Laibson, D., Scheinkman, J., Soutter, C. (1999). ‘What is Social Capital? The Determinants of Trust and Trustworthiness.’ NBER Working Paper No. 7216. Hardin, R. (1991). ‘Trusting Persons, Trusting Institutions.’ in Zeckhauser, R. J. (ed.)
Strategy and Choice, MIT Press, Cambridge, MA, 1991.
Hausman, D. (1998). ‘Trust, Preferences, and Interest.’ London School of Economics working paper.
Henrich, J. (2000). ‘Does Culture Matter in Economic Behaviour? Ultimatum Game Bargaining Among the Machiguenga of the Peruvian Amazon.’ forthcoming American Economic Review.
Hoffman, E., McCabe K., Shachat, K., Smith, V. (1994). ‘Preferences, Property Rights and Anonymity in Bargaining Games.’ Games and Economic Behavior, vol. 7, pp. 341-61.
Hoffman, E., McCabe K., Smith, V. (1996). ‘Social Distance and Other-Regarding Behavior in Dictator Games.’ American Economic Review, vol. 86, pp. 653-60.
Knack, S., Keefer, P. (1997). ‘Does Social Capital Have an Economic Payoff? A Cross-Country Investigation.’ Quarterly Journal of Economics, vol. 112, pp. 1251-1288. LaPorta, R., Lopez-de-Silanes, F., Shleifer, A. and Vishny, R. (1997). ‘Trust in Large Organizations.’ American Economic Review: Papers and Proceedings, vol. 87, pp. 333-338.
Roth, A. E. (1995). ‘Bargaining Experiments.’ in J. Kagel and A. E. Roth, eds.,
Handbook of Experimental Economics, Princeton: Princeton University Press, pp. 253-348.
Shapiro, D. L., Sheppard, B. H. and Cheraskin, L. (1992). ‘Business on a Handshake.’
Negotiation Journal, vol. 8, pp. 365-377.
Weber, M. (1968 [1922]). Economy and Society, Ross, G. and Wittich, C. (eds), Berkeley, CA: University of California Press.
White, H. (1980), ‘A Heteroscedasticity-Consistent Covariance Matrix Estimator and a Direct Test for Heteroscedasticity’, Econometrica, Vol. 48.
Yamagishi, T., and Kakiuchi, R. (2000), ‘It takes Venturing into a Tiger’s Cave to Steal a Baby Tiger: Experiments on the Development of Trust Relationships’, in Raub, W., and Weesie, J. (eds) The Management of Durable Relations. Thela Thesis Publishers. Yamagishi, T., and Yamagishi, M. (1994), ‘Trust and Commitment in the United States and Japan’, Motivation and Emotion, vol. 18, pp. 129-166.
Table 1. Comparison of Behaviour in Investment Game observed by Berg et al (1995), Cox (1999) and in Zimbabwe
Berg et al (1995)
(no social history) (strong social context) Cox (1999) Zimbabwe
Number of playing pairs* 32 30 141
Initial endowment size 10.00 US $ 10.00 US $ 20.00 Zim $
Proportion of first players
who invested zero 0.06 0.03 0.09
Mean investment by first
players 5.16 US $ 6.00 US $ 8.58 Zim $
Mean investment as a
proportion of stake 0.52 0.60 0.43
Mean response (expressed as
a proportion of investment) 0.89 1.17** 1.28 * Responses are made by second players only when first players invest more than zero.
** Supplied by J. Cox.
Table 2: Analysis of Second Players’ Responses
1 2 3
Coef. s.e. Coef. s.e. Coef. s.e.
Dependent variable = r (money returned by second players)
Constant 0.371 1.629 4.957 2.333 * 5.403 4.997
s 1.237 0.179 *** 1.270 0.173 *** 1.026 0.211 ***
female -3.384 1.462 ** -3.370 1.559 **
session -0.155 0.074 **
Joint sig. of village dummies - - 0.0001
Number of observations 129 129 129
R2 0.283 0.325 0.492
Dependent variable = r/s (proportional response)
Constant 1.286 0.232 *** 1.866 0.328 *** 2.038 0.058 *
s -0.001 0.019 0.004 0.018 -0.025 0.023
female -0.352 0.177 ** -0.312 0.188 *
session -0.021 0.010 **
Joint sig. of village dummies - - 0.0001
Number of observations 129 129 129
R2 0.000 0.055 0.301
Notes: All standard errors have been corrected using White’s (1980) procedure. *** - significant at 0.01 level, ** - significnat at 0.05 level, * - significant at 0.1 level.
Table 3: Analysis of First Players’ Investments
2 3 4
Coef. s.e. Coef. s.e. Coef. s.e.
Constant 4.077 1.921 ** 8.344 1.316 *** 3.892 2.183 * ) / (r s 1.922 0.839 ** 1.941 0.901 ** ) / var(r s -2.474 1.251 * -2.640 1.492 * female -0.128 0.884 femalep 3.993 2.534 session 0.135 0.067 *
Joint sig. of village dummies 0.0003 - -
Number of observations 141 24 24
R2 0.349 0.183 0.331
Notes: All standard errors have been corrected using White’s (1980) procedure. *** - significant at 0.01 level, ** - significant at 0.05 level, * - significant at 0.1 level.
Table 4: Comparison of Mean First Player Behaviour Between Traditional and Resettled Villages
Traditional Villages Resettled Villages
Number of playing pairs 32 109
Mean investment (Zim$) 10.47 8.03
Standard deviation (sd) of investments 5.44 4.57
Levene’s test for equality of sd
(p-value) 0.504
t-test for equality of mean equal sd
assumed (p-value) 0.012
Epps-Singleton test for equality of
distribution (p-value) 0.000
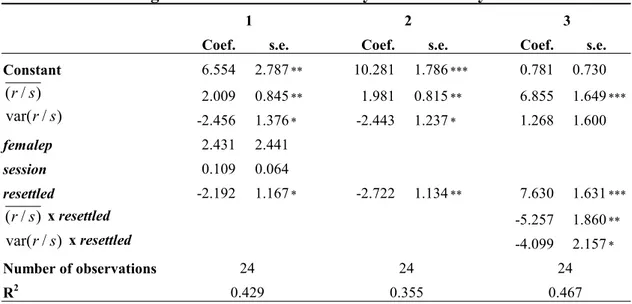
Table 5: Introducing Resettlement into the Analysis of First Players’ Investments
1 2 3
Coef. s.e. Coef. s.e. Coef. s.e.
Constant 6.554 2.787 ** 10.281 1.786 *** 0.781 0.730 ) / (r s 2.009 0.845 ** 1.981 0.815 ** 6.855 1.649 *** ) / var(r s -2.456 1.376 * -2.443 1.237 * 1.268 1.600 femalep 2.431 2.441 session 0.109 0.064 resettled -2.192 1.167 * -2.722 1.134 ** 7.630 1.631 *** ) / (r s x resettled -5.257 1.860 ** ) / var(r s x resettled -4.099 2.157 * Number of observations 24 24 24 R2 0.429 0.355 0.467
Figure 1: Investments by first players (s) 0 5 10 15 20 25 30 35 40 45 0 5 10 15 20
Investments by first players, s
(in Zim$)
Relative frequency (%)
Figure 2: Responses by second players (r/s)
0 5 10 15 20 25 30 r/s=0 0<r/s<1 r/s=1 1<r/s<2 r/s=2 2<r/s
Proportional responses by second players, r/s