Developing a Log File Analysis Tool: A Machine
Learning Approach for Anomaly Detection
University of Oulu
Faculty of Information Technology and Electrical Engineering / Information Processing Science
Master’s Thesis
Tapio Anttila 3.6.2020
Abstract
Log files, which record information about all events during the execution of a software, are important in troubleshooting tasks. However, modern software systems produce large quantities of complex logs, and their manual inspection is laborious and time-consuming. Therefore, technologies such as machine learning have been used to automate log file analysis. Anomaly detection is an especially popular approach, since anomalies in the log files are typically caused by erroneous behaviour of the software. In this study, open source data mining and machine learning solutions are utilized to process log files collected from devices running embedded Linux. Following the Design Science Research methodology, a Python program called sgologs is developed. The tool uses components from logparser and loglizer toolkits to pre-process the input log file, train an unsupervised machine learning model, and detect anomalies on the input file. The loglizer tools have not been used with Linux logs in previous research, possibly because they are rather difficult for automated processing. This finding is verified in this study as well, as the measured anomaly detection accuracy scores are quite modest. Nevertheless, sgologs is able to detect anomalies in the log files, with swift processing times, at least when certain things are taken into consideration. If the user is aware of these factors, sgologs can definitely point towards real anomalies in the Linux log files. Thus, the tool could be used in real-life settings to simplify debugging tasks, whenever logs are used as a source of information.
Keywords
Log file analysis, Linux log files, anomaly detection, machine learning, unsupervised learning, log parsing, design science research
Supervisor
Foreword
This thesis has been a pervasive part of my life for the past eight months, and I am very grateful to all who have helped me in laying it to rest. Thanks to my bosses at work, Jyrki Kennilä, Timo Pyhäluoto, and Jesse Pasuri, for arranging my duties so that I can focus on the thesis. Thanks to my colleagues Markku Ahvenjärvi and Veikko Rytivaara for throwing ideas around and kicking off this project.
Thanks to all my peer reviewers for insightful comments, and to Ari Vesanen for the scrutiny. Thank you Antti Siirtola, my thesis supervisor, for providing constant feedback and keeping this study on track. I express my gratitude especially to Satu and Eveliina Anttila for providing me with better working conditions than I could have hoped for, and for keeping me up and running with all the joy they bring into my life.
Tapio Anttila Oulu, June 3, 2020
Contents
Abstract ... 2 Foreword ... 3 Contents ... 4 1. Introduction ... 5 2. Research Problem ... 82.1 Background and objectives for a solution ... 8
2.2 Research questions ... 9
3. Research Methods ... 11
3.1 Design Science Research ... 11
3.2 The DSR guidelines and process ... 13
4. Literature Review ... 17
4.1 Machine learning ... 17
4.2 Log-based anomaly detection ... 18
4.2.1 Log parsing phase ... 19
4.2.2 Feature extraction phase ... 20
4.2.3 Anomaly detection phase... 21
5. Existing tools for Log-based Anomaly Detection ... 23
5.1 logparser ... 23
5.2 loglizer ... 23
6. Description of the Dataset ... 26
6.1 Pre-processing the initial data ... 26
6.2 The final dataset ... 26
7. First Iteration: Using the logparser Toolkit ... 27
7.1 Testing LenMa ... 27
7.2 Testing SHISO ... 28
7.3 Testing AEL ... 28
7.4 Parsing the subset ... 28
8. First Iteration: Using the loglizer Toolkit ... 30
8.1 Sequence determination ... 31
8.2 Training and test data ... 32
8.3 A walkthrough of loglizer ... 34
8.4 Evaluation of sgologs_alpha ... 36
8.4.1 Using Time sequences and SHISO logs ... 36
8.4.2 Using Time sequences and AEL logs ... 39
8.4.3 Using PID sequences and SHISO logs ... 41
8.4.4 Using PID sequences and AEL logs ... 42
8.5 Summary of the first iteration ... 43
9. Second Iteration ... 45
9.1 Changes to sgologs_alpha ... 46
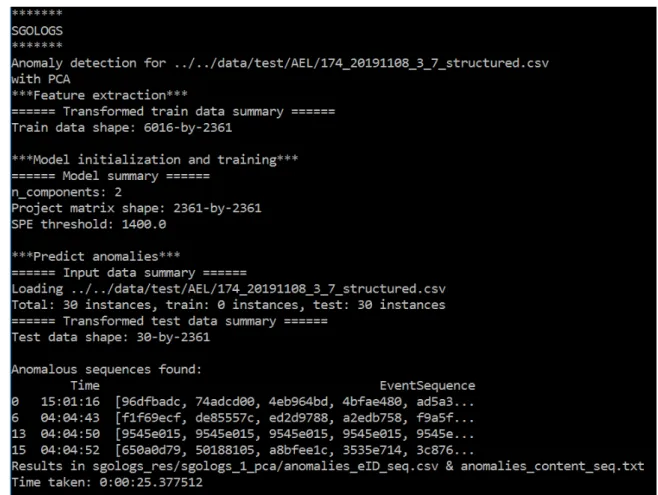
9.2 Evaluation of sgologs ... 46
10. Discussion ... 51
10.1 Answers to the research questions ... 51
10.2 Other considerations ... 54
11. Conclusion ... 56
11.1 Limitations ... 57
11.2 Future research ... 57
1.
Introduction
This Master’s Thesis is about the development of a log file analysis software tool, with the principal function of detecting anomalies. Taking advantage of existing solutions based on machine learning (e.g. S. He, Zhu, He & Lyu, 2016), the developed tool, dubbed sgologs, processes log files from an embedded Linux device, and finds unusual log entries which may indicate abnormal behaviour of the software. Thus, the burden of debugging erroneous behaviour based on log files is mitigated.
A colleague of mine at a midsized ICT company was recently tasked with finding a rare bug in one of our products. Since log files record every single event that is carried out (Landauer, Wurzenberger, Skopik, Settani, & Filzmoser, 2018), with time and state data, they are a natural first stop in the debugging process. However, inspecting the log files is very cumbersome: the behaviour of modern software systems tends to be too complex for a single developer to comprehend, and the sheer volume of logs makes the task extremely time-consuming (S. He et al., 2016). The colleague figured his work would be much more efficient if a software tool would find the anomalies for him, automating the process, resulting in the idea behind this study.
This study utilizes existing, open-source solutions for log-based data mining and anomaly detection. The existing solutions are toolkits, which include several implementations of different methods. The first toolkit is logparser, developed by P. He, Zhu, He, Li and Lyu (2016) and Zhu et al. (2019). The second toolkit is loglizer, developed by S. He et al. (2016). The existing tools are extensively tested in the context of Linux log files, a topic only briefly noted in Zhu et al. (2019). More specifically, the applicability and performance of unsupervised machine learning methods (discussed more in section 4) with Linux logs are thoroughly investigated in this study.
Other methods than machine learning, e.g. a deterministic algorithm searching for certain keywords or sequences, could be used for the anomaly detection. However, one advantage of machine learning is that it is able to detect previously unknown anomalies (Geijer & Andreasson, 2015). In other words, creating a comprehensive set of keywords for an algorithm to look for would require that all possible anomalies are already known, and new types of anomalies not yet encountered by the creator of the keywords could not be detected. Some argue that focusing only on significant words is not sufficient for a thorough analysis of a system (Landauer et al., 2018). Moreover, systems and their behaviour change over time, changing also the definition of normal behaviour; machine learning can react to such changes, and retain its accuracy (Landauer et al., 2018; Geijer & Andreasson, 2015).
A few of my colleagues and I have discussed the possibilities of the log file analysis software, and we believe that such a tool could be very useful to numerous people here at our company. In addition, this study contributes to research on log-based anomaly detection, but in the specific context of Linux log files.
Log-based anomaly detection endeavours often benefit from unsupervised machine learning for practical reasons (Geijer & Andreasson, 2015). Machine learning algorithms need training material, which can be labelled, i.e. all instances are manually
marked as normal or anomalous (Pietikäinen & Silvén, 2019). However, labelling is usually not a practical possibility (Chandola, Banerjee & Kumar, 2009; S. He et al., 2016). As unsupervised learning does not need labels in the training material, it is an applicable approach in practical settings (S. He et al., 2016). For this reason, unsupervised machine learning is used in this study.
Landauer et al. (2018) state that unsupervised methods can successfully detect anomalies. However, S. He et al. (2016) measured that their anomaly detection tools which leveraged unsupervised learning achieved inferior performance in comparison to tools using supervised learning, i.e. learning based on labelled training material. Zhu et al. (2019) found that log parsing, which refers to the activity of pre-processing the unstructured logs into more structured data, is relatively difficult with Linux logs. This is due to their complex structure and large number of different constant parts in the log entry strings (Zhu et al., 2019). S. He et al. (2016) did not use Linux logs in their study, so the suitability of their toolkit in anomaly detection on Linux systems was left unexplored.
This study aims to discover whether the practical approach of unsupervised learning can be successful in detecting anomalies in Linux logs. The performance of the loglizer tools (S. He et al., 2016) with Linux logs is put to the test in order to achieve this. In addition, the performance of the logparser tools (P. He et al., 2016; Zhu et al., 2019), and how it affects the anomaly detection, is investigated. Whether the developed tool actually helps in and simplifies the debugging processes of developers is another important consideration.
Since this thesis is an output-based study, where a software solution to a practical problem was developed, it was natural to use Design Science Research (DSR) as the research methodology. The purpose of DSR is designing and creating an artefact, which addresses a real-life organizational problem (Hevner, March, Park & Ram, 2004; Peffers, Tuunanen, Rothenberger & Chatterjee, 2007). Conceptually, the artefact can be anything with a research contribution embedded in the design (Peffers et al., 2007). Here, the artefact is the log file analysis tool, sgologs. The tool was developed iteratively, with the evaluation of the artefact and its utility affecting the understanding of the problem, objectives for the artefact, design of the artefact, and so on. Artefact development typically occurs within a build-and-evaluate loop (Hevner et al., 2004). In DSR, the evaluation of the artefact, which can be done based on e.g. functionality, performance, or usability, is as important as its development (Hevner et al., 2004). The performance of the log file analysis tool was simple to measure, by checking how many real anomalies were detected. The final step in a DSR project is the communication of the problem and its relevance, and the designed artefact and its utility, to both management-oriented and technology-oriented audiences (Hevner et al., 2004). The present research process and results are communicated by this thesis.
Overall, Linux log files are challenging for the logparser and loglizer tools. Still, a parser from the logparser toolkit, called AEL, seemed to parse the logs relatively accurately. In addition, unsupervised machine learning models were found to correctly classify anomalies in the Linux log files. However, only two of the four tested models were applicable, and the achieved accuracy scores are rather modest and highly dependent on numerous factors. Nevertheless, if the user is aware of these factors, sgologs can direct the user towards abnormal entries in the log file. For example, it is important to be conscious of the fact that the models are best at detecting additional log messages not normally present in the log files. At least to some extent, sgologs could operate as a functional troubleshooting tool in real-life settings as well.
The structure of this thesis is as follows. The research problem and questions are set in section 2. Section 3 presents the research method, Design Science Research, and how it is used in this study. Literature review is in section 4, followed by a presentation of the existing tools, logparser and loglizer, in section 5. Then, the log file dataset is described in section 6. The first iteration of the artefact development is discussed in sections 7 and 8: choosing a log parser and parsing the data is described in section 7, and testing the machine learning models and detecting anomalies with them in section 8. Next, the second iteration is described in section 9. In section 10, the research questions and other considerations are discussed. Finally, section 11 concludes this study.
2.
Research Problem
This section describes the research problem in detail. First, the background of the research artefact is discussed in section 2.1, along with the objectives for the tool. Then, research questions are presented in section 2.2.
2.1 Background and objectives for a solution
The log file analysis is based on machine learning. S. He et al., (2016) have presented and evaluated several applicable machine learning approaches for log-based anomaly detection in their paper, and even made an open source release of the studied software tools in the form of the loglizer toolkit. It is obviously efficient to take advantage of existing solutions. Initially there were two options for utilizing the loglizer tools: they could be used as a kind of blueprint for the design of sgologs, or alternatively be used as they are. In the latter case, the developed artefact is a wrapper, which prepares the log file data, sends it to a loglizer tool, and presents the output. Ultimately it was decided that the log file analysis tool is a wrapper, because getting logparser and loglizer to work with these Linux log files was well enough work for a thesis project. Input for sgologs is a log file, and the tool presents as output the found anomalous sequences in a text file.
The design artefact can be considered successful if it is in fact useful to developers. On a general level this means that the sgologs tool considerably streamlines the laborious task of inspecting log files, resulting in more effective analysis workflow for developers. Of course, it is important to remember that even the best tool in this context can only guide a developer towards anomalies in the log files, and the responsibility of how to use the information the tool provides is left for the developer.
The minimum objective for the solution is that anomalies, e.g. erroneous behaviour due to a software bug, are detected with sufficient accuracy and reported. Here, accuracy chiefly refers to how many real anomalies are detected. Unsupervised machine learning typically produces a large number of false positives (Landauer et al., 2018). This indicates that the machine learning reacts to instances which are not anomalous, resulting in unnecessary data in the output, but also that most, if not all, real anomalies are detected. In this study it is assumed that false positives are better than undetected anomalies, also called false negatives; if the machine learning is too strict about false positives, and thus too careful with the classification, real anomalies may not be detected (Landauer et al., 2018).
Before the logs can be fed into the anomaly detection, they require pre-processing, i.e. log parsing (S. He et al., 2016). As mentioned, tools in the logparser toolkit have some difficulties with Linux logs, the best accuracy being 0.701, whereas other logs could be parsed with accuracies higher than 0.9 (Zhu et al., 2019). The measurements are of course highly dependent on the used log files, and the Linux logs used in this study could produce different results. This topic is investigated in this study, but log parsing is not measured as in Zhu et al. (2019). The accuracy scores are based on comparison to
constructing such a log file to present the ground truth is not feasible in a one-person thesis project. Moreover, it is unclear whether a log parsing accuracy of e.g. 0.701 considerably hinders the anomaly detection. The effect of different parsing accuracies on the anomaly detection is investigated in this study, as mentioned in section 7.4. It is also desirable for the tool to be easy to use, fast, and reliable. If sgologs processes for a long time, or presents false results, it will not be useful to developers. Found
anomalies, or the absence of anomalies, are the main message of the tool’s output. Sgologs informs in the command prompt or terminal if anomalies are found, and mentions were the output files are stored.
2.2 Research questions
Machine learning algorithms need training material, i.e. log files, to learn the expected and anomalous patterns in the logs. The patterns can be already identified in the training data, but it is not an absolute requirement (S. He et al., 2016). This topic is discussed more in section 4. Labelling the training data is rarely a practical possibility (S. He et al., 2016). For example, for the embedded device acting as the source of the log files, each boot produces relatively unique logs, regardless whether anomalous behaviour occurs or not. Thus, the classification of expected and anomalous patterns would be very time-consuming and difficult, when a baseline for comparisons is lacking. Therefore, it is reasonable to rely on unlabelled training data. However, the functionality of the anomaly detection needs to be verified by manually checking if the found anomalies are correct and if all real anomalies are found in a limited selection of log files.
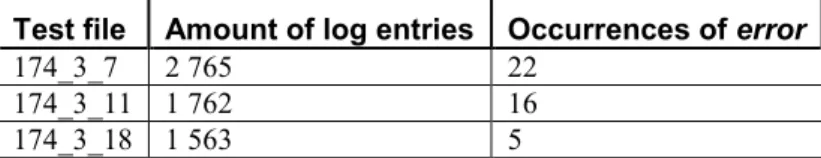
The fact that the loglizer tools group log messages into log sequences creates a challenge. Developers typically inspect the log files as they are, without converting them into specific sequences of any kind. Consequently, it would be difficult for them to identify which sequence is normal or not. The compromise made in this situation is to check how many sequences that contain log messages with the word error is marked as anomalous. Focusing on errors greatly simplifies the validation of the anomaly detection results, as data and knowledge about possible labels is non-existent. This approach overlooks the fact that some anomalies may not be errors per se; however, errors are exactly what developers typically search for in the log files. Whether the amount of detected sequences that contain errors is a valid representation of the anomaly detection accuracy is unclear. The first research question is
RQ1: Can the accuracy of the anomaly detection be effectively verified by the amount of detected errors?
S. He et al. (2016) measured that unsupervised machine learning models achieve inferior performance compared to supervised models. It is relevant to consider whether unsupervised learning is good enough for this purpose, or would it be better to take the trouble of generating label files to enable the use of supervised learning. Fortunately, unsupervised learning supposedly has shown promise in anomaly detection problems (S. He et al., 2016; Landauer et al., 2018). Anomaly detection techniques tend to suffer from high amounts of false positives (Landauer et al., 2018), which are likely to obscure real anomalies from the output. As discussed above, false positives should not be a problem, as long as real anomalies are detected as well. Naturally, the desired accuracy for the anomaly detection is that all real anomalies are detected, and the smaller the amount of false positives is the better. The second research question is
RQ2: How accurate is the anomaly detection with unsupervised machine learning and Linux log files?
3.
Research Methods
This section introduces the Design Science Research (DSR) methodology and its usage in this study. A general picture of DSR is presented in subsection 3.1. Then, the DSR guidelines (Hevner et al., 2004), their application in this study, and how they relate to the DSR process activities (Peffers et al., 2007), are presented in 3.2.
3.1 Design Science Research
Instead of reality-describing research in the style of social and natural sciences, DSR is about creating an artefact for human purposes, addressing a real-life problem (Peffers et al., 2007). DSR is often compared to behavioural science, where an IT artefact is often the object of study, whereas design science creates and evaluates IT artefacts (Hevner et al., 2004). “Such artifacts are represented in a structured form that may vary from software, formal logic, and rigorous mathematics to informal natural language descriptions” (Hevner et al., 2004, 77). The design artefact, and the proof of its usefulness, is central in DSR (Peffers et al., 2007). In this study, the designed artefact is the log file analysis software tool.
By the common DSR artefact classification, the log file analysis tool is an instantiation, instead of a construct, a model, or a method. Constructs essentially are the symbols used to define problems and solutions. For example, mathematics relies on the constructs of Arabic numbers and zero. Models, i.e. representations of the problem domain, can be created with the constructs. More than a model, but not quite an instantiation, a method could be e.g. an algorithm. Finally, an instantiation is a functional implementation, or a prototype, of the solution. (Hevner et al., 2004.)
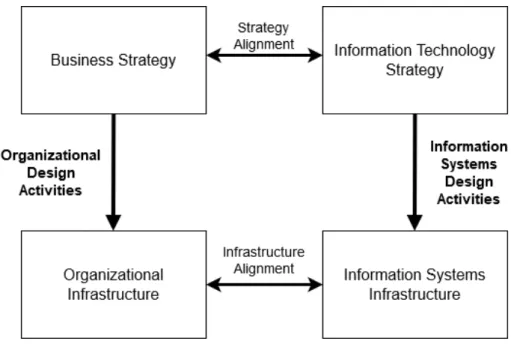
In an organization, the strategies for business and information technology, and the infrastructure for organizational processes and information systems, are largely aligned. Design is required for the effective transition from strategy to infrastructure in both organizational context and information systems context, as illustrated in Figure 1. (Hevner et al., 2004.)
Figure 1. Organizational Design and Information Systems Design Activities. Adapted from Hevner et al. (2004, Figure 1, p. 79).
In addition to considering and leveraging existing research in DSR, and information systems research in general, it is important to remember the environment where the research is happening, also known as problem space. Business needs, i.e. goals and problems within an organization, are the factors which fuel the IS research endeavour. The research thus has relevance to the environment. Likewise, the base of existing knowledge provides the researcher with the scientific foundations and methods for conducting the study. In other words, the knowledge base helps in ensuring the research is performed rigorously. The new research then gives back to the environment, by applying the solution in the organization, and to the knowledge base, by presenting the results of the study to the research community. These relationships are illustrated in Figure 2. (Hevner et al., 2004.)
Figure 2. Information Systems Research Framework. Adapted from Hevner et al. (2004, Figure 2, p. 80).
In DSR, the evaluation of the design artefact is as important as building the artefact. Evaluation produces feedback information on the artefact, and a better understanding of the problem, thus making it possible to improve not only the quality of the artefact but also the quality of the design process. This loop of building and evaluating, also depicted at the centre of Figure 2, is typically iterated through several times. (Hevner et al., 2004.)
What differentiates Design Science Research from routine design is the fact that DSR addresses unsolved problems in innovative ways, or solved problems in more effective or efficient ways. Routine design, on the other hand, is simply the application of existing knowledge to known problems, without any contribution to the knowledge base of existing research. (Hevner et al., 2004.)
3.2 The DSR guidelines and process
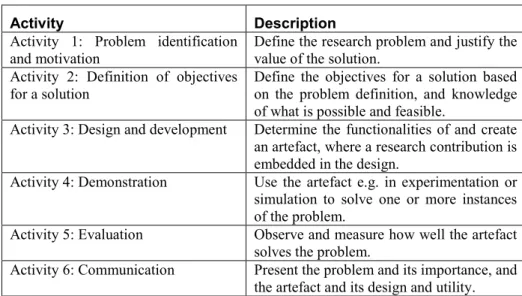
Hevner et al. (2004) presented seven guidelines for DSR, which describe the requirements for effective Design Science Research. The guidelines are summarized in Table 1. Following Peffers et al. (2007), the design science process has six steps: problem identification and motivation, definition of the objectives for a solution, design and development, demonstration, evaluation and communication. The order of these activities is not strict, and the process and the activities can be repeated in an iterative fashion (Peffers et al., 2007). The process activities are summarized in Table 2. This process model is naturally followed in this study. Next, the guidelines (and related process activities) are described in detail, followed by information about their application in this study.
Table 1. Design Science Research Guidelines (Hevner et al., 2004, p. 88)
Guideline Description
Guideline 1: Design as an Artefact Design-science research must produce a viable artifact in the form of a construct, a model, a method, or an instantiation. Guideline 2: Problem Relevance The objective of design-science research is
to develop technology-based solutions to important and relevant business problems. Guideline 3: Design Evaluation The utility, quality, and efficacy of a design
artifact must be rigorously demonstrated via well-executed evaluation methods. Guideline 4: Research Contributions Effective design-science research must
provide clear and verifiable contributions in the areas of the design artifact, design foundations, and/or design methodologies. Guideline 5: Research Rigor Design-science research relies upon the
application of rigorous methods in both the construction and evaluation of the design artifact.
Guideline 6: Design as a Search
Process The search for an effective artifact requires utilizing available means to reach desired ends while satisfying laws in the problem environment.
Guideline 7: Communication of
Research Design-science research must be presented effectively both to technology-oriented as well as management-oriented audiences.
Table 2. The Design Science Research Process (Peffers et al., 2007)
Activity Description
Activity 1: Problem identification
and motivation Define the research problem and justify the value of the solution. Activity 2: Definition of objectives
for a solution
Define the objectives for a solution based on the problem definition, and knowledge of what is possible and feasible.
Activity 3: Design and development Determine the functionalities of and create an artefact, where a research contribution is embedded in the design.
Activity 4: Demonstration Use the artefact e.g. in experimentation or simulation to solve one or more instances of the problem.
Activity 5: Evaluation Observe and measure how well the artefact solves the problem.
Activity 6: Communication Present the problem and its importance, and the artefact and its design and utility.
Guideline 1: Design as an artefact. The creation of an artefact which addresses an organizational problem is the purpose of DSR. Artefacts are rarely full-grown information systems (Hevner et al., 2004). If the artefact is an instantiation, it should prove the feasibility of both the design process and the designed product (Hevner et al., 2004). Conceptually the artefact can be anything, as long as a research contribution is embedded in the design (Peffers et al., 2007). It is also relevant to consider the objectives of the artefact, aligning this guideline with Activity 2. The objectives can be quantitative or qualitative, e.g. a determination of how a new solution is better than current ones, or a description of how a new artefact is expected to support solutions to problems (Peffers et al., 2007).
In this study, the design artefact is the log file analysis tool. As an instantiation, it proves the feasibility of the process and the product: the artefact mitigates the burden of log file analysis, thus showing that the burden of log file analysis can in fact be mitigated. The objectives for the artefact are described in section 2.
Guideline 2: Problem relevance. DSR must address a known problem within an organization, namely a difference between a goal state and the current state (Hevner et al., 2004). The first activity in the DSR process model (Peffers et al., 2007) is to define the research problem and to justify the value of the solution. It may be necessary to conceptually atomize the problem, so that the solution may capture its complexity. Justifying the value of the solution motivates the researcher and the audience of the
research and clarifies the researcher’s understanding of the problem (Peffers et al., 2007).
The log file analysis tool developed in this study addresses the problem of a considerably laborious task. The artefact streamlines this task, leaving more time for more important tasks, and making the work of developers who use the tool more efficient. The laborious task faces developers quite often, underlining the relevance of the problem.
Guideline 3: Design evaluation. As mentioned above, the evaluation of the artefact is as important as the development of the artefact. Evaluation can be done based on e.g. functionality, performance, or usability. The artefact should also be integrated into the business environment. (Hevner et al., 2004.)
Observing and measuring how well the artefact solves the problem can be done during and after the demonstration phase. Generally evaluation (Activity 5) is about comparing the objectives to the actual observed results. As an example evaluation can take the form of quantitative performance measures or results of satisfaction surveys. After the evaluation it is possible to iterate back to Activity 3 (design and development) and attempt to improve the artefact. (Peffers et al., 2007).
The log file analysis tool is evaluated by observing its performance with the log parsing and anomaly detection (both discussed in more detail in section 4). In addition, the usability of the tool, i.e. how much it helps developers in their log inspection, is discussed with several developer colleagues. I will personally advertise the tool within the company, hopefully raising interest at the management level as well.
Guideline 4: Research contributions. Effective DSR must provide a contribution, be it the artefact itself, or e.g. the used design methodology (Hevner et al., 2004). The artefact itself is the major contribution of this study. In addition, this study provides information about how the S. He et al. (2016) tools perform with Linux logs.
Guideline 5: Research rigor. The construction and evaluation of the artefact must be done with scientific rigor, meaning e.g. transparent and reproducible methods (Hevner et al., 2004). The design artefact of this study is based on the toolkit from S. He et al. (2016), a product of extensive research. Similarly, the construction and evaluation methods used by S. He et al. (2016) also aid the construction and especially the evaluation of the present artefact.
Guideline 6: Design as a search process. The sixth guideline refers to the iterative process of DSR: evaluating the solution to the problem refines the problem itself, which again refines the requirements for the solution, and so on (Hevner et al., 2004). Adhering to the process activities, after the artefact has been demonstrated in Activity 4 and evaluated in Activity 5, it is possible to iterate back to design and development (Activity 3) or even to problem identification (Activity 1) or objective definition (Activity 2) (Peffers et al., 2007). The development of the log file analysis tool was iterative. For example, the first version of the tool, sgologs_alpha, needed parsed, structured log files as input, and could only use session windows in determining log event sequences. The second iteration began by going back to Activity 3 and implementing new features.
Guideline 7: Communication of research. The research and its results must be presented to both technology-oriented and management-oriented audiences. Technology-oriented audiences need this information in order to be able to use the artefact in the appropriate context and to enjoy its benefits. Management-oriented audiences wish to know whether the organization should be committed to constructing and using the artefact, so the importance of the problem and the novelty of the solution should be emphasised in the communication. (Hevner et al., 2004.)
Communication (Activity 6) includes the presentation of the problem and its importance as well as the artefact and its design and utility. Communication typically takes the form of a research paper, or alternatively a thesis. (Peffers et al., 2007.)
The present research and results are communicated with this thesis. The thesis provides the relevant information to both technology- and management-oriented audiences.
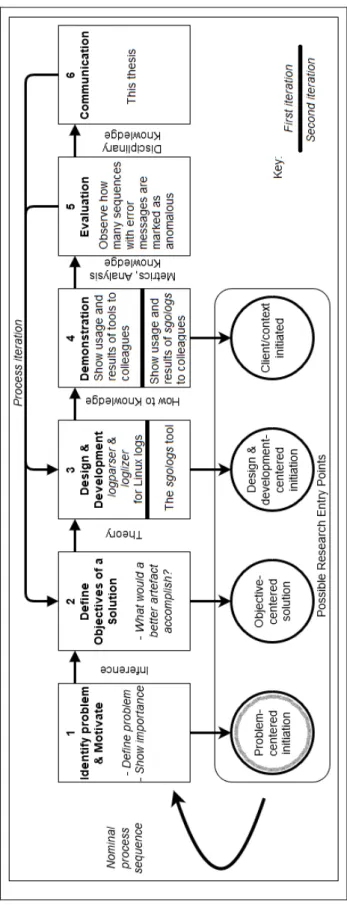
Figure 3 presents the DSR process model in visual form. At the bottom, the possible research entry points, i.e. possible factors which initiate the process, are also visible. The research entry point of this study is highlighted, and the relevant specific tasks of the activities are written out. The texts between the activities represent the required resources for the succeeding (and preceding) activity.
Figure 3. Design Science Research Process Model. Adapted from Peffers et al. (2007, Figure 1, p. 54).
4.
Literature Review
This section presents earlier studies on topics relevant to this research. A brief overview on machine learning is presented in 4.1, followed by more extensive discussion on the specific topic of log-based anomaly detection in section 4.2.
4.1 Machine learning
Machine learning (ML) refers to the ability for computer programs to analyse data,
extract information, and learn from it. How machine learning algorithms “learn” is
essentially about creating and recognizing patterns in training data. For example, in the context of this study, the training data is actual log files, which the algorithms process to generate models for anomaly detection. The intelligence of machine learning is based more on modelled data, instead of the learning algorithms themselves (Pietikäinen & Silvén, 2019). Machine learning is successful with problems which are difficult to solve with purely algorithmic approaches, such as speech and image recognition (Pietikäinen & Silvén, 2019). Different ML approaches have been leveraged in countless domains, for example in software fault prediction (Malhotra, 2015), solar radiation forecasting (Voyant, Notton, Kalogirou, Nivet, Paoli, Motte & Fouilloy, 2017), text-document classification (Khan, Baharudin, Lee & Khan, 2010), network intrusion detection (Tsai, Hsu, Lin & Lin, 2009) and financial market prediction (Henrique, Sobreiro & Kimura, 2019).
Machine learning methods are commonly divided into three categories: supervised learning, unsupervised learning, and reinforcement learning (Pietikäinen & Silvén, 2019). Supervised learning is based on examples: the training material input is labelled, i.e. categories in the training data are already recognized and identified (Pietikäinen & Silvén, 2019). The requirement of labelled training material presents some problems. Labelling the data may not be feasible, since e.g. all the categories in the data should be known beforehand (S. He et al., 2016; Geijer & Andreasson, 2015), and accuracy of the algorithms suffers from incorrectly labeled training material (Pietikäinen & Silvén, 2019). Labelling is usually done by a human expert, making accurate and representative labelling prohibitively expensive (Chandola et al., 2009). However, strong training material can result in very accurate results (S. He et al., 2016). Popular supervised methods include logistic regression and decision trees (S. He et al., 2016; Pietikäinen & Silvén, 2019).
On the contrary, unsupervised learning does not require labels in the training data. The underlying principle is creating a depiction of the structures in the data, where similar inputs are located near each other (Pietikäinen & Silvén, 2019). Unsupervised methods are usually more feasible in practical settings, but unfortunately tend to achieve lower performance than supervised methods (S. He et al., 2016). Although, Landauer et al. (2018) ambiguously argue that unsupervised methods are able to detect anomalies on unlabelled data. It is important to note that verifying the accuracy of unsupervised methods is difficult if the categories of the data are completely unknown (Landauer et al., 2018). Popular unsupervised machine learning methods include autoencoders and Principal Component Analysis (PCA) (S. He et al., 2016; Pietikäinen & Silvén, 2019).
Semi-supervised learning is a combination of supervised and unsupervised learning. Training data typically has labels for normal behaviour (Chandola et al., 2009). Some anomalous categories are first determined with unsupervised learning, and vague categories are verified by human input (Pietikäinen & Silvén, 2019). As human input is required, semi-supervised learning may face similar challenges as supervised learning, albeit it reduces the amount of human labour (Pietikäinen & Silvén, 2019).
In reinforcement learning, a software agent takes actions in an environment, and receives positive or negative feedback (Pietikäinen & Silvén, 2019). The goal of the machine learning is to determine the solution which receives the most positive feedback (Pietikäinen & Silvén, 2019).
A popular subset of machine learning, deep learning, has been very successful in problems such as speech or image recognition. The method extracts features from the raw data with multiple layers; e.g. in image recognition, lower layers capture features such as edges, and higher layers identify more specific features, such as letters or faces. One major advantage of deep learning over traditional machine learning is that these layers of features need not be engineered by humans, as they are learned from the data. In other words, deep learning is able to process natural, unstructured data. (LeCun, Bengio & Hinton, 2015.)
4.2 Log-based anomaly detection
As Chandola et al. (2009) define it, anomaly detection is about finding patterns in data that do not correspond to expected behaviour. There is an abundance of possible applications, such as fraud detection for credit cards, insurance, or health care, intrusion detection for cyber-security, fault detection in safety critical systems, and military surveillance for enemy activities (Chandola et al., 2009). All anomaly detection approaches are essentially about defining a representation of normal behaviour, and declaring anything that does not belong into this representation as an anomaly. However, in practice, anomaly detection is not as straightforward (Chandola et al., 2009). Even defining the normal behaviour can be challenging: often the boundary between normal and anomalous behaviour is not precise, and normal behaviour may evolve over time, requiring updates in the data models (Chandola et al., 2009). The latter consideration is also true for anomalous behaviour. Moreover, malicious actions often mask themselves as normal (Chandola et al., 2009), for example in cyber-attacks. The availability of labelled data for the training and the validation of the models is another challenge (Chandola et al., 2009; S. He et al., 2016).
Anomalies appear in data for a wide variety of reasons. Suspicious activity in network traffic may indicate that a cyber-attacker has intruded the network (Dunaev & Zaytsev, 2019). Malignant tumours result in anomalous MRI images (Chandola et al., 2009). Possible causes for software execution anomalies are hardware problems, network communication congestion or software bugs (Fu, Lou, Wang & Li, 2009). There are several possible approaches for anomaly detection, such as detection at the operating system level, without having to rely on e.g. event logs (Bovenzi, Brancati, Russo, & Bondavalli, 2015). Nevertheless, log-based anomaly detection has become a common approach and attracted a lot of academic interest. With software, the advantage of log files is that they record every event that is carried out (Landauer et al., 2018; Leal-Aulenbacher & Andrews, 2013), being the only source of information about a
Therefore, the logs are the information that can be processed to detect anomalous situations (Dunaev & Zaytsev, 2019; Cheng & Wang, 2014).
However, the manual inspection of log files is often unfeasible due to numerous factors. Software systems and their behaviour tend to be too complex for a single developer to comprehend (Fu et al., 2009; S. He et al., 2016; Leal-Aulenbacher & Andrews, 2013). Thus, analyzing log events related to a component one is not familiar with are of little value. Moreover, the sheer volume of logs from contemporary software systems exceeds what a single developer can effectively handle (Fu et al., 2009; S. He et al., 2016; Geijer & Andreasson, 2015). In some cases, the logs are produced at rates measured in terabytes or petabytes (Mavridis & Karatza, 2017). Finally, software components can have drastically different fault tolerance mechanisms; for example, failed tasks may be rerun, or speculative tasks may be killed to improve performance (S. He et al., 2016). In such cases, finding suspicious log messages can be very difficult. Log file analysis tools should work autonomously, investigating the contents of the log files instead of any labels they have received: tools that require human input also require that e.g. all possible anomalies are already known (Geijer & Andreasson, 2015). There is definitely demand for log analysis methods for anomaly detection (S. He et al., 2016). As a side note, log file analysis tools that operate in cloud computing settings also exist. The popular Apache Hadoop and Spark are good examples of such tools. However, they are not solely focused on anomaly detection. (Mavridis & Karatza, 2017.)
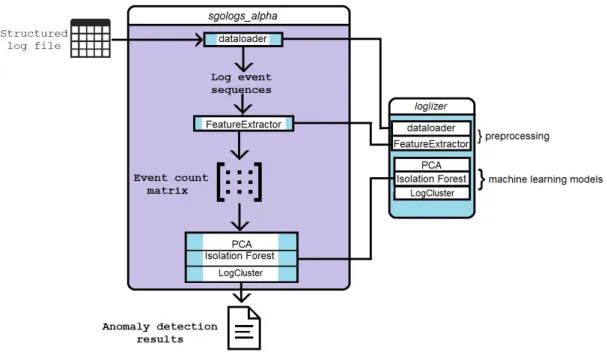
S. He et al. (2016) present an overall framework for log-based anomaly detection. The process consists of four phases: log collection, log parsing, feature extraction, and anomaly detection. Most log-based anomaly detection studies, such as Lou, Fu, Yang, Xu and Li (2010), follow this process, possibly using different names for the phases. Log parsing, feature extraction, and anomaly detection are each discussed in detail in the following subsections.
4.2.1 Log parsing phase
Logs cannot be fed into machine learning or data mining models as they are. This is because logs are unstructured, so a crucial first step is to parse log messages into structured data (Zhu et al., 2019). As mentioned above, logs generated by modern software systems tend to be very large, making manual parsing unfeasible, even with the help of e.g. regular expressions. Regular expressions have to be created manually anyway, and also constantly updated as the system evolves (P. He et al., 2016). Fortunately, numerous open-source automated log parsing solutions, which learn from the system and evolve with it, exist. P. He et al. (2016) and Zhu et al. (2019) have released an open-source toolkit, including numerous techniques for log parsing, called logparser. Logparser will be presented in detail in section 5.
Fu et al. (2009) refer to their log parsing step as log key extraction, which is essentially the same activity. They justify the usage of log keys with two aspects: typically each log key type corresponds to one log print statement in the source code, resulting in log key sequences representing the execution path, and the number of log keys is finite, whereas theoretically there is no limit to the number of unique log messages (Fu et al., 2009). P. He et al. (2016) and Zhu et al. (2019) included Fu et al.’s (2009) method in their
Log messages typically include fields such as timestamp, verbosity or severity level (e.g. INFO or ERROR), and raw message content, recording what has happened during system operation (P. He et al., 2016). The raw message content can be further divided
into constant part and variable part. For example, in the log message “Received block blk_-56272528 of size 671064 from /10.251.91.84” the constant part is “Received block <*> of size <*> from /<*>” and the variable part is the parameters blk_-56272528, 671064 and 10.251.91.84 (Zhu et al., 2019). The constant part could also be referred to as log key, as in Fu et al. (2009). Making extractions such as this is key in introducing structure into the logs. Occasionally, this activity is referred to as frequent pattern mining, a common data mining technique, as in Cheng and Wang (2014). Studies often focus solely on the log keys to detect anomalies, while some approaches also take timestamp and parameter values into consideration (Du, Li, Zheng & Srikumar, 2017). The extracted constant parts of log messages are clustered into a list of log event templates, e.g. “Event 3: Received block <*> of size <*> from /<*>”. The structured log will then contain a sequence of these events with their occurring times, e.g. “ 2020-01-16 13:18:59 Event 3”. Now, when the log is structured, it can be easily processed, for example by machine learning-based anomaly detection methods. It is important to remember that log mining (e.g. log-based anomaly detection) is effective only when the log parsing accuracy is high enough. (P. He et al., 2016.)
Unfortunately, as found in Zhu et al. (2019), Linux logs are difficult to parse accurately, due to their complex structure and the large amount of event templates. The LenMa tool, based on Shima (2015), provided the best accuracy of 0,701 (Zhu et al., 2019).
4.2.2 Feature extraction phase
Fu et al. (2009) use Finite State Automation (FSA) to model the execution path of the system, and construct models representing normal system behaviour. This way, the anomalies can be detected by comparing new log sequences to the FSA models (Fu et al., 2009).
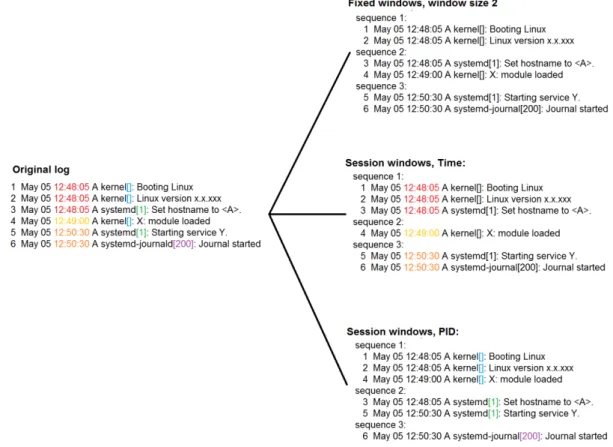
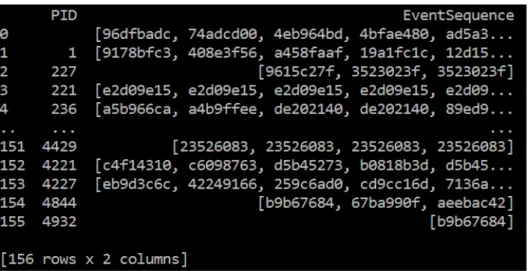
S. He et al. (2016) separated log data into various groups, each group representing a log sequence, using different grouping techniques. Then, feature vectors (or event count vectors) were created for each sequence, and the vectors were used to form a feature (event count) matrix. The matrix is required as input for the anomaly detection models. The grouping techniques used by S. He et al. (2016) were fixed windows, sliding windows, and session windows. Log events that occurred in the same window were regarded as a log sequence. Both fixed windows and sliding windows are based on the timestamp of each log event. Fixed windows only have one attribute, size (e.g. one hour), whereas sliding windows also have the step size attribute (e.g. five minutes). With these parameters, as an example, two hours has space (or rather time) for two fixed windows, and 13 sliding windows. Log events are likely to duplicate in multiple sliding windows due to overlap, as the step size is in general smaller than the window size (S. He et al., 2016). Instead of timestamps, session windows use identifiers to mark execution paths, with a unique identifier to each session window. S. He et al. (2016) found that sliding windows is the most accurate grouping technique.
Kim, Minsik, Kim, Cho, and Kang (2019) used user behaviour modelling for insider threat detection. For example, they used user activity logs to extract candidate features, such as the number of USB connections per day (Kim et al., 2019). In addition to user
activity logs, Kim et al. (2019) also used email topic modeling to create an email content dataset, and information about how users send/receive information to create an email communication network dataset.
4.2.3 Anomaly detection phase
The bases of three supervised methods are presented in S. He et al. (2016): logistic regression, a statistical model, decision tree, a tree structure diagram, and Support Vector Machine (SVM), a supervised learning method for classification. Additionally, S. He et al. (2016) present three unsupervised anomaly detection methods: log clustering, Principal Component Analysis (PCA) and invariants mining. S. He et al. (2016) also evaluate the efficiency of all these methods.
Supervised methods achieve high precision (the percentage of how many reported anomalies are correct), while recall (the percentage of how many real anomalies are detected) is influenced by the analysed datasets and window settings. It should be noted that accuracy is often used as an umbrella term, encompassing both precision and recall: 100% accuracy requires and indicates that precision and recall are also 100%. Overall, SVM seems to be the most accurate supervised anomaly detection method. Unfortunately, even though unsupervised methods tend to be more applicable in practical settings, they generally achieve inferior performance compared to supervised methods. However, invariants mining appears as a promising method with stable performance, and window settings do not seem to affect the results as they did with supervised methods. (S. He et al., 2016.)
Unsupervised anomaly detection methods, except for PCA, were measured to be much more time-consuming than supervised methods. Methods in both categories, except the unsupervised log clustering, scale linearly as log size increases. However, like log clustering, invariants mining requires optimizations to be able to handle large datasets. (S. He et al., 2016.)
Cheng and Wang (2014) also used PCA in their study on communication network anomalies. They achieved impressive accuracies, the minimum being 66% and the average near 80%. Moreover, the rate of false positives was admirably low: the maximum value was only 0.49%.
Kim et al. (2019) fed their candidate feature sets from their three datasets (user activity-, email content-, and email communication network dataset) into one-class classification algorithms. Since the amount of abnormal cases of user activity is typically very small, it is practical to use one-class classification, which only uses the normal class data to
learn their common characteristics (Kim et al., 2019). Kim et al.’s (2019) trained model
then predicts the likelihood of a newly given instance being a normal class instance. The algorithms used were Gaussian density estimation, Parzen window density estimation, PCA, and K-means clustering. Kim et al.’s (2019) framework performed reasonably
well: for example, when considering 30% of the most suspicious instances, more than 90% of abnormal behaviours in the user activity dataset, and 65.64% in the email content dataset, were detected. However, their anomaly detection models were trained independently based on each dataset, and Kim et al. (2019) argue that better integration of the results, and utilizing the knowledge of experts, would possibly achieve a better performance.
Landauer et al. (2018) used their own incremental clustering algorithm for intrusion detection. Incremental cluster methods dynamically allocate incoming data points to existing clusters, or, if the distance to the nearest cluster exceeds a certain threshold, declare them as outliers (Landauer et al., 2018). In addition to clustering, Landauer et al. (2018) detected anomalous behaviour with cluster evolution and time-series analysis. When applied on the evolutions of individual clusters, their anomaly detection showed promising performances. However, their method only detects dynamic changes,
overlooking anomalies that occur within a single time window, and “the problem of rather high amounts of false positives that all anomaly detection techniques suffer from [emphasis added] remains unsolved” (Landauer et al., 2018, 115).
Du et al. (2017) use deep learning, more specifically a type of recurrent neural networks (RNN) called long short-term memory (LSTM), for log-based anomaly detection. The DeepLog model is able to detect execution path anomalies, by inspecting the log key sequences, but also parameter value and performance anomalies. This is possible because the parameter and timestamp values extracted from the log entries are taken into account in the anomaly detection. DeepLog also models the execution path of the system, like Fu et al. (2009) did with FSA. This modelling is inspired by invariants mining (Lou et al., 2010), and is performed with density-based clustering as well. Overall, DeepLog achieves a better performance than previous methods, such as PCA, which are also unable to detect parameter value and performance anomalies. (Du et al., 2017.)
5.
Existing tools for Log-based Anomaly Detection
This section presents an overview of the logparser and loglizer toolkits. Logparser, developed by P. He et al. (2016) and Zhu et al. (2019), is described in section 5.1, and loglizer, developed by S. He et al. (2016), is described in section 5.2.5.1
logparser
Logparser1 is an open-source toolkit, used to convert raw log messages into a sequence
of structured events (Zhu et al., 2019). The toolkit automates the process of extracting event templates, and provides a decent selection of different log parsing methods (P. He et al., 2016; Zhu et al., 2019).
Logparser contains 13 log parsing methods proposed by researchers (such as Fu et al., 2009) and practitioners, five of which are based on open-source tools. The input/output interface is unified for all the different methods, which are also wrapped into a single Python package. For all the tools, input is a raw log file, and the output is (1) a structured log file and (2) an event template file with aggregated event counts. (Zhu et al., 2019.)
As mentioned above, Linux log files are challenging for automated log parsing (Zhu et al., 2019). The highest parsing accuracy in Zhu et al.’s (2019) measurements was
achieved with the LenMa tool, which is based on Shima (2015). The rounded accuracy of LenMa was measured to be 0.701 (Zhu et al., 2019). The second and third best tools were SHISO (Mizutani, 2013) and AEL (Jiang, Hassan, Flora & Hamann, 2008), which achieved rounded accuracies of 0.701 and 0.673, respectively (Zhu et al., 2019).
5.2
loglizer
Loglizer2 is a log analysis toolkit for automated anomaly detection, based on machine
learning. At the time of its release, the toolkit included six tools: three with supervised machine learning methods, and three with unsupervised machine learning methods. However, three additional tools using unsupervised models have been released recently: LOF (Local Outlier Factor), One-class SVM, and Isolation Forest. Moreover, two more tools, DeepLog (based on deep learning) and AutoEncoder, are currently in development. (Logpai, 2020.)
It is relevant to highlight here that the anomaly detectors by S. He et al. (2016) work with log sequences, instead of individual log messages. This means that the machine learning algorithms classify collections of log entries, and thus never mark a single log
1https://github.com/logpai/logparser 2https://github.com/logpai/loglizer
message as anomalous. As described in section 4.2.2, S. He et al. (2016) used different windowing techniques for generating the log sequences. The specifics of the windowing techniques used in this study are presented in section 8.1.
As discussed in section 4, unsupervised machine learning is more applicable in this context, and therefore the unsupervised tools were focused on. The usage of four unsupervised tools is conveniently demonstrated within the loglizer toolkit, with implementations which do not assume that label data is available. These four tools (InvariantsMiner, IsolationForest, LogCluster, and PCA) were subject to testing in this study, instead of using only the three from S. He et al. (2016). Next, the underlying anomaly detection techniques of the tools are described in more detail.
LogCluster tool is based on work by Lin, Zhang, Lou, Zhang and Chen (2016), originally developed to identify online system problems (S. He et al., 2016). Clustering is a relatively common, primarily unsupervised technique, where similar data instances are assigned into clusters (Chandola et al., 2009). This technique relies on the assumption that normal instances belong to a definable cluster, and lie close to their closest cluster centroid, whereas anomalous instances do not (Chandola et al., 2009). However, clustering algorithms are usually optimized to find clusters, not anomalies, and tend to have trouble with clusters of anomalies (Chandola et al., 2009). LogCluster is trained in two phases: knowledge base initialization phase, where normal and abnormal clusters are generated, and online learning phase, where the clusters are further adjusted (S. He et al., 2016). In the anomaly detection, the distance of a new log sequence to its nearest cluster is computed. If the smallest distance is larger than some threshold, or if the nearest cluster is an abnormal cluster, the log sequence is reported as an anomaly (S. He et al., 2016).
Principal Component Analysis (PCA) is a spectral anomaly detection technique, which
tries “to find an approximation of the data using a combination of attributes that capture the bulk of the variability in the data” (Chandola et al., 2009, 37). In other words, PCA is about projecting high-dimension data to a new coordinate system composed of k principal components (k being less than the original dimension), preserving the major characteristics of the original data (S. He et al., 2016). Log sequences are vectorised as event count vectors, and PCA is used to find patterns between the dimensions of the vectors (S. He et al., 2016). Then, a projection of an event count vector is calculated, and if the length of the projection is larger than some threshold, the vector is classified anomalous (S. He et al., 2016). The PCA tool in the loglizer toolkit is based on Xu, Huang, Fox, Patterson and Jordan (2009), where PCA was used precisely in log-based anomaly detection (S. He et al., 2016).
Invariants Mining focuses on program invariants, linear relationships that always hold during the runtime of a system. For example, files need to be closed after they were
opened, so log entries with phrases “open file” and “close file” appear in pairs and
represent a lineal relationship. If the number of “open” and “close” log events in an
instance is not equal, the linear relationship is violated, and the instance is marked anomalous. The loglizer tool is based on Lou et al. (2010), and as the name suggests, the invariants (i.e. the linear relationships) are extracted from the log files. Each new log sequence is reported as an anomaly if it disobeys at least one invariant. (S. He et al., 2016.)
Typically, anomaly detection methods construct a profile of normal instances, and instances which do not conform to this profile are identified as anomalies, but Isolation Forest has a different approach. Taking advantage of the fact that anomalies are few and
different compared to normal instances, Isolation Forest isolates anomalies instead of profiling normal instances. No distance or density calculations are required, reducing computational cost. Moreover, Isolation Forest has a linear time complexity, and can be scaled up to large and/or high-dimensional data sets. (Liu, Ting & Zhou, 2008.)
6.
Description of the Dataset
This section describes the log dataset used in this study. The initial data was pre-processed (or pre-pre-pre-processed) to prepare it for the log parsing, as explained in section 6.1. The resulting final log file dataset is summarized in section 6.2.
6.1 Pre-processing the initial data
The aforementioned colleague had collected the logs from the Linux journal, which records information e.g. about all kernel and userspace processes (see e.g. “systemd,”
2020). The logs were collected from 9 devices, running two different builds of custom
embedded Linux. Here, the two builds are dubbed “A” and “B”. Each device stored its
journal logs from numerous consecutive reboots into a single file, resulting in files up to 3.7 GB in size. The files were stored in two directories, A and B, depending on which build of the software they were collected from. In the files, a few rows of free-form debug prints, written by the colleague, preceded the actual log entries of each reboot cycle.
First, the debug prints were removed, leaving only the entries that conformed to Linux log format. Second, the massive files of consecutive logs were split into multiple files, with each resulting file containing the log entries of a single reboot. Both of these tasks were straightforward, and carried out by simple Python scripts.
6.2 The final dataset
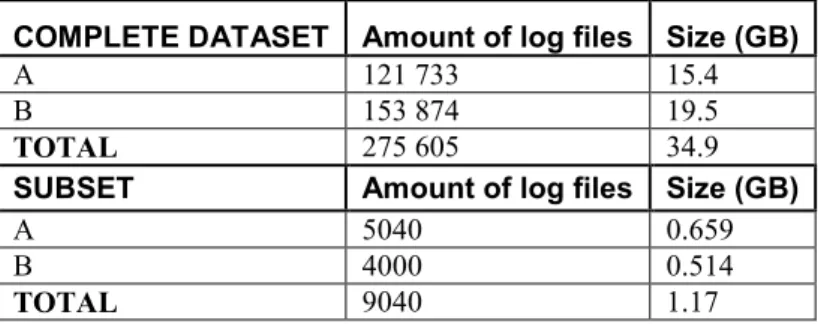
After the initial processing, the complete dataset contained 275 605 log files, taking up 34.9 Gigabytes of storage space. The amount of rows, i.e. log entries, in each log file varied from 1500 to 2500, occasionally being as high as 35 000. Typically, a single log file contained about 1750 log entries.
Needless to say, the amount of data is definitely sufficient for the purposes of this study. Processing all the log files was obviously not necessary or feasible, and therefore a randomly selected subset of the log files was used. The subset contained 9040 log files from both directories (A/B). The subset was used in further processing and analysis, first in testing the logparser tools. The complete dataset and its subset are summarized in Table 3.
Table 3. Summary of the dataset.
COMPLETE DATASET Amount of log files Size (GB)
A 121 733 15.4
B 153 874 19.5
TOTAL 275 605 34.9
SUBSET Amount of log files Size (GB)
A 5040 0.659
B 4000 0.514
7.
First Iteration: Using the
logparser
Toolkit
The first iteration included the usage and evaluation of the logparser (P. He et al., 2016; Zhu et al., 2019) and loglizer (S. He et al., 2016) toolkits. The design of the artefact was based on this investigation, and the existing tools were used in practice in order to see how they could solve the problem. In addition, the performance and the utility of the tools were evaluated. Thus, the first iteration encompassed steps 3 (design and development), 4 (demonstration), and 5 (evaluation) of the Design Science Research process model (Peffers et al., 2007).
This section describes the usage of the logparser toolkit, and is organised as follows. Sections 7.1, 7.2 and 7.3 describe the tests performed with the tools LenMa, SHISO, and AEL, respectively. Parsing the entire data subset into structured data is explained in section 7.4.
The three tools from the logparser toolkit which achieved the highest accuracy with Linux log files in Zhu et al. (2019) were tested by parsing the same single log file with each tool. The test log file contained 1597 log messages, and used 111 KB of disk space. The tools were LenMa (Shima, 2015), SHISO (Mizutani, 2013), and AEL (Jiang et al., 2008). The tools can be optimized with regular expressions, and two expressions
which help the tools in handling IP addresses (e.g. “100.55.123.1”) and time
information (e.g. “08:15:00”) were used with all of them.
7.1 Testing LenMa
LenMa is short for “Length Matters”, and its event template extraction is based on the token length properties of log messages, as the name suggests (Shima, 2015). When the test file was parsed with LenMa, the tool was able to determine 1018 different event templates, meaning the reduction in relation to the log entries in the file was only 36.26%.
Inspecting the resulting event templates revealed that the accuracy of LenMa was quite disappointing. For example, the log file contained numerous entries about some settings of the device, presented as key-value pairs in the style of “setting: VALUE”. LenMa
determined that each of these pairs is an individual event template, even though the entries clearly have a constant part “setting:”.
In order to mitigate this issue, two additional, complex regular expressions were used.
One expression helped the tool in finding the variables in the “setting:” strings and the other did the same for “Item #0 None” style strings, which were similarly challenging for LenMa. With the regular expressions, LenMa performed better, extracting 813 event templates. A large amount (677 templates, 83% of total) of these occurred only once, which may indicate that quite a few events were incorrectly determined to be individual instances, instead of belonging to a single template. In fact, the output contained ten
templates that started with the words “inserted module”, followed by a word varying
7.2 Testing SHISO
SHISO generates nodes from log messages, creating a structured tree, and is capable of refining the log format continuously in real time (Mizutani, 2013). The initial parsing test immediately showed much promise, compared to LenMa, as SHISO extracted 611 event templates from the test log (a 61.74% reduction from the amount of log entries). This result was achieved with only the two basic regular expressions for IP addresses and time information.
Closer inspection showed that the situations which caused trouble for LenMa were
handled with ease by SHISO. For example, regarding the “setting: VALUE” entries,
SHISO correctly determined that such entries can be encompassed in a single event template. However, SHISO extracted all-variable event templates, resulting in templates
such as “* *” or “* * * * *”, which could in theory match any two- or five-word log entry. This is obviously undesirable, since for example log entries “Everything is fine” and “Device will explode” both containthree words, and would fit the template “* * *”,
but clearly cannot be considered as two instances of the same event. SHISO determined that all-variable events occurred 312 times in the log file.
7.3 Testing AEL
The log parsing process of AEL includes four steps: anonymize, tokenize, categorize, and reconcile (Jiang et al., 2008). The original algorithm merges events in the reconcile step, but cannot handle cases where a single template has multiple different parameter tokens (Logpai, 2018). To address this issue, the algorithm is improved in the logparser implementation (Logpai, 2018).
Like SHISO, AEL showed promise in its parsing accuracy. 591 event templates were extracted, again with only the two basic regular expressions. Based on the smaller amount of event templates, it can be considered that AEL performed even better than SHISO. Moreover, AEL did not extract any all-variable templates, outperforming SHISO in this regard as well.
7.4 Parsing the subset
The performance of the three tested tools was, surprisingly, completely contrary to what the measurements in Zhu et al. (2019) would suggest. That is, even though LenMa was measured to be the most accurate of the three, it seems to perform the worst here, for example. Since SHISO and AEL were much more accurate than LenMa, even without additional regular expressions, only they were used for the remaining log parsing tasks. The data subset described in section 5 was thus parsed with both SHISO and AEL. Having two different versions of the parsed logs made it possible to compare the accuracy of the two tools from the viewpoint of the anomaly detection tools: if the anomaly detection is considerably more accurate with logs parsed by one tool, that tool is most likely more accurate in its log parsing. Likewise, the effect of the parsing accuracy on the performance of the anomaly detection was investigated.
The subset included about a thousand log files from each device, so the log parsing was done in cycles of 1000 log files. An interesting observation was immediately made: AEL is much faster than SHISO. On average, AEL parsed 1000 log files in about 4
minutes 46 seconds, whereas SHISO processed for 2 hours, 6 minutes and 36 seconds. In this context, when the objective is to generate large amounts of structured logs, SHISO is thus far less useful. However, the typical use case of the anomaly detection tool only includes the inspection of a single log file. In that context, the user has to wait for SHISO to complete for only about seven or eight seconds. Of course, this is still slow compared to AEL, which only needed as little as 0.2 seconds for a single log file, but not unreasonably slow. Nevertheless, based on these tests, as AEL is better in both parsing accuracy and processing time, I would strongly recommend it for parsing Linux logs.
The resulting structured logs were stored as .csv (comma-separated values) files. The values extracted from each log entry were LineId (line number of the log entry), Month, Date, Time, Level (name of the device, always the same), Component (software component which logged the entry), PID (process identification number), Content (free-form textual log message), EventId (identification for the log event), and EventTemplate (the constant part of the content).