gl2vec: Learning Feature Representation Using
Graphlets for Directed Networks
Kun Tu
1, Jian Li
1, Don Towsley
1, Dave Braines
2, and Liam D. Turner
31
University of Massachusetts Amherst,
2IBM UK,
3Cardiff University
1
{
kuntu, jianli, towsley
}
@cs.umass.edu,
2dave [email protected],
3[email protected]
Abstract—Learning network representation has a variety of applications, such as network classification. Most existing work in this area focuses on static undirected networks and does not account for presence of directed edges or temporal changes. Furthermore, most work focuses on node representations that do poorly on tasks like network classification. In this paper, we propose a novel network embedding methodology, gl2vec, for network classification in both static and temporal directed networks. gl2vec constructs vectors for feature representation using static or temporal network graphlet distributions and a null model for comparing them against random graphs. We demonstrate the efficacy and usability of gl2vec over existing state-of-the-art methods on network classification tasks such as network type classification and subgraph identification in several real-world static and temporal directed networks. We argue that gl2vecprovides additional network features that are not captured by state-of-the-art methods, which can significantly improve their classification accuracy by up to 10% in real-world applications.
I. INTRODUCTION
Networks, where elements are denoted as nodes and their interactions are denoted as edges, are fundamental to the study of complex systems [21], including social, communication, and biological networks. Analysis of such networks include network classification, community detection and so on. This often involves applying machine learning techniques to these problems, which requires the network to be represented as a feature vector. However, representing a network is challenging due to high dimensionality and network structure.
Various ways of learningfeature representationsof nodes in networks have been recently proposed to exploit their relations to vector representations [1], [9], [20], [28], [29]. However, most of these are applied to node and edge predictions and
This research was sponsored by the U.S. Army Research Laboratory and the U.K. Ministry of Defence under Agreement Number W911NF-16-3-0001. The views and conclusions contained in this document are those of the authors and should not be interpreted as representing the official policies, either expressed or implied, of the U.S. Army Research Laboratory, the U.S. Government, the U.K. Ministry of Defence or the U.K. Government. The U.S. and U.K. Governments are authorized to reproduce and distribute reprints for Government purposes notwithstanding any copyright notation hereon.
Fig. 1: (Left): All 16 triads in static directed network [8]; (Right): All2-node and3-node,3-edge,δ-temporal graphlets as defined in [26].
fail to fully capture network structures. It is still unclear if the result of network classification by these node embedding methods can be improved, since the whole network structure also plays a significant role. Furthermore, typical analysis usually models these systems as static undirected graphs that describe relations between nodes. However, in many realistic applications, these relations are directional and may change over time [12], [15], [26]. Modeling thesedirected and tempo-ralproperties is of additional interest as it can provide a richer characterization of relations between nodes in networks.
In this paper, we address the aforementioned issues by proposing a novel network embedding methodology, gl2vec, for network classification in both static and temporal directed networks.gl2vecconstructs vectors forfeature representations by comparing static or temporal network graphlet statistics in a network to random graphs generated from different null models (subgraph ratio profile, i.e., SRP, see Section III). Graphlets are small non-isomorphic induced subgraphs rep-resenting connected patterns in a network and their frequency can be used to assess network structures. For example, Figure 1 shows triads (Left), and all possible 2-node and 3-node, 3 -edge,δ-temporal graphlets (Right). These will be described in detail in Section II. We show that the ratios of occurrences of graphlets in a network in comparison to random graphs (SRPs) can be used as a fixed length feature representation to classify and compare networks of varying sizes and periods of time with high accuracy. We apply various well-known machine learning models along with our graph feature repre-sentation for network classifications, and make a comparison with state-of-the-art methods, such as different graph kernels [29], node2vec [9], struc2vec [28], sub2vec [1], graph2vec [20], for network classification. We argue thatgl2vecprovides
Permission to make digital or hard copies of all or part of this work for personal or classroom use is granted without fee provided that copies are not made or distributed for profit or commercial advantage and that copies bear this notice and the full citation on the first page. Copyrights for components of this work owned by others than ACM must be honored. Abstracting with credit is permitted. To copy otherwise, or republish, to post on servers or to redistribute to lists, requires prior specific permission and/or a fee. Request permissions from [email protected].
ASONAM ’19, August 27-30, 2019, Vancouver, Canada c
2019 Association for Computing Machinery. ACM ISBN 978-1-4503-6868-1/19/08
additional network features that are not captured by state-of-the-art methods, which can significantly improve classification accuracy. Highlights of our contributions include:
1) We propose a novel graphlet feature representation method,gl2vec, for network classification in both static and temporal directed networks.
2) We empirically evaluate gl2vec against state-of-the-art methods on tasks such as network type classification and subgraph identification in several real-world static and temporal datasets. We find thatgl2vecoutperforms state-of-the-art methods in these two tasks.
3) More importantly, we show that whengl2vecis concate-nated with state-of-the-art methods, the concatenation provides a significant improvement on classification ac-curacy in real-world applications from several domains, showing the utility ofgl2vec further.
II. PROBLEMFORMULATION
In this section, we provide definitions used in the rest of the paper and formulate the problem being addressed. For temporal networks and temporal network graphlets, we consider definitions given in [26], although we can equally use definitions in [15]. We present them here for completeness. Definition 1. A temporal directed network [26] is a set of nodes and a collection of directed temporal edges with a timestamp on each edge. Formally, a temporal directed network T on a set of nodes V is a collection of tuples (ui, vi, ti), i= 1,· · · , N,whereN is the number of directed temporal edges, ui, vi ∈ V and ti ∈ R is a timestamp. We refer to (ui, vi, ti)as a temporal edge.
To strictly order the tuples, we assume timestamps ti are unique. This assumption can be easily extended to cases where timestamps are not unique at the cost of complex notation. Definition 2. A directed static network G(V, E) is defined as a set of nodes, denoted as V and a set of directed edges without timestamps, denoted as E⊂V2\ {(u, u) :u∈V}. Definition 3. Graphlets are small connected non-isomorphic induced subgraphs of a larger network.
In particular, we focus on triads, (see Figure 1 (Left)). The first three triads are not connected, hence do not satisfy the graphlet definition, but we argue that they are also important in constructing vectors for network feature representation. Definition 4. Temporal network graphlets [26] are defined as induced subgraphs on sequences of temporal edges. Formally, ak-node,l-edge,δ-temporal graphlet is a sequence ofledges, M = (u1, v1, t1),· · ·,(ul, vl, tl)that are time-ordered within a durationδ, i.e., t1<· · ·< tland tl−t1≤δ,such that the induced static graph from edges is connected withk nodes. Problem Formulation: Denote {Gi(Vi, Ei, Li)}Ni=1 as (sub)graphs in different static or temporal networks, where Vi is a set of nodes and Ei is a set of edges in Gi. If Gi is a temporal network, Ei is then a temporal edge with a
timestamp as defined in Definition 1, otherwise, Ei is a directed edge. Suppose that graphs can be categorized into D classes, D < N. We associate each graphGi with a label Li∈ {1,· · ·, D}.
Let f : {Gi} → Rm be a mapping function (also called graph embedding function) from Gi to a 1 × m feature representation vectordefined using SRPs of static or temporal graphlets. We formally define SRP in Section III.
Letg :Rm→P ∈
RD be a classifier that maps a feature representation to a categorical distribution P for D labels. We represent probability distribution of Gi’s label as Pi = [pi,1, . . . , pi,D] =g(f(Gi)).
Our goal is to solve this classification problem by designing an embedding function f and selecting a machine learning model g that minimizes the sum of cross entropy [6]for all graphs. arg min g,f − X i D X j=1 1Li=jlog(pi,j) ! = arg min g,f − X i log(pi,Li) ! . We obtaingby training machine learning models. In the next section, we discuss how to design an embedding function f for static and temporal networks using graphlets.
III. NETWORKEMBEDDINGUSINGGRAPHLET
Network embedding has received considerable attention due to its effect on network classification, see Section V. However, previous work has primarily focused on examining this for undirected static networks. Applying these techniques to di-rected static networks may lose network structure information, while applying them to temporal networks loses temporal information, and both may result in poor accuracy. Therefore, we introduce a new static (temporal) network embedding technique based on static (temporal) network graphlets.
Graph embeddings need to be independent of network size and, if temporal, the time period the network covers. While previous work shows that the counting and probability distri-bution of graphlets are strongly related to network types [26], graphlet counts may differ across networks. Instead, we use subgraph ratio profile (SRP) for network embedding, which is computed using graphlet counts from both the network in question and random graphs produced using a null model. Definition 5. A null model [23] is a generative model used to generate random graphs that matches a specific graph in some of its structural features such as the degrees of nodes or number of nodes and edges.
For static networks, we consider the null model for random graphs with the same number of nodes and edges (NE). NE has been widely used in previous studies since it is easy to generate random graphs [16] and the probability of a node degree in a random graph can be approximated by Poisson distribution in the large limit of graph size [24]. Thus network features and graphlet statistics can be easily modeled.
For temporal networks, since there is no equivalent null model, we consider ensembles of randomized time-shuffled data as a temporal null model [18]. To be more specific, we
randomly permute the timestamps on the edges while keeping the node pairs fixed. This model breaks the temporal depen-dencies between edges but preserves the network structure.
In our study, we use a null model to compare graphlet counts in a network against random graphs. The difference between counts is then used to construct an SRP as a feature representation of the network.
Definition 6. Subgraph ratio profile (SRP) [19] for a graphlet i is defined as SRPi = √P∆i∆2
i
, where ∆i = Nobi−<Nrandi>
Nobi+<Nrandi>+. Here Nobi is the count of graphlet i ob-served in an empirical network, and < Nrandi >is the the average count in random networks in a null model. Last, (usually set to four) is an error term to make sure that ∆i is not too large when a graphlet i rarely appears in both empirical and random graphs.
A large positive value of an SRP indicates that a graphlet occurs much more frequently in a network than expected by random chance. Since SRP for a graphlet has been normalized, it can be used to compare different size networks. The network embedding is a vector containing16SRPs for static triads and 36 for temporal graphlets as illustrated in Figure 1 (Right). Algorithm: gl2vec works as follows: given the topological structure of a directed static or temporal network, we first compute its graphlet counts. For static networks, we used JMotif [32] to compute triad counts for networks and random graphs in different null models. For temporal networks, we use the SNAP package [26] to compute 3-edge, δ-temporal graphlet counts. Then we compute average graphlet counts in null modelsNE. For static networks, there are two approaches: simulation based and probability based. The simulation based approach generates a large set of random graphs with the same structure of the given network and a graphlet counts are computed for each random graph. The probability based approach computes the probability of occurrence for each type of graphlet given the in/out degree of the nodes involved. We apply the probability based approach to NE due to its fast computation speed and high accuracy. For temporal networks, we generate random graphs by shuffling timestamps on edges and then compute their average temporal graphlet counts. Finally, we compute SRPs for corresponding graphlets.
IV. EXPERIMENTS
In this section, we conduct network classification on several real-world static and temporal directed networks. We define two tasks, network type classification and subgraph identifi-cation, to assess the performance of gl2vec in comparison to the state-of-the-art.
A. Datasets
We use a wide range of real-world network datasets, which only contain topological structure. Attributes of nodes and edges are unknown, except for labels for classification, and timestamps of edges, in temporal networks. These datasets may challenge some current state-of-the-art methods that re-quire attributes of nodes or edges.
1) Static directed network datasets:
SNAP datasets [17]:We use datasets from social networks, Twitter dataset, Google+ dataset, question-answering networks Askubuntu and Mathoverflow, peer-to-peer file sharing net-works p2p-Gnutella, physics paper citation networks Cit-HepPh and Cit-HepTh, and so on. Due to space constraints, properties of these datasets are given in [33].
2) Temporal directed network datasets:
Email Networks: EmailEU [37] is a directed temporal net-work constructed from email exchanges in a large European research institution for a803-day period. There are42ground truth departments in the dataset and we choose26departments whose email network sizes are larger than10. We constructed temporal subgraphs, each lasting 12 weeks for departments in EmailEU networks. This ensures each subgraph becomes a connected network component when converted to an un-weighted static graph. We create these graphs at the beginning of every four weeks to avoid too much overlap of edges between graphs. Each department has up to 28 subgraphs as a result. We also consider EmailTraffic [25], details in [33]. SwitchApp: [34], [35] is a set of networks representing application switching data for 53 Android users over a 42 -day period. We construct a directed temporal network for each user on each day, where a directed edge (denoted aseuv) along with a timestamp t, represents a user switching from an app uto anotherv at timet.
B. Experiment Setup
We compute SRPs for static and temporal graphlets for corresponding static and temporal networks in our datasets. We use three widely used machine learning models that provide good performance using small amounts of training data in multi-class classification: XGBoosting [3], SVM [4], and random forest [30]. XGBoosting usually has a superior performance over other classifiers when the dataset is of middle size. SVM is suitable for a small amount of training data. Random forest not only works well for imbalanced data, but also performs feature selection during training which can help us investigate the usefulness of our feature representation, especially when used in conjunction with other approaches by concatenating the feature vectors.
We use grid search method to search the best hyper-parameters for these models. For XGBoosting algorithm, the learning rate ranges from0.001to1, maximal tree depth range from 4 to 32, minimal child weight is 1 and the subsample ratio of train instances ranges from0.4to1. The regularization weight in SVM ranges from 1 to 8. In random forest, the number of trees ranges from50to400and the minimal number of samples required to split a tree node from2to10.10-fold cross-validation is adopted to split the data to select the best parameters. All experiments are conducted using a cluster with 32 Xeon CPUs, 256GB RAM and one Tesla K40 GPU.
We compare the network classification accuracy of gl2vec with state-of-the-art methods, including graphlet and Weisfeiler-Lehman kernels [29], and node and graph
em-bedding methods node2vec [9], struc2vec [28], sub2vec [1], graph2vec [20].
For node embedding methods node2vec andstruc2vec, we apply a sum-based approach [5] to aggregate node embedding vectors to construct a graph embedding. We refer interested readers to [11] for more detail. The length of the network embedding (ranging from 50 to 500) is determined using grid search and 10-fold cross-validation. We modify state-of-the-art methods to apply them to directed graphs: we run a random walk on directed graphs in sub2vec instead of a undirected graph. Some state-of-the-art methods also require node attributes for network embeddings and node degree are suggested for computing undirected graph embedding [11]. For directed networks, we use NetworkX to compute the in/out degree and centralities such as betweenness, closeness and in/out degree centrality for each node. We also consider additional attributes: counts of subgraphs of a specific triad that a node belongs to. These counts are normalized as a distribution indicating the likelihood a node belongs to a specific triad.
C. Network Type Classification
In network type classification, we are given the topological structure of a subgraph in a network. Our goal is to predict the type of interaction that an edge represents, e.g. email exchange or question answering.
Among all the datasets introduced in Section IV-A, EmailEU, EmailTraffic and SwitchApp datasets have ground truth labels (department ID or user ID) available for each sub-graph, which is created from email exchanges in a department or app switch behaviors of a user within a period of time. Hence, we can obtain all subgraphs for these communities in these three networks. For the other datasets, there is no ground truth information on network communities; we detect network communities using modularity [22] to obtain subgraphs. These subgraphs are converted into feature vectors using the pre-viously introduced embedding methods and assigned labels according to network types. Finally, we collect about 10,000 (sub)graphs from 2,355 real-world networks taken from 15 network types introduced above, which include Google+ and Twitter in social networks, high energy physics theory citation networks, Gnutella P2P networks, SwichApp and so on.
1) Static Directed Network: We use all datasets to eval-uate embedding methods on static networks. Note that we convert temporal networks into unweighted static networks by removing the timestamps on the edges. The accuracies of different embedding methods for network type classification are presented in Table I. We make the following observations:
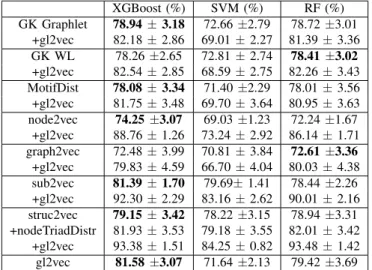
• The graph-based network embedding methods, GK Graphlet, sub2vec, gl2vec, and struc2vec with added subgraph features (triad distribution for a node), have a larger average accuracy compared to other node-based network embedding methods. This further validates the importance of including subgraph information into fea-ture representations for tasks like network classification in which network structure plays a significant role.
XGBoost (%) SVM (%) RF (%) GK Graphlet 78.94±3.18 72.66±2.79 78.72±3.01 +gl2vec 82.18±2.86 69.01±2.27 81.39±3.36 GK WL 78.26±2.65 72.81±2.74 78.41 ±3.02 +gl2vec 82.54±2.85 68.59±2.75 82.26±3.43 MotifDist 78.08±3.34 71.40±2.29 78.01±3.56 +gl2vec 81.75±3.48 69.70±3.64 80.95±3.63 node2vec 74.25±3.07 69.03±1.23 72.24±1.67 +gl2vec 88.76±1.26 73.24±2.92 86.14±1.71 graph2vec 72.48±3.99 70.81±3.84 72.61 ±3.36 +gl2vec 79.83±4.59 66.70±4.04 80.03±4.38 sub2vec 81.39±1.70 79.69±1.41 78.44±2.26 +gl2vec 92.30±2.29 83.16±2.62 90.01±2.16 struc2vec 79.15±3.42 78.22±3.15 78.94±3.31 +nodeTriadDistr 81.93±3.53 79.18±3.55 82.01±3.42 +gl2vec 93.38±1.51 84.25±0.82 93.48±1.42 gl2vec 81.58±3.07 71.64±2.13 79.42±3.69
TABLE I: Network type classification accuracy. We use “+” to denote an embedding generated by combining two embedding methods. Bold indicated best performance machine learning model for each embedding.
• The machine learning methods used also have an impact
on the results. For this task, XGBoost provides the best performance on average in network type classification. Although sub2vec is robust across all three machine learning models, gl2vec achieves the highest mean ac-curacy overall.
• We also combine gl2vecwith other methods by directly concatenating their feature representation vectors. We observe a significant improvement on these methods, especially for sub2vec and struc2vec. This suggests that a combination of approaches is the most suitable, as together they capture different, important features. Fur-thermore, there are also improvements on MotifDist and GK Graphlet. This indicates that adding null models to construct feature representations via SRPs helps improve performance. Finally, as representations from gl2vec, MotifDist and GK Graphlet all construct features from graphlets, the improvement that gl2vec brings is not as notable.
Fig. 2: Classifying email datasets and SwitchApp temporal networks.
2) Temporal directed network: We explore if temporal graphlets provide more information than static graphlets in temporal networks. We investigate their effect on predicting
XGBoost (%) SVM (%) RF (%) MotifDistr 56.68±6.70 45.82±7.38 61.54±10.50 +gl2vec 64.18±6.52 52.20±4.80 63.79±8.94 GK WL 50.96±8.91 47.92±6.15 57.01±6.91 +gl2vec 63.12±5.44 51.95±4.44 65.29±8.81 GK Graphlet 61.22±4.70 52.32±5.16 62.90±4.49 +gl2vec 62.04±5.69 52.22±4.85 64.35±8.86 node2vec 52.08±3.00 57.76±3.11 57.89±2.83 +gl2vec 63.20±3.69 59.20±5.89 63.22±3.40 sub2vec 55.45±3.42 52.02±3.29 59.87±3.77 +gl2vec 73.01±8.93 58.88±9.42 77.69±6.90 struc2vec 60.25±9.40 56.8±11.34 60.59±11.14 +nodeTriadDistr 60.78±9.13 59.86±9.22 61.24±9.88 +gl2vec 69.78±6.20 54.91±9.14 70.30±7.36 gl2vec 61.72±3.09 51.03±3.30 63.09±3.23
TABLE II: Accuracy in correctly identifying 26 EmailEU department in static directed networks.
whether a temporal (sub)graph is an email exchange network or the app switching behavior of a mobile user. The results are shown in Figure 2. From Figure 2, we observe that temporal information improves network type classification in all models considered here. Therefore, it is important to use temporal graphlets for constructing vectors for feature representations of temporal networks, since they capture more of the network dynamics than static graphlets.
D. Subgraph Identification
In subgraph identification, we are interested in classifying subgraphs within the same network given their topological structure. For example, we can identify which department an email exchange subgraph belongs to or detect a mobile phone user given their app switching behavior.
We use EmailEU, EmailTraffic and SwitchApp datasets since ground truth labels (department ID or user ID) are available for each subgraph, which is created from email exchanges within a department or by the app switch behavior of a user within a period of time. We first solve this problem using static graph embedding methods. Then we investigate whether the timestamp information of edges can help improve identification accuracy.
1) Static directed networks: Due to space constraints, we only present results on the accuracy of identifications of departments in EmailEU in Tables II, and direct the reader to [33] for results for EmailTraffic and SwitchApp networks. Overall, we note that gl2vec with a random forest model outperforms the other methods in terms of mean accuracy. Additionally, combining graphlet SRP features with the other methods results in a notable performance increase across the different machine learning models.
More broadly, we note that from Table II, random forest (RF) models are usually more accurate for graph embeddings that include our SRP feature vectors in baselines. This is because RF automatically performs feature selection during training and adapts to the change in number of features. As a result, it is easier for RF to achieve better results given a similar amount of effort fine-tuning the hyper-parameters.
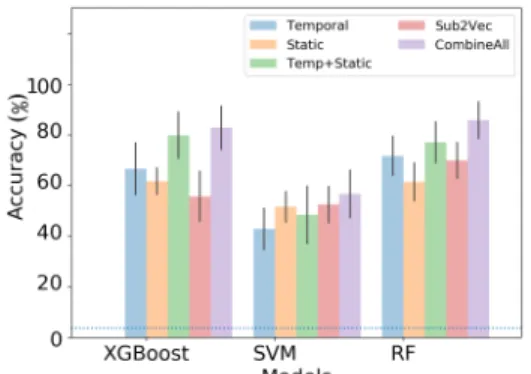
Fig. 3: Department identification in EmailEU dataset. Dash line represents the accuracy of a random selection model.
2) Temporal directed networks: In temporal networks from EmailEU and EmailTraffic, we attempt to identify which department emails belong to. For the SwitchApp dataset, we attempt to identify a particular user based on their daily app switching behavior represented as a temporal network.
For the EmailEU and EmailTraffic dataset, multiple tempo-ral and static networks are constructed for each department from email exchanges as described in Section IV-A2. For the SwitchApp dataset,42temporal and static networks are gener-ated for each person from their app switching behaviors every day. XGBoosting, SVM and random forest are implemented using different network feature representations: SRP with temporal (“Temporal”) graphlets, SRP with static (“Static”) graphlets, and a combination of both (“Temp+Static”). We illustrate the result from sub2vec representation (“Sub2Vec”) because it performs best among the baseline methods and cre-ate a combination of all three representations (“CombineAll”). Results for EmailEU is shown in Figure 3 and as with static networks, results for EmailTraffic and SwitchApp can be found in [33]. The dashed line is the accuracy of a random selection model. We note that the combination of static and temporal graphlet features (“Temp+Static”) produces an improvement in accuracy over each set of features individually. Addition-ally, our graphlet-based network embeddings are competitive against the state-of-the-art method, sub2vec. However, com-bining all three graph embedding vectors for classification yields the best accuracy. Overall, the results highlight that graphlet-based features capture important characteristics for network classification tasks.
V. RELATEDWORK
The primary focus of related works in classifying networks involves examining the topological structure of the graph. The work most related to our method is graph kernels, which has been used to calculate similarities between static undirected graphs [13], [36]. However, the corresponding computational complexity grows significantly with increases in network size. Moreover, studies surrounding graphlet kernels do not consider features generated by comparing graphlet count between an empirical network and random graphs from different null models, which we find leads to notable improvements in network classification tasks in our experiments.
Different node embedding techniques have been proposed in recent years, such as node2Vec [10], DeepWalk [27], and Line [31] that use feature vectors to embed nodes into high-dimensional space and empirically perform well. However, these methods are focused on node classification rather than graph classification. Additionally, neural networks [7], [14] recently obtained competitive results against kernel-based methods and graph-based regularization techniques, but they are computationally expensive and typically used only for small scale tasks.
Additionally, several approaches have been proposed to aggregate node feature vectors to a feature vector for networks. For example, a graph-coarsening approach [7] computes a hierarchical structure containing multiple layers, nodes in lower layers are clustered and combined as node in upper layers using element-wise max-pooling. However, this has high computational complexity. Recently, subgraph embedding based approaches have been proposed. struc2vec [28] applies a sum-based approach such as mean-field and loopy belief propagation to aggregate node embedding to graph represen-tation.sub2vec[1] embeds subgraphs with arbitrary structure, while graph2vec [20] was proposed based on a doc2vec framework to learn data-driven distributed representations of arbitrary sized graphs. however, these embedding techniques do not fully capture the network structure. Similar to ours is [2], which uses motif frequencies, while we use graphlet distributions and SRP. Furthermore, [2] also requires node labels in its use of network motifs, but we do not.
VI. CONCLUSION
We introduce gl2vec, a methodology for classifying static and temporal directed networks based on graphlet fea-tures their topological structure. Experiments with real-world datasets have shown that both temporal and static graphlets are important features for network type classification and subgraph identification tasks in comparison to state-of-the-art methods. Furthermore, we have illustrated that concatenating these two types of features with many state-of-the-art methods yields further accuracy improvements.
REFERENCES
[1] B. Adhikari, Y. Zhang, N. Ramakrishnan, and B. A. Prakash. Sub2vec: Feature Learning for Subgraphs. InPAKDD, 2018.
[2] E. G. Allan Jr, W. H. Turkett, and E. W. Fulp. Using network motifs to identify application protocols. InIEEE GLOBECOM, 2009.
[3] T. Chen and C. Guestrin. Xgboost: A Scalable Tree Boosting System. InACM SIGKDD, 2016.
[4] C. Cortes and V. Vapnik. Support-vector networks. Machine learning, 20(3):273–297, 1995.
[5] H. Dai, B. Dai, and L. Song. Discriminative embeddings of latent variable models for structured data. InICML, 2016.
[6] P.-T. De Boer, D. P. Kroese, S. Mannor, and R. Y. Rubinstein. A Tutorial on the Cross-Entropy Method.Annals of operations research, 134(1):19– 67, 2005.
[7] M. Defferrard, X. Bresson, and P. Vandergheynst. Convolutional Neural Networks on Graphs with Fast Localized Spectral Filtering. InNIPS, 2016.
[8] M. Doroud, P. Bhattacharyya, S. F. Wu, and D. Felmlee. The evolu-tion of ego-centric triads: A microscopic approach toward predicting macroscopic network properties. InIEEE SocialCom, 2011.
[9] A. Grover and J. Leskovec. node2vec: Scalable Feature Learning for Networks. InACM SIGKDD, 2016.
[10] A. Grover and J. Leskovec. node2vec: Scalable Feature Learning for Networks. InACM SIGKDD, 2016.
[11] W. L. Hamilton, R. Ying, and J. Leskovec. Representation learning on graphs: Methods and applications.arXiv:1709.05584, 2017.
[12] P. Holme and J. Saram¨aki. Temporal Networks. Physics reports, 519(3):97–125, 2012.
[13] R. Kaspar and B. Horst.Graph Classification and Clustering based on Vector Space Embedding, volume 77. World Scientific, 2010. [14] T. N. Kipf and M. Welling. Semi-supervised classification with graph
convolutional networks. arXiv:1609.02907, 2016.
[15] L. Kovanen, M. Karsai, K. Kaski, J. Kert´esz, and J. Saram¨aki. Temporal Motifs in Time-Dependent Networks.Journal of Statistical Mechanics: Theory and Experiment, 2011(11):P11005, 2011.
[16] M. Kretzschmar and M. Morris. Measures of concurrency in net-works and the spread of infectious disease. Mathematical biosciences, 133(2):165–195, 1996.
[17] J. Leskovec and A. Krevl. SNAP Datasets: Stanford large network dataset collection. http://snap.stanford.edu/data, June 2014.
[18] A. Mellor. Classifying Conversation in Digital Communication.
arXiv:1801.10527, 2018.
[19] R. Milo, S. Itzkovitz, N. Kashtan, R. Levitt, S. Shen-Orr, I. Ayzenshtat, M. Sheffer, and U. Alon. Superfamilies of Evolved and Designed Networks. Science, 303(5663):1538–1542, 2004.
[20] A. Narayanan, M. Chandramohan, R. Venkatesan, L. Chen, Y. Liu, and S. Jaiswal. graph2vec: Learning Distributed Representations of Graphs.
Arxiv preprint arXiv:1707.05005, 2018.
[21] M. Newman.Networks: an Introduction. Oxford university press, 2010. [22] M. E. Newman. Modularity and community structure in networks.
PNAS, 103(23):8577–8582, 2006.
[23] M. E. Newman and M. Girvan. Finding and Evaluating Community Structure in Networks. Physical review E, 69(2):026113, 2004. [24] M. E. Newman, S. H. Strogatz, and D. J. Watts. Random graphs with
arbitrary degree distributions and their applications. Physical review E, 64(2):026118, 2001.
[25] C. Olsson, P. Petrov, J. Sherman, and A. Perez-Lopez. Finding and explaining similarities in linked data. InSTIDS, 2011.
[26] A. Paranjape, A. R. Benson, and J. Leskovec. Motifs in temporal networks. InACM WSDM, 2017.
[27] B. Perozzi, R. Al-Rfou, and S. Skiena. Deepwalk: Online Learning of Social Representations. InACM SIGKDD, 2014.
[28] L. F. Ribeiro, P. H. Saverese, and D. R. Figueiredo. struc2vec: Learning Node Representations from Structural Identity. InACM SIGKDD, 2017. [29] N. Shervashidze, P. Schweitzer, E. J. v. Leeuwen, K. Mehlhorn, and K. M. Borgwardt. Weisfeiler-lehman graph kernels.Journal of Machine Learning Research, 12(Sep):2539–2561, 2011.
[30] V. Svetnik, A. Liaw, C. Tong, J. C. Culberson, R. P. Sheridan, and B. P. Feuston. Random Forest: a Classification and Regression Tool for Compound Classification and QSAR Modeling.Journal of chemical information and computer sciences, 43(6):1947–1958, 2003.
[31] J. Tang, M. Qu, M. Wang, M. Zhang, J. Yan, and Q. Mei. Line: Large-Scale Information Network Embedding. InWWW, 2015.
[32] K. Tu. Jmotif, 2018.
[33] K. Tu, J. Li, D. Towsley, D. Braines, and L. Turner. gl2vec: Learning feature representation using graphlets for directed networks. Arxiv preprint arXiv:1812.05473, 2018.
[34] K. Tu, J. Li, D. Towsley, D. Braines, and L. Turner. Network classification in temporal networks using motifs. In ECML/PKDD-AALTD, 2018.
[35] L. D. Turner, R. M. Whitaker, S. M. Allen, D. E. Linden, K. Tu, J. Li, and D. Towsley. Evidence to support common application switching behaviour on smartphones. Royal Society Open Science, 6(3), 2019. [36] P. Yanardag and S. Vishwanathan. Deep Graph kernels. In ACM
SIGKDD, 2015.
[37] H. Yin, A. R. Benson, J. Leskovec, and D. F. Gleich. Local Higher-Order Graph Clustering. InACM SIGKDD, 2017.