RESEARCH PAPER
Customer lifetime network value: customer valuation
in the context of network effects
Miriam Däs1&Julia Klier1&Mathias Klier2&Georg Lindner1&Lea Thiel1
Received: 1 June 2016 / Accepted: 17 March 2017
#Institute of Applied Informatics at University of Leipzig 2017 Abstract Nowadays customers are increasingly connected and extensively interact with each other using technology-enabled media like online social networks. Hence, customers are frequently exposed to social influence when making pur-chase decisions. However, established approaches for custom-er valuation mostly neglect network effects based on social influence. This leads to a misallocation of resources. Following a design-oriented approach, this paper develops a model for customer valuation referred to as the customer life-time network value (CLNV) incorporating an integrated net-work perspective. By considering the customers’net contri-bution to the network, the CLNV reallocates values between customers based on social influence. Inspired by common prestige- and eigenvector-related centrality measures it incor-porates social influence among all degrees of separation ac-knowledging its viral spread. Using a real-world dataset, we demonstrate the practicable applicability of the CLNV to de-termine individual customers’value.
Keywords Customer valuation . Customer lifetime value . Social influence . Network effects
JEL classification M10
Introduction
BWe went from a connected world to a hyperconnected world^ (Friedman 2013). Today, with around half of the world’s population online, people are ever more closely con-nected and therefore interact to a great extend with each other using technology-enabled media (ITU2016). In fact, the num-ber of users of online social networks (OSNs) worldwide is expected to rise from over 2 billion in 2016 to almost 3 billion in 2020 (eMarketer2014,2016). The large number of digitally connected people exerts a great impact on all areas of life and companies can no longer ignore this revolutionary transfor-mation of business and society with regard to future business success (e.g., Bond et al.2012). Marketers therefore see social marketing and digital commerce as the top areas of future technology investment (Gartner Group2015). By the rising number of connected customers, extensive social influence, for example through word-of-mouth (WOM), is exerted and dispersed with previously unknown reach, intensity, and speed. Consumer surveys reveal that up to 88% of online customers see WOM as the most trustable form of product recommendation (Nielsen 2015) and many customers rely on WOM when searching for information about products or services (Moon et al. 2010) or making purchase decisions (Chen and Xie2008). In fact, especially in the younger gen-eration around 85% of consumers naturally use OSNs for product research to gather information for their purchase de-cisions (Butler 2017; Solomon 2015). Furthermore, con-sumers more and more recommend products and companies via OSNs and also rely heavily on the recommendations of other consumers when it comes to purchase decisions (Chen and Xie 2008; Lis and Neßler 2014; Solomon 2015). This remarkable importance of customer-to-customer interactions has been on the one hand intensively discussed in prior re-search (Algesheimer and von Wangenheim2006; Libai et al. Responsible Editor: Rainer Alt
* Mathias Klier
[email protected];https://www.uni-ulm.de/en/mawi/itop/ profil/staff/mathias-klier/
1
University of Regensburg, Universitätsstraße 31, D-93053 Regensburg, Germany
2 University of Ulm, Helmholtzstraße 22, D-89081 Ulm, Germany DOI 10.1007/s12525-017-0255-4
2013; McAlexander et al.2002; Rossmann et al.2016). On the other hand, marketers state that WOM in social media is of particular relevance for their marketing activities and that they expect a strong growth of around 70% of marketing expendi-tures in this area in nearer future (WOMMA2014). With respect to customer valuation, it is consequently crucial for companies to evaluate customers not isolated from each other but in a network context. For instance, think of customers who do not purchase anything but whose social influence induces purchases of several other customers. When neglecting net-work effects, such customers would be valued as unprofitable and would be ignored in a company’s strategic decisions, al-though these customers do in fact add value to the company. An increase of the OSN share in the marketing budget up to 20% reveals the recognized importance of social media by marketers (The CMO Survey2016).
Even though research has dealt extensively with customer valuation (Berger and Nasr1998; Dwyer1997), network ef-fects in customer valuation have not been sufficiently investi-gated yet. Only very few studies started to address selected aspects of network effects in general customer valuation models (Domingos and Richardson 2001; Hogan et al. 2003). Also, regarding one of the most well-known customer valuation models, the customer lifetime value (CLV), research has considered social influence only rarely. Most of the existing approaches consider only direct network effects (i.e. influence among the first degree of separation) hence ignoring the viral spread of social influence inside a network beyond the first degree of separation (Klier et al.2014) and/or con-centrate on including network effects incentivized through referral campaigns (Kumar et al.2007,2010a,b; Lee et al. 2006) or other marketing and seeding programs (Hogan et al. 2004; Kumar et al.2013; Libai et al.2013) by compensating recommendations with a higher customer value. Further stud-ies extend the CLV by increasing a customer’s value based on network aspects arising outside of incentivized programs (Kumar et al.2010a; Weinberg and Berger2011). However, to the best of our knowledge, so far none of these studies has considered direct and indirect network effects in conjunction with the mirror-inverted effect yet: besides customers creating value in a network due to their direct and indirect influence on others, customers may alsoBowe^value to the network due to the social influence of other customers on their cash flows. Models neglecting this mirror-inverted effect are subject to double counting, as the additional value component representing network effects is once considered for the cus-tomer inducing other cuscus-tomers’cash flows and once for the customers actually generating these cash flows. In conse-quence, both double counting and the negligence of indirect network effects in existing customer valuation models lead to a misvaluation of individual customers and the whole custom-er base (i.e. a firm’s customer equity (CE)), resulting, for ex-ample, in suboptimal (marketing) decisions and strategies.
Therefore, following a design-oriented approach (Hevner et al.2004), the aim of this paper is to develop a novel model for customer valuation incorporating an integrated network perspective referred to as the customer lifetime network value (CLNV). We determine the value of a customer based on the present value of the individual cash flowsgenerated by him/ her and thepresent value of his/her net contribution to the network. The CLNV is inspired by prestige- and eigenvector-related centrality measures like Katz prestige (Katz 1953) or the PageRank algorithm (Brin and Page 1998), thereby acknowledging the viral characteristic of net-works. We demonstrate the applicability of the CLNV using a real-world case of a European OSN focusing on sports. Overall, the CLNV contributes to research and practice in three ways: First, it enables a well-founded valuation of indi-vidual customers incorporating an integrated network per-spective; second, it allows an allocation of not only direct but also indirect network effects inside a network; and third, it facilitates a sound determination of a company’s CE as the sum of all customers’CLNVs.
The paper is organized as follows: In the next section, we briefly review the theoretical foundations and related litera-ture. We then develop the CLNV model as a new customer valuation method. Afterwards, the applicability of the CLNV is demonstrated by using a real-world case of a European OSN focusing on sports. Finally, we give a brief summary and conclude with a discussion on limitations and directions for further research.
Literature background
Online customer networks and social influence
Due to technology-enabled media, people are increasingly connected and extensively interact with each other. Against this background, companies face the challenge that customers can no longer be regarded as isolated individuals. Rather, cus-tomers are parts of (online) social networks enabling them to interact across personal and regional boundaries. Similar to social networks in general (Adamic and Adar2003; Bampo et al. 2008; Kane et al. 2014; Wasserman and Faust1994) online customer networks can formally be represented by a graph consisting of a set of nodes (representing the customers) and a set of edges (representing relations or interactions be-tween pairs of customers).
Various studies have found the behavior of members in offline and online networks to be affected by social influence from other members in the network (Probst et al. 2013). Hereby, social influence can be induced through different forms of interactions, such as one-to-one or one-to-many WOM, observation and/or imitation, and information sharing with advice-seeking individuals (Arndt1967; Herr et al.1991;
Iyengar et al.2011b; Kumar et al.2010a; Libai et al.2013; Nitzan and Libai2011; Wangenheim and Bayón2007). Five causes of social influence in networks are discussed in litera-ture (Hinz et al.2014; Iyengar et al.2011b; Kane et al.2014; Van den Bulte and Wuyts2007): First, information transferred in interactions may increase the awareness of and interest for a topic such as a product (Katz and Lazarsfeld1955). Second, information about costs and benefits of actions reduces search efforts and uncertainty and therefore increases adaption (Iyengar et al.2011a). Third, normative pressure to fulfill the expectations of others (Asch1951), or fourth, imminence of real status and competitive disadvantages can induce a change in behavior. Fifth, network externalities can increase the sumption of goods, i.e., with every additional customer con-suming a good the value of concon-suming this particular good increases (Granovetter1978; Katz and Shapiro1994).
Many authors focus on direct social influence, i.e., influ-ence between two users that directly interact with each other (e.g., Klier et al.2014). However, social influence in OSNs does not stop at the first degree of separation as it takes place with an extended scope, speed, complexity, and independent of time and place (Gruzd and Wellman2014). To the contrary, content can spread Bvirally^ through the entire network (Hogan et al.2004; Nahon and Hemsley2013). Thus, it af-fects not solely the users directly, but also indirectly connected to the source. Such indirect influence, sometimes called the Bripple effect^ (Hogan et al.2004; Oestreicher-Singer et al. 2013), has been subject of research in context of offline social networks (Granovetter1973; Harary et al.1965) as well as OSNs (Goldenberg et al. 2009; Gruzd and Wellman2014; Hinz et al.2011; Hogan et al.2004; Kiss and Bichler2008). However, despite the viral diffusion of information in networks as a whole, research on indirect effects is of-ten limited to influence at the first degree of separation (Gruzd and Wellman 2014). Recent studies, for instance Gruzd and Wellman (2014), therefore demand and pre-dict a shift from social one-to-one influence to a more network-centric view, called Bnetworked influence^ (Gruzd and Wellman 2014, p. 1255).
Prior research shows that social influence, both direct and indirect, is of high practical relevance for companies: On the one hand, connections between customers can be used for referrals. Hence, social influence can help companies to ac-quire new customers at relatively low acquisition costs (Kumar et al.2007,2010a,b; Lee et al. 2006). Villanueva et al. (2008) and Schmitt et al. (2011) even found that in the long term customers acquired through customer referrals are more profitable for a company than customers acquired through traditional marketing. On the other hand, social influ-ence between customers can affect theBbelief, attitude, or behavior^of existing customers (Erchul and Raven1997, p. 138), including their purchase decisions and loyalty (Algesheimer and von Wangenheim 2006; Hogan et al.
2004; Kumar et al. 2010a; Nitzan and Libai 2011; Soares and Pinho2014; Weinberg and Berger2011). Consequently, companies increasingly try to actively manage customers’ in-teractions by identifying and targeting those customers with large influence on other customers, so-called influencers (Bampo et al. 2008; Goldenberg et al. 2009; Gruzd and Wellman 2014; Heidemann et al. 2010; Hinz et al. 2011; Trusov et al.2010; Zhang et al. 2011). Recent research has highlighted that, in addition to customer characteristics such as age, gender, education, and expertise (Aral and Walker 2012; de Valck et al. 2009; Eccleston and Griseri 2008; Gladwell2000; Katona et al.2011; Watts and Dodds 2007; Zhang et al.2011), the structure of the network can affect a customer’s influence on other customers. In this context, a customer’s connectivity, for example his/her number of direct or indirect connections, is shown to affect a customer’s influ-ential power (Algesheimer and von Wangenheim 2006; Ganley and Lampe2009; Goldenberg et al.2009; Hinz et al. 2011; Kiss and Bichler 2008; Nitzan and Libai 2011). Additionally, as inactive connections do not imply social in-fluence, customers’communication activities or interactions are increasingly used to identify influencers (Cheung and Lee 2010; de Valck et al.2009; Heidemann et al.2010; Kane et al. 2014; Mtibaa et al. 2010). To take into account the entire network structure when identifying influencers, several au-thors have started to implement approaches based on prestige- and eigenvector-related centrality measures like Katz prestige (Katz 1953), Bonacich centrality (Bonacich 1972), or the PageRank algorithm (Brin and Page1998) (cf. e.g., Heidemann et al.2010; Kiss and Bichler2008; Mtibaa et al.2010). Their approaches use iterative calculations to quantify a user’s influence in a network based on the users’ connections in the network.
In this paper, we argue that it is essential to not only iden-tify and target influencers but to likewise consider their social influence in customer valuation. Thus, a customer’s value should not solely consider the cash flows generated by him/her (e.g., through purchases) but also the network effects in terms of his/her direct and indirect social in-fluence on the cash flows of others in the network (e.g., through WOM) and vice versa.
Customer valuation and network effects
Customer valuation has been subject of extensive prior re-search (Berger and Nasr1998; Kotler and Armstrong1996). The classic CLV constitutes one of the most well-known tomer valuation models. It is defined as the sum of a cus-tomer’s discounted present and expected future cash flows (Berger and Nasr1998). Hence, it considers the profit a com-pany is expecting to earn with a customer over his/her lifetime therefore reflecting all monetary and non-monetary aspects like customer satisfaction which some day find expression in
the customer’s cash flows (Gupta et al.2006). The CLVand its various adaptions have proven useful in a variety of contexts such as segmenting customers, optimizing the timing of prod-uct offerings, evaluating competitor companies, or supporting merger and acquisition decisions (Kumar et al.2004,2008; Venkatesan and Kumar2004).
However, recent studies (Verhoef and Lemon2013) show that it is essential to consider network effects in customer valuation. Indeed, a customer’s value can no longer be based solely on a customer’s purchase behavior. Rather, a cus-tomer’s contribution to a company goes beyond direct trans-actions and includes elements like the value of social influence (Domingos and Richardson2001; Hogan et al.2003; Klier et al. 2014; Kumar et al. 2010a; Malthouse et al. 2013; Weinberg and Berger2011). Against this background, few authors started to address selected aspects of network effects in general customer valuation models (Domingos and Richardson2001; Hogan et al. 2003). Hogan et al. (2003), for instance, incorporate direct and indirect network effects when assessing the value of a lost customer using a product growth model. They argue that a company losing a customer does not only lose his/her future cash flows but also the cash flows of other customers due to slower customer acquisition resulting from reduced social influence. Another example is the work of Domingos and Richardson (2001) who model a Markov random field distinguishing two components: the cus-tomer’s intrinsic value representing the value s/he generates individually via purchases, and the customer’s network value representing the value s/he generates via social influence on other customers.
Also with respect to the CLV, prior research has considered selected aspects of network effects (Hogan et al.2004; Kumar et al.2007,2013,2010a,b; Lee et al.2006; Libai et al.2013; Weinberg and Berger2011). Thereby, most of the studies fo-cus on network aspects arising in campaign contexts, i.e., incentivized through marketing campaigns or seeding pro-grams (Hogan et al.2004; Kumar et al. 2007; Kumar et al. 2013; Kumar et al.2010b; Lee et al.2006; Libai et al.2013). Lee et al. (2006) and Kumar et al. (2007), for instance, take account of social influence in form of referral campaigns (Kumar et al.2007; Kumar et al.2010b). When valuating a customer, these studies consider the original cash flows gen-erated by a customer (as in the classic CLV) and add a second component, often called Bcustomer referral value^ (CRV), covering cash flows of other customers that have been in-duced by him/her through a referral. Lee et al. (2006) consider a customer’s original cash flows as well as the savings in acquisition costs for new customers obtained through that customer’s social influence. Kumar et al. (2007) estimate a customer’s referral value by determining either the entire transaction value (i.e., the net present value of all future cash flows and the savings in acquisition cost) or solely the savings in acquisition cost for customers who would not have joined
the company without his/her referral (Kumar et al. 2007, 2010b). Both Lee et al. (2006) and Kumar et al. (2007) focus on direct network effects considering only referrals among the first degree of separation (like Klier et al. (2014)). In addition, Hogan et al. (2004), Libai et al. (2013), and Kumar et al. (2013) measure the value of WOM incentivized through ad-vertising or seeding programs. While Libai et al. (2013) estab-lish the value of entire WOM-seeding programs using agent-based modeling, Hogan et al. (2004) determine the value of individual customers in context of WOM by adding all cash flows of other customers in the network induced by their WOM to these customers’CLV. Both studies acknowledge the fact that WOM spreads deep inside a network (i.e. beyond the first degree of separation). The approach of Libai et al. (2013), however, does not allow for a definite determination of indirect network effects. Kumar et al. (2013) measure the monetary impact of (incentivized) WOM by, first, identifying influencers based on historical data, second, encouraging those influencers with incentives to share their opinion, and third, determining the value of influence for each customer. Hereby, a customer’s value of influence is composed by the CLV of all people that are influenced by him/her (Binfluencees^) and, incorporating indirect network effects, a share of the cash flows those influencees received for influencing others.
Next to that, further studies have implemented CLV-based approaches measuring social influence in non-campaign con-texts, i.e., arising outside of incentivized marketing
cam-paigns or seeding programs (Kumar et al. 2010a;
Weinberg and Berger 2011). For example, Kumar et al. (2010a) introduce the Bcustomer influencer value^ as a value component comprising all network effects that are not formally incentivized by a company. For instance, effects occurring due to regular user interaction in social media are included. They quantify the customer influencer value based on a customer’s number of connections, the strength of those connections, and the Bemotional valence^ of the customer’s interactions (Kumar et al. 2010a, p. 302). They do, however, not focus on social influence Bbeyond the close social network^ of a custom-er (Kumar et al. 2010a, p. 301). Similarly, Weinberg and Berger (2011) define the total value of a customer, re-ferred to as the Bconnected customer lifetime value^, as the sum of the CLV, the customer referral value, and the Bcustomer social media value^. The latter is determined by multiplying the CLV with impact factors considering the influential power and the customer’s respective en-gagement level for each social medium used. They there-by include solely direct social media based non-incentivized effects (Weinberg and Berger 2011).
Summing up, previous studies have started to consid-er selected aspects of network effects in customconsid-er valu-ation. They emphasize that besides the cash flows
generated by a customer when purchasing products or services, a customer’s value should also consider the effect of his/her social influence on the cash flows of other customers in the network. To do so, previous work suggests adding further value components to the classic CLV representing the value of positive network effects.
Research gap
Prior studies have started to include the relevance of customers with high social influence on other customers in customer valuation. However, they have not consid-ered the mirror-inverted effect yet: besides customers creating value in the network due to their influence on others, customers may also Bowe^ value to the network due to the social influence of others on their purchasing behaviors. Hence, existing models are subject to double counting, as the additional value component representing the network effects is considered multiple times – once for the customers inducing other customers’ cash flows and once for the customers actually generating these cash flows. Overestimating the value of a customer (e.g., due to double counting when calculating his/her CLV) might lead to wrong decisions. For example, potential new cus-tomers might be acquired or existing cuscus-tomers might be bound at too high cost (exceeding their Btrue^ value for the firm). Indeed, double counting is a serious issue if it is important to have a best possible indication regarding theBtrue^ value of a customer for the firm. Several stud-ies have acknowledged that their approaches cause dou-ble counting (Kumar et al. 2010b; Weinberg and Berger 2011). Kumar et al. (2010a, p. 308), for example, recog-nize that B[a]lthough CLV and CRV involve separate metrics, they cannot be added up across all customers^. If a company’s CE is calculated based on these models, it is admittedB[…] that the sum of all customers’ CCLV [connected customer lifetime value] is greater than the
sum of all customers’ CLV^ (Weinberg and Berger
2011, p. 342). Next to that, with regard to the diffusion of social influence in networks, only a few studies have started to acknowledge indirect network effects when valuating customers. Consequently, most of the existing valuation models underestimate the true value of cus-tomers’ influence beyond the first degree of separation (Klier et al. 2014; Kumar et al. 2007) and at the same time overestimate the value of customers being the inter-mediaries of those. Besides, even fewer studies provide an actual method to allow the computation of indirect network effects. In fact, we found only two CLV-based approaches (Hogan et al. 2004; Kumar et al. 2013) en-abling an allocation of both direct and indirect network effects in customer valuation.
Modeling the customer lifetime network value
Basic setting
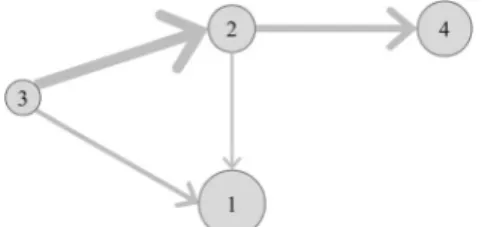
We consider a network of interlinked customers. The network can be represented by a set of nodes and a set of directed and weighted edges. Each node represents a customer and each edge represents the direction and strength of influence be-tween a pair of customers, for example induced by WOM spread through private messages (Adamic and Adar2003; Bampo et al.2008; Heidemann et al.2010; Hinz et al.2011) or other sorts of user interaction. Customers in the network can generate cash flows through purchases. The existence and amount of these cash flows, however, may depend on the influence of other customers in the network. Note that the influence between two customers can be direct as well as indirect. Indirect influence exists when customers, who have been influenced by another customer, again influence others. To illustrate the setting, we use an example of a network of four customers (1, 2, 3, and 4) who generate cash flows and positively influence each other both directly and indirectly (cf. Fig.1). The size of a node represents the amount of cash flows generated by a customer. Direct influence between a pair of customers is visualized by an edge between two customers. The direction of the edge represents the direction of influence; the size of the edge characterizes the strength of influence. Indirect influence between two customers is represented by two or more edges forming a path (e.g., from customer 3 to customer 4 via customer 2).
First, we consider direct network effects. Both customers 2 and 3 exert direct influence on customer 1. Thus, parts of the cash flows generated by customer 1 might depend on the influence of customers 2 and 3, i.e., they might not have been generated without their positive influence. Consequently, the value of customer 1 would be overestimated when solely looking at the cash flows generated individually by him/her. At the same time, a customer’s value can be underestimated when regarding his/her cash flows as isolated (Domingos and Richardson2001; Hogan et al. 2003; Weinberg and Berger 2011). Customer 3, for example, might highly influence cus-tomers 1 and 2. Hence, the value of customer 3 within this network might be higher than indicated by his/her individually generated cash flows. Second, we can observe not only direct but also indirect influence in the customer network. Customer
3 directly influences customer 2, who again exerts direct in-fluence on customer 4. Thus, along this path, customer 3 might indirectly influence customer 4. Parts of customer 4’s cash flows may therefore not only depend on the influence of customer 2, but also on the influence of customer 3. Hence, considering solely direct influence would lead to an overesti-mation of the value of customer 2 and an underestioveresti-mation of the value of customer 3. This rather straight forward example already shows that enhancing classic valuation methods (Berger and Nasr 1998) by accounting for not only di-rect (Klier et al. 2014) but also indirect influence of customers is crucial for companies, as ignoring such network effects when deciding Bwhich customer to mar-ket to can lead to severely suboptimal decisions^ (Domingos and Richardson 2001, p. 57).
Basic idea
The aim of this paper is to develop an approach for valuating customers in the presence of direct and indirect network ef-fects induced by the influence among customers. As a starting point, we assume the structure of the customer network (i.e., the number of nodes and the directed and weighted edges) and each customer’s cash flows as given. To calculate the CLNV, we divide the customer value into two components: (1) the individual cash flowsgenerated by him/her individually and (2) a network component incorporating direct and indirect network effects, which represents his/her net contribution to the network, referred to asΔnetwork contribution:
CLN V¼present value o f individual cash f lows þpresent value o f Δnetwork contribution Compared to previous studies that have started to include network effects in customer valuation (Kumar et al.2007, 2010a,b; Libai et al.2013; Weinberg and Berger2011), our network component,Δnetwork contribution, differs out of two reasons: First, while previous work simply includes the effect a customer has on the network, our approach proposes to consider the mirror-inverted effect as well, i.e., the effect the network has on the customer. Thus, we are not solely increas-ing a customer’s value when s/he is exerting influence on others, our approach also decreases a customer’s value when his/her cash flows are induced by the influence of others. In contrast to existing research on network effects in customer valuation, our network component can consequently be posi-tive, negaposi-tive, and zero, depending on the influence or suscep-tibility of the respective customer. Second and instead of a mere incorporation of direct network effects (Klier et al. 2014), we propose to incorporate also indirect influence in our network component.Thereby, our approach is inspired by the basic idea of prestige- and eigenvector-related
centrality measures like Katz prestige (Katz1953), Bonacich centrality (Bonacich1972), or the PageRank algorithm intro-duced by Brin and Page (1998). In contrast to other centrality measures, like degree centrality (cf. Freeman 1979), these measures are able to consider direct and indirect influence in networks. Indeed, PageRank is probably the most well-known algorithm to rank a web page’s importance in the World Wide Web (WWW) based on the links pointing to this web page. In particular, the greater the amount of links a web page receives and the higher their importance, the greater is the importance of a web page itself (Brin and Page1998; Page et al.1999). By Biterating the computation until it converges^ (Page et al. 1999, p. 4), the algorithm allows for a full network approach considering the entire network structure. Since our approach aims at accomplishing the latter for customer valuation such an iterative approach considering the customers’influence among all degrees of separation seems particularly promising to determineΔ network contribution. Note that, while our work is inspired by the iterative idea of prestige- and eigenvector-related centrality measures, it is not possible to directly use or simply adapt these measures for our purpose. With respect to the PageRank algorithm, for example, there is a significant difference to our context since we do not increase a node’s value based on the edges pointingtoit but based on the edges pointingawayfrom it. This is due to the fact that in our case a customer’s value is higher the more customer s/he influences (i.e., edges pointing from him/herto other cus-tomers). Considering the mirror-inverted effect, a node’s value is decreased based on the edges pointingtoit.
Basic model of the customer lifetime network value Along the lines of the classic CLV (Berger and Nasr1998), we define the CLNV as the present value (discount rate:d∈Rþ) of a customer’s assigned current and expected future cash flows with respect to the expected lifetime T∈Nof the customer relationship.1 Thereby, building on previous works (Domingos and Richardson 2001; Weinberg and Berger 2011), we define the customer’s assigned cash flows as the sum of the expected cash flowsCFi;t∈Rgenerated by custom-eriin periodtand a network component. Latter differs from existing research: First, instead of solely including the positive effect a customer has on the network (e.g., induced by referrals toothers), we also consider the positive effect the network has on the customer (e.g., induced by referralsofothers). Second, we take the entire network structure into account, thus incor-porating also indirect influence among customers. Hence, the network component is determined by subtracting the cash flowsCFinfluencedi;t ∈Rof customerithat are induced by direct and indirect positive influence of other customers from the 1An overview of the mathematical notation is provided in Table6(cf. Appendix1).
cash flowsCFinfluencei;t ∈Rof other customers that are induced by the direct and indirect positive influence of customeri. The CLNV of a customeriis defined as follows:
CLNVi¼∑Tt¼0
CFi;tþ CFinfluence
i;t −CFinfluencedi;t
1þd
ð Þt ð1Þ
CFinfluencei;t comprises all cash flows of other customers jin periodtthat have been induced directly or indirectly by cus-tomeri. The respective set of customersjbeing influenced directly by customer i in period t is referred to as Influenced(i, t). Along the same lines, we defineInfluence(j, t) as the set of customers exerting direct influence on customer j in period t. Referring to a customer j ∈ Influenced(i, t), CFinfluencei;t on the one hand comprises cash flows induced by the influence of customeriwhich are generated by customerj and are thus part ofCFj,t. On the other hand,CFinfluencei;t must also take into account the indirect influence of customerivia customerjon other customers in the network. Therefore, we build our approach on the basic idea of prestige- and eigenvector-related centrality measures and add an iterative componentCFinfluencej;t . By this means, a customeri’s influence among all degrees of separation is included inCFinfluence
i;t . The
share of a customerj’s cash flowsCFj,tandCFinfluencej;t , which traces back to the influence of other customers in the network, is represented by the parameterα∈[0 , 1[.2The respective cash flows (α∙CFj,tandα∙CFinfluencej;t ) are allocated to the customers exerting influence on customer j in period t. Thereby, to ensure a fair distribution of induced cash flows among all influencers, customer i is ascribed the share
sit→j
∑ k∈Influenceð Þj;t
skt→j
depending on his/her relative strength of
in-fluencesit→j∈Ron customerjin periodtwith respect to the
strength of influenceskt→jof all customersk∈Influence(j, t) on
customer j. For each degree of separation the influence and therefore the share of the cash flows tracing back to the influ-ence of customer i is reduced by the factor α ∈ [0; 1[. Therefore, a diminishing effect inαwith 0≤ α<1 (i.e.α,
α2
,α3,…where 1 >α> α2> α3>…> 0 holds) can be observed. Due to this diminishing effect and in accordance with the convergence of the geometric series for parameters from the interval [0; 1[ the single summands approach zero and CFinfluencei;t converges. Altogether CFinfluencei;t can be expressed as denoted in Eq. (2).
C Fin f luence i;t ¼ ∑ j∈In f luenced ið Þ;t sit→j ∑k∈In f luence jð Þ;t skt→j α⋅C Fj;tþα⋅C Fin f luencej;t ð2Þ Along the same lines, we defineCFinfluencedi;t as the sum of all cash flows of customeriin periodtthat are induced by the direct and indirect influence of other customers. Thereby, both the cash flows generated by customeri(CFi,t) and the cash flows induced by the direct or indirect influence of customeri(CFinfluencei;t Þhave to be considered accordingly. Thus,CFinfluencedi;t is defined as stat-ed in Eq. (3) (with∑j∈Influenceð Þi;t s
j→i t ∑k∈Influenceð Þi;tsk→i t ¼1 ): CFinfluenced i;t ¼∑j∈Influence ið Þ;t stj→i ∑k∈Influence ið Þ;tskt→i α⋅CFi;tþα⋅CFinfluencei;t ¼α⋅CFi;tþα⋅CFinfluencei;t ð3Þ
Finally, based on Eqs. (1) to (3) we define the CLNV of a customerias follows: CLNVi¼∑Tt¼0 CFi;tþ∑j∈Influencedð Þi;t sit→j ∑k∈Influenceð Þj;ts k→j t α∙CFj;tþα∙CFinfluencej;t − α∙CFi;tþα∙CFinfluencei;t 1þd ð Þt ð4Þ
Extension of the basic model considering negative social influence
In the basic model of the CLNV as introduced above we focused on positive social influence and did not include the effect of possible negative WOM (Kumar et al. 2010a; Weinberg and Berger 2011). Nevertheless, it is important to keep in mind that negative influence among customers may indeed result in cash flow 2
It is generally possible to define the share of cash flows tracing back to influence in the network as a customer and/or period specific parameter. To do so, the parameterαmay for example be replaced by the parameterαtj∈[0, 1[ representing the share of customerj’s cash flows in periodt, which traces back to the influence of other customers in the network. By means of the parameterαtjit can be considered that some customers in the
network may be more susceptible to social influence than others and that this fact may vary over time. For reasons of simplicity, we refrain from this differentiation at this point.
p o t e n t i a l o f c u s t o m e r s t h a t c a n n o t b e r e a li z e d (Beconomic damage^). To address this issue, in this sub-section, based on Eq. (1) of the basic model of the
CLNV, we propose an extension subtracting an addition-al vaddition-alue component to account for the effect of possible negative social influence:
CLNVi¼∑Tt¼0
CFi;tþ CFinfluence
i;t −CFinfluencedi;t
− CFnegative influencei;t −CFnegatively influencedi;t
1þd
ð Þt ð5Þ
CFnegative influencei;t comprises the additional cash flow potential of other customers that cannot be realized in periodtdue to direct or indirect negative influence of customer i. CFnegatively influencedi;t denotes the additional cash flow potential of customerithat cannot be realized in periodtdue to negative influence of other customers on customeri. Analogously to the term CFinfluencei;t −CFinfluencedi;t
representing the network effects attributable to positive influence in the basic model of the CLNV, the network effects resulting from negative in-fluence are considered in an additional network component
CFnegative influencei;t −CFnegatively influencedi;t
which is subtracted in the extended model (cf. Eq. (5)). By this means, positive and negative influence are considered in a well-founded way
not mixing up the respective effects. Thereby,
CFnegative influencei;t andCFnegatively influencedi;t can be defined along the lines of the respective parameters of the basic model in-corporating direct and indirect network effects (cf. Eqs. (2) and (3)), however, not referring to positive influence and cash flows induced by positive influence in periodtbut to negative influence and additional cash flow potential of customers that cannot be realized in periodtdue to negative influence.
Illustrative example
Basic model of the customer lifetime network value
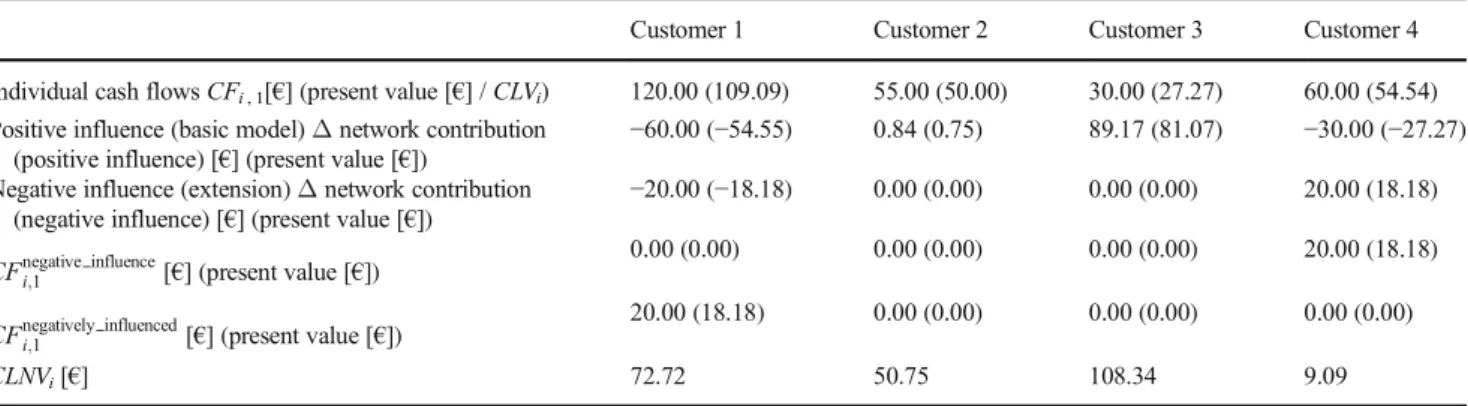
Consider Fig.2for a sample customer network to illustrate the application of the CLNV. In this example we supplemented the network previously introduced by further information on cash flows,CFi,t, and the strength of positive influence,sit→j.
A time horizon of one period (T= 1), a discount rate of 10%
(d= 0.10), and a share of cash flows tracing back to influence in the network of 50% (α= 0.50) are assumed.
First,CFinfluencei;t is calculated using Eq. 2. In most real-world cases, manually calculating CFinfluencei;t for all nodes might be difficult due to its iterative component (to see how to cope with this issue cf. subsection BApplication of the Customer Lifetime Network Value^). However, in our exam-ple, with customers 1 and customer 4 not exerting any influ-ence resulting inCFinfluence1;1 =CFinfluence4;1 = 0€, a manual cal-culation is possible and for illustration purposes advanta-geous. The cash flows induced by customer 2 can be calculat-ed as follows:CFinfluence
2;1 = 4/9∙(0.50∙120€+ 0.50∙0€) + 12/ 12∙(0.50∙60€+ 0.50∙0€) = 56.67€. In this respect, 4/9 repre-sents the relative strength of influence customer 2 exerts on customer 1, calculated by comparing the absolute strength of influence of customer 2 on customer 1 (s21→1= 4) to the overall strength of influence that customer 1 receives from the net-work (i.e.,s21→1 +s31→1 = 9). The factor 12/12 is calculated analogously. On this basis, CFinfluence3;1 can be determined to CFinfluence3;1 = 5/9∙(0.50∙120€ + 0.50∙0€) + 20/20∙(0.50∙55
€+ 0.50∙56.67€) = 89.17€. Second,CFinfluencedi;t is calculated for each customer applying Eq.3. For example,CFinfluenced3;1 yields 0€, as customer 3 is not influenced by any other cus-tomer. For customer 2, however,CFinfluenced2;1 is calculated as follows:CFinfluenced2;1 = 20/20∙(0.50∙55€+ 0.50∙56.67€) = 55.84
€. Finally, the CLNV can be calculated using Eq.4. For cus-tomer 3, this results in CLNV3= (30€ + 89.17€ – 0€)/(1 +
0.10)1= 119.17€/1.101= 108.34€. Table 1 summarizes the results. Customer 1 and customer 4 have a negative net con-tribution to the network (CFinfluencei;1 −CFinfluencedi;1 ), while cus-tomer 3 has a highly positive one and cuscus-tomer 2’s is close to zero.
To illustrate the impact of network effects in custom-er valuation, we compare the CLNV of all customcustom-ers with the classic CLV of 109.09€ for customer 1, 50.00
€ for customer 2, 27.27€ for customer 3, and 54.54€ for customer 4 (cf. present value of individual cash flows in Table 1). While customer 3 is not influenced by other customers, customer 1 and customer 4 Bowe^ a share of their cash flows to the network. As a consequence, their
CLNV is substantially lower than their classic CLV. In contrast, the CLNV for customer 3 is considerably higher than the classic CLV, since s/he is inducing a share of the cash flows of the customers 1, 2, and 4. For customer 2, the CLNV and the classic CLV are almost identical, as the cash flows of other customers induced by the influence of customer 2 roughly equal the cash flows that customer 2 Bowes^ to the network due to the influence of customer 3. This reflects the basic idea of our model reallocating cash flows without changing the overall value of the network. The sum over the CLNVi and the CLVi for all four customers both yield 240.90€.
To illustrate the impact of indirect network effects, we in-vestigate the customers’values when neglecting the iterative component of Eq.2. The value of customer 3, for instance, is underestimated by about 25€(24%) when solely focusing on direct influence. Since customer 2 is the intermediary of cus-tomer 3’s indirect influence on the network, the value of cus-tomer 2 is consequently overestimated by about 25€(50%) when neglecting indirect influence. For the customers 1 and 4 no differences are observed. This is due to the fact that they neither are intermediaries nor exert indirect influence inside the network. Thus, this example illustrates the importance of incorporating not only direct but also indirect network effects in customer valuation.
Extension of the basic model considering negative social influence
Considering negative social influence can be illustrated in a similar manner. Indeed, the underlying idea of the model’s extension is to reallocate additional cash flow potential of customers that cannot be realized due to negative influence considering direct and indirect network effects following the iterative idea already pursued to account for positive influence in the basic model (cf. Eqs. (2) and (3)). Thereby, considering the respective additional cash flow potential of customers that cannot be realized due to negative influence once for the cus-tomers negatively influenced (cf.CFinfluenced
i;t ) and once for the
customers exerting negative influence (cf.CFinfluencei;t ) with different signs (cf. Eq. (5)) ensures that the overall value of the network does not change compared to the basic model (Bzero-sum logic^of the model extension).
To illustrate the basic idea of the extension of the basic model, we slightly supplement the example introduced before (cf. Fig.2) as follows: Customer 4 exerts direct negative in-fluence on customer 1. The additional cash flow potential of customer 1 that cannot be realized due to this negative influ-ence is 20€ (i.e.CFnegatively influenced1;1 ¼20€ ). As we do not observe negative influence between any other pair of
cus-tomers, it follows that
CFnegative influence1;1 −CFnegatively influenced1;1
¼ð0€−20€Þ ¼−20
€for customer 1, CFnegative influence4;1 −CFnegatively influenced4;1
¼ 20€−0€
ð Þ ¼20€ for customer 4, and accordingly 0€for all other customersiwithi∈{2, 3}. Incorporating the additional value component to account for the effect of negative influ-ence in the CLNV using Eq. (5) leads toCLNV1= (120€+ (0€ – 60€)– (0€ – 20€))/(1 + 0.10)1= 80€/1.101= 72.73€for customer 1 and CLNV4 = (60€ + (0€ – 30€) – (20€ – 0 €))/(1 + 0.10)1= 10€/1.101= 9.09€for customer 4, respec-tively. Table2summarizes the results for the extended model of the CLNV.
Compared to the results of the basic model of the CLNV, on the one hand, the higher CLNV for customer 1 adequately reflects the customer’s additional cash flow potential–indeed, without the negative influence of customer 4, s/he would gen-erate additional cash flows of 20€. On the other hand, the lower value for CLNV4 represents that due to the
negative influence of customer 4 20€ of the additional cash flow potential of customer 1 cannot be realized. Hence, the differences in value of both customers are taken into account and at the same time the sum of the customers’ CLNVs (i.e. CLNV1+CLNV2+CLNV3+ CLNV4= 240.90€) stays the same and still equals the
net present value of all cash flows generated by the whole customer base. The latter is important to ensure a consistent customer valuation neither disregarding nor double counting cash flows.
Table 1 CLNV example (basic model)
Customer 1 Customer 2 Customer 3 Customer 4
Individual cash flowsCFi, 1[€] (present value [€] /CLVi) 120.00 (109.09) 55.00 (50.00) 30.00 (27.27) 60.00 (54.54)
Δnetwork contribution [€] (present value [€]) −60.00 (−54.55) 0.83 (0.75) 89.17 (81.07) −30.00 (−27.27) CFinfluence
i;1 [€] (present value [€])
0.00 (0.00) 56.67 (51.51) 89.17 (81.07) 0.00 (0.00)
CFinfluencedi;1 [€] (present value [€])
60.00 (54.55) 55.84 (50,76) 0.00 (0.00) 30.00 (27.27)
Demonstration of the applicability
In the following, as an essential part of the Design Science research process (Gregor and Hevner2013; Hevner et al. 2004; Peffers et al.2007), we demonstrate the practical appli-cability of our CLNV model.
Setting and dataset
The European OSN focusing on sports was founded in 2007. It was initially designed as a pure OSN for active and passive sportsmen interested in socializing and communicating about sports related topics like fitness, nutrition, or health. For in-stance, users discuss sports events like the soccer world cup or compare workout plans. The OSN provides users with basic functions to socialize and interact with each other (i.e., creat-ing user profiles, managcreat-ing contacts, and sendcreat-ing messages) comparable to other OSNs. One major difference to OSNs such as Facebook is, however, that the OSN did not have a public Bwall^ at the time of our investigation. The public discussion forums of the OSN under consideration, enabling publicly visible one-to-many distribution of messages, were only rarely used. Rather, the users usually took the opportuni-ty to send private messages to one specific other user within the OSN. Therefore, in the following we focus on this kind of messages. Here, the OSN under investigation provided in form of a private message functionality the possibility for users to establish direct and private one-to-one connections to other users. In 2009, the OSN’s operators started an affili-ated online shop on a pilot basis selling sports products. The shop was intended as a supplementary area of engagement and as an additional source of revenue besides advertising. During the time frame under consideration, the shop offered selected sports products with attractive discounts exclusively to mem-bers of the OSN.
In order to successfully launch and advertise the affiliated shop, the OSN’s operators planned to run user specific targeted marketing campaigns. To do so, key users were sup-posed to be identified, segmented, and addressed based on
their customer values. The operators emphasized that besides actual customers purchasing products, users who are actively involved in the OSN and recommend products to other users are also expected to be valuable for the shop. These users were supposed to help the OSN to increase the number of cus-tomers by leveraging their direct and indirect influence on other users’purchase decisions. Hence, the classic CLV was not adequate for the required customer valuation. Instead we agreed to consider both direct and indirect network effects by using our CLNV model. Indeed, the OSN and its affil-iated shop provide an optimal setting to apply the CLNV model in a real-world case. Having access to both data on user interactions in the OSN and on their actual purchase behavior gives us the rare opportunity to integrate network effects based on influence among (potential) customers into customer valuation. Please note that the focus of the application is on the revenues from the affiliated online shop only, we do not consider revenues from additional sources such as advertising.
We use two datasets including interaction and purchasing data of the OSN and its affiliated shop spanning a nine-month period between July 2009 and March 2010. Consider Table3 for a description of the datasets. The first dataset comprises all users of the OSN and the messages exchanged among these users in the relevant period including information on the send-er, the recipient, and the time stamp. This dataset contains 60,029 users. Overall, 264,017 messages were sent by 5,902 of these users in the period under investigation. The low share of users sending messages is typical for networks such as OSNs and ha s a lso b een fo und in p rior res ear ch (Benevenuto et al. 2009; Wilson et al. 2009). All of the 60,029 users received at least one message. The second dataset contains information about the users purchasing prod-ucts in the online shop, including the date of the purchases and the corresponding gross contributions. In total, 650 purchases were made by 497 of the 60,029 users. The minimum amount of purchases of these users was one, the maximum was eight. The average gross contribution of a customer’s purchase was 49.45€, with a maximum of 390€.
Table 2 CLNV example (extension of the basic model)
Customer 1 Customer 2 Customer 3 Customer 4
Individual cash flowsCFi, 1[€] (present value [€] /CLVi) 120.00 (109.09) 55.00 (50.00) 30.00 (27.27) 60.00 (54.54)
Positive influence (basic model)Δnetwork contribution (positive influence) [€] (present value [€])
−60.00 (−54.55) 0.84 (0.75) 89.17 (81.07) −30.00 (−27.27) Negative influence (extension)Δnetwork contribution
(negative influence) [€] (present value [€])
−20.00 (−18.18) 0.00 (0.00) 0.00 (0.00) 20.00 (18.18) CFnegative influencei;1 [€] (present value [€])
0.00 (0.00) 0.00 (0.00) 0.00 (0.00) 20.00 (18.18)
CFnegatively influencedi;1 [€] (present value [€])
20.00 (18.18) 0.00 (0.00) 0.00 (0.00) 0.00 (0.00)
Application of the customer lifetime network value At first, to apply the CLNV all input parameters had to be oper-ationalized based on the available data. To guarantee a reasonable and practicable application, we based our operationalization on both previous research and the discussions with the OSN’s oper-ators. When determining the parameters of the model for our application and for illustration purposes we used simplifying as-sumptions where possible to reduce the complexity and not to distract readers from the proposed model constituting the core of this work. Moreover, we focused on the basic model of the CLNV. On the one hand, due to the fact that the shop was just in its ramp up phase, attracting new customers by leveraging effects of direct and indirect positive social influence (e.g., recom-mendation of new products and offers to other users of the OSN) seemed particularly important. On the other hand, the granularity and accuracy of the results of the basic model met the require-ments of the OSN under consideration.
Determination of the time period t and the expected lifetime of the customer relationship T
We decided to use monthly time periods. Such sub-annual time periods are adequate for the fast-moving, dynamic environment of OSNs and enable a differentiated view on changes in user behavior. This is consistent with previous research (Kumar et al.2007). In addition, monthly time periods acknowledge the fact that the affiliated shop had just been launched and therefore marketing campaigns to promote the shop were required to be designed and implemented promptly. To determine the expected lifetimeTof customer relationships, previous research often uses hazard rate models forecasting the probability of defection or purchase (Helsen and Schmittlein 1993; Jain and Vilcassim 1991). Drawing on historic data, we were able to determine the lifetime of each customer relationship based on his/her historic transaction data.
Determination of the discount rate d
Discount rates strongly depend on the specific situation and the risks of a company. Therefore, we based our estimation on dis-cussions with the OSN’s operators and the affiliated shop. As a result, the monthly discount rate was set tod= 0.008. This is equivalent to an annual discount rate of 10% used by the OSN’s operators in similar contexts in the past. Furthermore, an annual
discount rate of 10% is consistent with previous research of customer valuation in the context of networks and marketing (Libai et al.2013; Weinberg and Berger2011).
Determination of the cash flows CFi,t
The concept of the CLV and also the CLNV are forward looking and require a prediction of future cash flows. For our demonstra-tion of the CLNV, we used historic transacdemonstra-tion data as proxy drawing on existing approaches. Analyzing the customers’ his-toric purchasing behavior, we determined the cash flows gener-ated by useriin periodt(CFi,t). While previous research has in fact found historic data on revenues and costs to be good predic-tors for future revenues and costs (Kumar et al.2010b), there are also studies raising the question whether historic behavior is a very accurate predictor for prospective behavior (Jain and Singh 2002; Malthouse and Blattberg2005). As in our paper we do not focus on developing a new method to predict customers’future revenues or costs but propose a generally new customer valua-tion model and demonstrate its applicability, we chose a simple backward looking perspective using historic data. For future re-search and application we suggest to include customer-level fac-tors when forecasting revenues and costs, for instance customer demographics, product usage variables (e.g., product categories), marketing activities, and costs of switching to other companies (Jain and Singh2002; Singh and Jain2013).
Determination of the share of cash flows tracing back to influence in the networkα
The parameterαrepresents the share of a customer’s cash flows which traces back to the influence of other people in the network. Where necessary, this parameter may also be determined on a customer and/or period specific basis.2Thereby, a parameter of α= 0 implies that a company assesses no share of cash flows to be induced by influence at all. For instance, companies assuming that customers purchase their products independently of each other not being exposed to social influence at all would choose a pa-rameter of 0. In that case, the results of the CLNV would coincide with the classic CLV. In contrast, a value forαclose to 1 implies that a company considers almost all of the generated cash flows to be induced by influence in the network. Thus, companies assum-ing that purchases primarily rely on social influence would choose such a high value for the parameterα. In practice, each company has to determine (e.g., based on analyses of historical data or
Table 3 Description of the
datasets (n= 60,029 users) Incidence Totals Respective users (% of all users) Mean per respective user
Messages (sent) 264,017 5,902 (9.8%) 44.73
Messages (received) 264,017 60,029 (100.0%) 4.40
Purchases 650 497 (0.8%) 1.31
expert estimations) what proportion of the cash flows is accredited to the influence of other users. In case of the OSN under investi-gation, we used–based on respective discussions with the oper-ators of the OSN– the valueα= 0.5 to reflect that the OSN assessed half of the cash flows generated by customers in the network to be induced by the influence of others. Unfortunately, due to the fact that the affiliated shop was just in its ramp up phase we could not draw on historical data to verify this choice by means of respective data analyses.
Determination of the strength of direct influence sti→j Literature widely agrees upon the fact that the impact of social influence in OSNs strongly depends on the strength of the con-nections among users, which can be determined by the number of social interactions such as messages (Cheung and Lee2010; Heidemann et al.2010; Hinz et al.2011; Kane et al.2014; Kiss and Bichler2008). In our application, in order to determine the strength of a useri’s direct influence on userj(sti→j), we fo-cused on the number of potentially purchase relevant private messages sent from userito userj. Conversely, the strength of influence other usersjhave on him/her was estimated using the number of potentially purchase relevant private messages s/he received (stj→i). Thereby, analyzing the chronology of pur-chases and messages on a daily basis, each message within a time frame of 10 days before a purchase in periodtwas con-sidered as potentially relevant for this purchase. For a better comparison of the influence of different time frames, the results for the time frames of 5 and 7 days can be found in the appendix (cf. Appendix2). We considered therefore the fast-moving na-ture of online interactions and focused on private messages as the primary means of communication within the OSN. Being aware that correlation does not imply causation, the fact that we indeed observed a positive correlation (p-value <0.01) between the number of messages and purchases may, however, also support our operationalization of the strength of influence to a certain extent. Since in case of our sports OSN no other relevant interactions besides private messages were observed, we con-sidered no other forms of interaction. However, when signifi-cant interactions beside private messages occur and may influ-ence customers’ purchase behavior in other contexts, these should be considered analogously. For public discussion fo-rums, for instance, the strength of influence can be determined based on the number of posts. Nonetheless, different forms of interactions have to be assessed regarding their influence poten-tial. For example, a post in a public discussion forum may reach various recipients; however, the strength of influence of such a public post on a single recipient may significantly differ from the strength of influence of a private message personally ad-dressing him/her. We also want to point out that regarding the quantification of the strength of influencesti→jbetween users there may be other relevant aspects beside the mere number of messages sent within a certain time frame like user
characteristics, personality, degree of connectivity, or the con-tent of the conversation (Kumar et al.2010a; Nitzan and Libai 2011; Wang et al.2014).
Calculation of the CLNV
Finally, we calculated the CLNV for each user. Analogous to prestige- and eigenvector-related centrality measures the CLNVs can be determined solving the respective system of equations containing one equation per customeriin the net-work (cf. Eq. (4)) via eigenvector analysis. To do so, we used the power iteration method (cf. e.g., Golub and van Loan 2012) in the software packageBNetworkX^for the explora-tion and analysis of networks and network algorithms (Hagberg et al. 2008).3The power iteration method can be used for calculating the eigenvector of sparse matrices and is known to converge fast (Lin and Cohen 2010). To ensure convergence of the power iteration method the iteration stops when the difference between the computed vectors is smaller than an error tolerance (error tolerance is defined as the num-ber of nodes in the graph ×1.0−15) or alternatively after a maximum of 100 iterations. This configuration of the algo-rithm turned out to be sufficient for an adequate approxima-tion. Using our software implementation, the CLNV was cal-culated for all 60,029 users. For the 1,978 users with a positive CLNV,4Table4provides an overview of the results consid-ering the CLNV as well as its main components. On average, the present value of individual cash flows ac-counts for 11.95€. Due to the design of our model, the two opposing components, CFinfluencei;t and CFinfluencedi;t , balance each other leading to an average present value of Δ network contribution of 0€. However, the present value of Δ network contribution varies substantially be-tween −86.98€ (−50% of the particular user’s present value of the generated cash flows) and 372.62€ (+500% of the particular user’s present value of the generated cash flows). Most of the divergence results from the variance of users influencing other users (CFinfluencei;t Þ. Taking all components together, the average CLNVi ac-counts for 11.95€, with a minimum of 0.01€ and a max-imum of 447.16€. Thus, as designed in the model, the average CLNV coincides with the average present value of individual cash flows, since the CLNV reallocates cash flows but does not change the overall present value of the network of 23,633.50€. 1,978 users have a posi-tive CLNV and therefore a posiposi-tive value for the affili-ated shop of the OSN. These are about 398% more users than the 497 customers that actually purchased products in the period under investigation.
3
Vgl.http://networkx.github.io/ 4
Findings of the application and novel user
segmentation
For the discussion of the findings of the application, we com-pare the CLNV with the classic CLV and study the impact of direct and indirect network effects. In addition, based on the results, we propose a novel user segmentation. Note that in the following we refer to the 1,978 users with a positive CLNV. Discussion of the findings of the customer lifetime network value
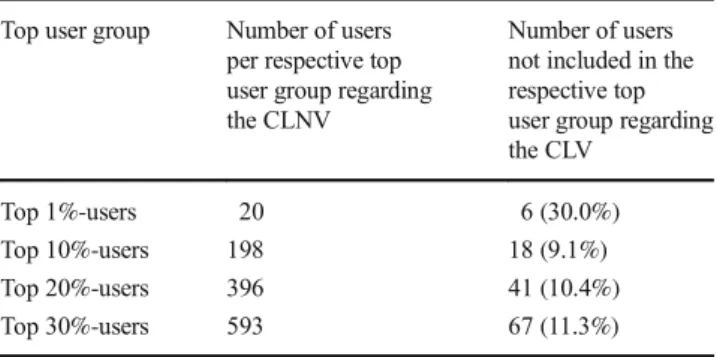
The findings of the application of the CLNV are analyzed in three ways. First, we compare the absolute values of the CLNV and the classic CLV. For both the overall sum is 23,633.50€. The CLNV, however, alters the allocation of val-ue among users compared to the classic CLV. In fact, we observe a significant difference (p-value <0.001) between the CLNV and the classic CLV. Further, we observe on the one hand that for about 77.7% (1,536) of the users the CLV accounts for less than the CLNV. Thus, the value of these users would be underestimated when ignoring network effects and the OSN might spend insufficient resources on them. Moreover, due to a lack of purchases about 96.4% (1,481) of these underestimated users would even be completely ig-nored in marketing campaigns based on the classic CLV al-though being valuable for the OSN as their influence induces cash flows of other customers. On the other hand, for about 6.5% (128) the classic CLV accounts for more than the CLNV. When ignoring network effects, the OSN would overestimate the value of these users and might therefore spend too many resources on them.
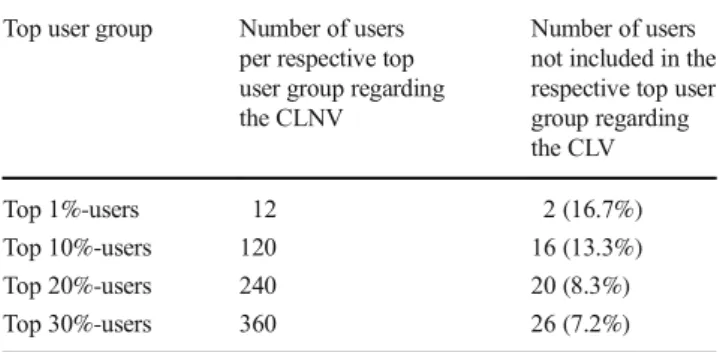
Second, we compare the relative importance of users and ranked all 1,978 users once based on the CLNV and once based on the classic CLV. Depending on these rankings, we identified the top users (top 1%-users, top 10%-users, top 20%-users, top 30%-users) for each approach. Table5 dis-plays the number of users per top user group according to the CLNV and the number of users who are not included in the respective top user group when considering the classic CLV. For example, 30.0% of the top 1%-users regarding the
CLNV are ranked in a lower top user group regarding the classic CLV. Some of them are not even within the top 20%-users regarding the classic CLV. Hence, parts of the highly valuable users according to the CLNV would be completely ignored and resources might be spent in a less efficient way when designing a top user marketing campaign based merely on the CLV. Taking a look at the top 20%-users regarding the CLNV, around 10.4% are not among the top 20%-users and around 17.1% are not even assigned to the top 30%-users regarding the CLV. In conse-quence, classic marketing campaigns might focus on the Bwrong^ users while neglecting more valuable ones. Third, we analyze the impact of direct and indirect network effects. Indeed, we observe a significant difference (p-value <0.001) between the CLNV including both direct and indirect network effects and the CLNV including only direct network effects (cf. Klier et al.2014). In fact, for about 81.2% (1,607) of the users the value differs when neglecting the indirect network effects. Thus, most of the users would be misvalued when solely considering direct network effects. In terms of numbers, this misvaluation indeed plays a central role: We observe a major difference between the sums of network ef-fects based on direct influence (2,820.65€) and both direct and indirect influence (5,425.59€). Hence, almost 48.0% of all induced cash flows can be traced back to indirect influence, illustrating the importance of considering indirect network effects in customer valuation.
Table 4 Results of the application (n= 1,978 Users)
Mean Minimum Maximum Standard deviation
Individual cash flowsCFi, 1[€] (present value [€] /CLVi) 13.15 (11.95) 0.00 (0.00) 418.65 (380.59) 33.21 (30.19)
Δnetwork contribution [€] (present value [€]) 0.00 (0.00) −95.68 (−86.98) 409.88 (372.62) 14.99 (13.63) CFinfluence
i;1 [€] (present value [€])
3.01 (2.74) 0.00 (0.00) 901.76 (819.78) 27,59 (25.08)
CFinfluencedi;1 [€] (present value [€])
3.01 (2.74) 0.00 (0.00) 491.88 (447.16) 16.26 (14.78)
CLNVi[€] 11.95 0.01 447.16 30.27
Table 5 Comparison of top user groups for the CLNV and the CLV (n= 1,978 users)
Top user group Number of users per respective top user group regarding the CLNV
Number of users not included in the respective top user group regarding the CLV
Top 1%-users 20 6 (30.0%)
Top 10%-users 198 18 (9.1%)
Top 20%-users 396 41 (10.4%)
Taken together, we argue that it is very important to include both direct and indirect network effects in cus-tomer valuation. Even with the rather exemplary dataset of the OSN’s affiliated shop during its ramp up phase, we observed significant differences between the CLNV and the CLV. Nevertheless, it has to be noted that on basis of the real-world example we can only demon-strate the practical applicability of our approach but do not prove that the CLNV really improves efficiency re-garding the way how marketing resources are spent in practice. However, we are confident that our proposed model may help to establish and maintain valuable cus-tomer relationships for example by focusing on the ac-tually important top user groups.
Novel user segmentation based on the CLNV
The operators of the OSN intended to use the CLNV to design targeted marketing campaigns and improve advertising for the affiliated shop. In order to support these efforts, we defined distinct CLNV-based user segments and derived selected mar-keting goals for each segment (Kumar et al.2007). However, it is important to note that the exemplary user segmentation presented here is only one potential use case of the application of the CLNV besides many others like enabling a value-oriented customer relationship management where theBtrue^ customer value is needed to support decision making (e.g., in the context of customer acquisition or customer retention).
Inspired by the CLNV as segmentation criteria we used the CLNV’s two main components (cf. summands in the formula in the subsection BBasic Idea^) present value of individual cash flows and present value of Δ network contribution (cf. Fig. 3).
The first criterion is subdivided into the two degreeshighand low, split by the arithmetic mean (11.95€) of thepresent value of individual cash flows. User segments that score high on the cri-terion present value of individual cash flows are named Champions and the ones scoring lowMisers(Kumar et al. 2007). The second criterion is subdivided into the three degrees positive,zero, andnegativewith respect to thepresent value ofΔ network contribution. Depending on the score of the second criterion, we refer to theChampionsasInfluencing Champions (i.e., users with a positive present value of Δ network contribution),Classic Champions(i.e., users with zeropresent value ofΔ network contribution), andInfluenced Champions (i.e., users with a negative present value of Δ network contribution). Analogously, we define the segments that score low on the first criterion asInfluencing Misers,Classic Misers, andInfluenced Misers. The size of the segments and their aver-age CLNV are presented in Fig.3. We can draw two main find-ings from the proposed user segmentation: First, the average CLNV varies substantially between the six segments, from 47.99€ (Influencing Champions) to 0.36€ (Classic Misers). Note that the low value of the latter, and of theMisersin general, can be explained by their average present value of individual cash flows being close to 0€. In contrast, the Influencing Championsboth influence other customers and at the same time make purchases, thus classifying as the most valuable segment. Second, the distribution of users across the six segments varies considerably. About 66.0% (1,305) of the users are classified as Influencingusers. Thereby, solely about 1.3% (25) of the users perform well on both criteria, thus are assigned to the segment of Influencing Champions. Most users, in fact almost 64.7% (1,280), are segmented asInfluencing Misers. Thus, they rarely make purchases, but mainly induce other users’cash flows. Note that regarding their CLV most of these users would be classified as invaluable and completely ignored in marketing campaigns. In
Fig. 3 CLNV-based user segments (n= 1,978 users)