D
OES AN
ED F
LOW
C
OORDINATOR
I
MPROVE
P
ATIENT
T
HROUGHPUT
?
Authors:Seamus O. Murphy, BSN, RN, CEN, CPEN, CTRN, CPHQ, NREMT-P, Bradley E. Barth, MD, FACEP, Elizabeth F. Carlton, MSN, RN, CCRN, CPHQ, Molly Gleason, BSN, RN, CEN,
and Chad M. Cannon, MD, FACEP, FAAEM, Kansas City, KS Introduction:At our urban academic medical center, efforts to
alleviate ED overcrowding have included the implementation of a
“fast track”area, increasing the ED size, using hallway beds, and
ambulance diversion. In October 2012, we began thefirst steps of a process that created a system in which the admission process involves equal amounts of pushing and pulling to achieve the balance necessary to accomplish optimal outcomes. The foundation of the initiative was based on the use of a BSN-educated emergency nurse as aflow coordinator; a position specifically empowered to affect patient throughput in the emergency department.
Methods: A determination of quality improvement was obtained by the local institutional review board for a retrospective analysis of all ED patient encounters 1 year before and 1 year after the implementation of the ED flow coordinator position. All patient encounters were included for consideration and calculation; no encounters were excluded.
Results: The flow coordinator program decreased length of stay by 87.6 minutes (P= .001) and lowered LWBS rate by
1.5% (P= .002). Monthly hospital diversion decreased from 93 hours to 43.3 hours (P= .008).
Discussion: Investing in a flow coordinator program can generate improvements to patient flow and can yield significantfinancial returns for the hospital. A decrease in diversion by an average of 49.8 hours per month translates to an annual decrease of nearly $20 million in lost potential charges. A decrease in the LWBS rate by 1.5% (31% relative decrease) per month translates to an annual decrease in lost potential charges of more than $5 million. Our research shows that an ED flow coordinator, when supported by departmental and hospital leadership, can yield significant results in a large academic medical center and that the program is able to produce an effective return on investment.
Key words: Throughput; Flow coordinator; LWBS; Length of stay; Diversion
T
he annual number of ED visits in the United States was 90.3 million in 1996,1 and that numberincreased to 129.8 million in 2010.2 The ED
volume has increased by an average of 3.54% per year. In that same period, the number of emergency departments nationwide decreased from 2446 to 1779, with an average of 89 closings per year. An analysis of the hospital emergency departments that closed showed that a low profit margin was one of the risk factors for closure.3
The Patient Protection and Affordable Care Act of 2010 includes the Hospital Consumer Assessment of Healthcare Providers and Systems among the measures to be used to calculate value-based incentive payments in the Hospital Value-Based Purchasing program that began with discharges in October 2012. Although the financial reimbursement component of the Hospital Consumer Assessment of Healthcare Providers and Systems does not currently apply to ED satisfaction, conventional wisdom suggests that patients who have a satisfying ED experience are more likely to have a satisfying inpatient experience than those whose hospitalization starts with a negative ED experience.
Seamus O. Murphy,Member, Kansas Emergency Nurses Association,is Research and Quality Outcomes Coordinator, Emergency Department, The University of Kansas Hospital, Kansas City, KS.
Bradley E. Barth is Assistant Professor, Emergency Medicine, The University of Kansas Hospital, Kansas City, KS.
Elizabeth F. Carlton is Director of Quality, Safety, & Regulatory Compliance, The University of Kansas Hospital, Kansas City, KS.
Molly Gleason,Member, Kansas Emergency Nurses Association,is Clinical Nurse II, Emergency Department, The University of Kansas Hospital, Kansas City, KS. Chad M. Cannon is Associate Professor, Emergency Medicine, The University of Kansas Hospital, Kansas City, KS.
The views expressed in this article are those of the authors and do not necessarily reflect the position or policy of any hospital or organization. For correspondence, write: Seamus O. Murphy, BSN, RN, CEN, CPEN, CTRN, CPHQ, NREMT-P, The University of Kansas Hospital, 3901 Rainbow Blvd, Mailstop 1019, Kansas City, KS 66160;
E-mail:smurphy3@kumc.edu.
J Emerg Nurs■. 0099-1767/$36.00
Copyright © 2014 Emergency Nurses Association. Published by Elsevier Inc. All rights reserved.
The Institute of Medicine has identified ED over-crowding, defined as when the volume of an emergency department exceeds the abilities of the resources in the department or hospital, as a national epidemic.4 Tradition-ally, when hospitals have encountered opportunities for improvement in their emergency department, they have sought solutions from within the department itself—an ED solution for an ED problem.
Our hospital, an academic medical center that serves as a quaternary and tertiary referral center, provides a breadth of specialized care for patients with complex and time-critical conditions. It is a designated Advanced Compre-hensive Stroke Center, accredited Adult and Pediatric Burn Center, Certified Chest Pain Center, and American College of Surgeons level I Trauma Center, has National Cancer Institute designation for cancer care, and offers the region’s largest bone marrow transplant and liver transplant program. The hospital, licensed for 751 beds, had an increase in inpatient discharges (28,331 to 30,669) and outpatient encounters (530,918 to 562,977) during fiscal year 2013.
The annual ED volume has increased at an average rate of 4.8% since the 22-bed emergency department was built in 2007. Infiscal year 2013, we experienced an 8% increase in annual volume, with an annual total of 50,620 patient encounters. Because of the symbiotic nature the emergency department has with other de-partments, and the complexity of the issue, this ED problem requires an interdisciplinary, interprofessional, and interdepartmental solution.
Since 2007, traditional efforts to improve ED overcrowding have included the implementation of a
“fast track” concept (in which lower-acuity patients with simple medical or social needs are seen in a separate area of the emergency department by a physician or nurse practitioner), increasing the number of treatment spaces in the emergency department by using hallway beds, increasing the physical size of the emergency department, and when all other measures to alleviate overcrowding fail, using ambulance diversion to temporarily stop or slow the flow of incoming ambulances.
Providing patients with an effective, efficient, and satisfactory ED experience truly requires a team effort and cannot be resolved by one department alone. Successfully identifying and removing barriers to success requires the resources of the entire hospital.
In October 2012, our urban academic medical center began thefirst steps of a process that would be the catalyst for an enterprise-wide approach to improving ED throughput by shifting responsibility beyond the walls of the department. Prior to this initiative, as is the case with most hospitals,
admitting patients from the emergency department involved pushing the patients through the process to secure an appropriate bed, obtaining service-specific admission orders, and securing transportation in a safe and efficient manner. The overarching goal required a paradigm shift to create a system in which patient admission was a morefluid process that involved equal amounts of pushing and pulling (as opposed to a purely ED push) to achieve the balance necessary to achieve optimal outcomes. The foundation of the initiative was based on the implementation of a dedicated frontline leader empowered to affect patient throughput specifically in the emergency department.
Increased frontline leadership was achieved through the transition of the traditional “charge nurse” to 2 expanded roles. An ED shift supervisor provided direct staff supervision and operational authority, and the ED flow coordinator focused solely on facilitating and improving patient movement both in and out of the department. The EDflow coordinator position was staffed by BSN-educated emergency nurses and was used between the hours of 9AM and 9:30PM.
To better understand the entire process, the flow coordinators frequently met with charge nurses and staff nurses on inpatient units to listen to their suggestions and ideas for improving flow and shadowed them several times per month. The flow coordinators attended staff meetings on other units to introduce the nurses and charge nurses to the change and began to attend the bed status meetings to ensure that the emergency department was represented and that the inpatient units were able to communicate directly regarding any ongoing barriers or concerns, and also so that opportunities for improvement are identified by the nurses who are in the position to champion those improvements and ensure that they are enacted. This process provided a level of mutual appreciation and respect on the part of both the flow coordinator and the inpatient nurse.
Historically, these meetings were referred to as “bed meetings” and focused on inpatient status and staffing. As part of the organizational paradigm shift, the focus of the meeting (including the name “bed meeting”) changed to encompass a broader view of hospitalwide patient movement. The integration of the EDflow coordinator into the daily throughput meetings provides insight to current patient census, scheduled operations, patient admissions through other points of entry such as outpatient clinics or direct admission transfers, and planned discharges. The ED flow coordinator is then better informed to direct the flow of patients safely and expeditiously from the emergency department. Participation in the throughput meeting has also helped to establish the ED flow coordinator as an
important member of a housewide team with the same goals and expectations as the inpatient frontline leaders. The day-to-day patientflow is a critical component to the initiative, but the ability to strengthen relationships, to be seen as a leader, and to provide input to change processes contributes to the success of the position and improved patient outcomes. As a part of the project, nursing leadership met with and received input from representatives of multiple patient care units, the EDflow coordinators, and members of the hospital quality team. The group examined the admission process, work flow, and events that occurred between arrival to the emergency department and arrival at the inpatient units. The result was the establishment of renewed and revised expectations regarding the standard-ization of patient handoffs and a change of expectation that shifted the responsibility for a smooth and timely patient admission from being an ED-owned task to a process that is shared by the entire hospital. The process encourages inpatient nursing units to “pull” patients as much as possible.
One other component of the program that likely led to its success was having the ED flow coordinator function as the facilitator for admissions through the emergency department. The coordinator would approach ED physicians when a patient’s length of stay (LOS) was exceeding expected times or when the decision to admit had been made but no inpatient orders had yet been written. These conversations would prompt communi-cation between inpatient teams and the ED team to speed up the admitting process or sometimes result in the ED physician placing temporary admission orders to allow for bed placement. The ED flow coordinator would also update the ED nurses regarding admission plans or delays in care and attempt to expedite any unusual delays. Because of this need by the ED flow coordinator to have the ability to keep the entire emergency department in mind, it was pivotal that the personnel whofilled the role be experienced ED nurses who had pre-existing relationships with the ED physi-cians, ED and inpatient nurses, and other departments and staff members.
In summary, the primary role of the ED flow coordinator is to serve as the liaison between the inpatient units and the emergency department. Patient flow can be effectively achieved when it is recognized and addressed as a systemwide process—something that is larger than any one department.9 The flow coordinators direct the movement of each patient through the admissions process. They manage new admissions and expedite admission orders and patient placement within the emergency department. They also attend daily throughput
meetings with frontline leaders throughout the hospital to plan patient movement.
Methods
STUDY DESIGN
A determination of quality improvement was obtained by the local institutional review board for a retrospective analysis of all ED patient encounters between October 1, 2011, and September 30, 2013. The dates were chosen because they marked 1 year before and 1 year after the implementation of the ED flow coordinator position. Although the coordinators did not assume their official duties in the emergency department until November, October marked the beginning of the hospitalwide movement toward change. All patient encounters were included for consideration and calculation; no charts or patient encounters were excluded.
STUDY PROCEDURES AND DATA ANALYSIS
The de-identified data from all patient encounters in the study period were reviewed for the following data elements: earliest documented time of arrival in the department, documented time of physical departure from the department, initial Emergency Severity Index (ESI) level, and time of patient disposition. Data regarding hospital diversion hours, ED diversion hours, and nurse satisfaction were collected from our hospital’s quality and safety department. Statistical significance was measured using 2-sided t tests, and the data were then analyzed with descriptive statistics (Microsoft Excel 2010, Micro-soft Corp, Redmond, WA).
We adapted the formula used by Falvo, Grove, Stachura, and Zurkin5 to calculate the lost charges
experienced as a result of ambulance diversion and patients who left without being seen (LWBS). This step allowed for a deeper financial measurement of the efficacy of the ED flow coordinator and an assessment of program’s overall fiscal impact.
Definition of Terms PATIENT ENCOUNTER
A patient encounter is defined as any point in time in which a person presented to the emergency department either seeking, or in need of, emergency care or treatment. All patients are included in this data element regardless of their disposition.
LEFT WITHOUT BEING SEEN
A patient is determined to have LWBS when, after presenting for a patient encounter, he or she leaves the premises prior to having received a medical screening examination by a physician or nurse practitioner. LWBS does not separate out the patients who left prior to triage; any patient who presented for service and left prior to receiving a medical screening examination by a physician or nurse practitioner are factored into this element.
ADMISSION RATE
The admission rate is determined by dividing the total number of hospital admissions (without regard for admission status or level of care) by the total number of patient encounters within a given period.
LENGTH OF STAY
Length of Stay (LOS) is measured in the average number of minutes between the patient’s first presentation to the emergency department and his or her physical departure from the emergency department regardless of disposition. DIVERSION
Diversion refers to the times in which the emergency department requests that all routine ambulance traffic choose an alternative destination. Diversion is divided into 2 categories based on cause: hospital diversion and ED diversion.
Hospital diversion may occur for a number of reasons, such as the hospital having more patients than beds (either physical or staffed) or having all operating rooms full. Because of the large number of factors that can affect whether hospital diversion is necessary, it is not considered to be within the control of the emergency department. Diversion hours in this category represent byproducts of hospital overcrowding, not necessarily ED overcrowding.
ED diversion is a component of hospital diversion but is considered separately because it occurs as a result of factors that are generally within the control of the department, such as when the department experiences a surge in patient quantity or acuity and is unable to safely accommodate any new patients. Diversion hours in this category represent ED overcrowding or overloading and are not necessarily indicative of hospital census or capacity. TIME OF DISPOSITION
The end of the patient encounter is marked by the time of disposition, which was measured by the latest documented
time that a patient was still present in the emergency department.
EMERGENCY SEVERITY INDEX
The ESI is one of several evidence-based systems used worldwide to triage ED patients. ESI is 5-level triage scale developed in the United States by an interprofessional team of nurses and other care providers. It is used to identify high-acuity patients who should be seen first and to categorize other patients do not require time-sensitive lifesaving interventions.6Patients assigned ESI levels 1 or 2 are considered high acuity and often require immediate or lifesaving interventions. Patients assigned ESI levels 3 through 5 are categorized on basis of the number of hospital resources that will be required to reach a disposition for the lower-acuity patients.7,8
Results
Table 1 shows the patient demographics for the 2 groups. The distributions of age, sex, and ethnicity were similar between both groups. During the study period, no statistically significant difference occurred in the rates of admission or in the mean ESI level between the 2 groups.
Table 2 demonstrates the effect of aflow coordinator at this urban academic medical center on decreasing the ED LOS by 87.6 minutes (P b .001) and lowering the LWBS rate by 1.5% (P= .002). A significant improvement was found in the percentage of hours spent on diversion each month. The monthly mean hospital diversion time decreased
TABLE 1 Demographics October 11– September 12 (N = 46,624) October 12– September 13 (N = 49,814) Age and sex
Age, mean (±SD) 32.4 (± 12.7) 34.3 (± 13.1) Female (%) 24757 (53.1) 26401 (53.5) Race and ethnicitya
White (%) 24921 (53.4) 26014 (52.2) African American (%) 12775 (27.4) 14209 (28.5) Hispanic (%) 7926 (17.4) 8468 (17) Other (%) 932 (2.4) 1026 (2.1) Declined (%) 70 (0.4) 97 (0.2)
from 93 hours (±41.5) or 12.7% of the month to 43.3 hours (±29.6) or 5.9% of the month (P= .008). A similar effect was noted for monthly mean ED diversion time, which decreased from 13.8 hours (±22.3), or 1.9% of the month, to 4.2 hours (±3.9), or 0.5% of the month.
To determine the satisfaction of the nursing staff, who were largely responsible for the conception and develop-ment of the program, results of an annual registered nurse satisfaction survey were reviewed, focusing on questions specific to the patient admissions process. One year prior to the institution of the flow coordinator program, the satisfaction score was 50%. In the year after implementation of the program, more than 73% of emergency nurses reported satisfaction with the process.
Discussion
This study shows the efficacy and effectiveness of having ED nurses act as flow coordinators to better expedite and facilitate the movement of patients through the department. Our results show that investing in a flow coordinator program can generate improvements to patientflow and can yield significantfinancial returns for the hospital.
The most significant difference in patientflow between the periods before and after implementation of the program was the ED LOS. Through the efforts of theflow coordinators, the emergency department was able to decrease the mean LOS nearly 90 minutes per visit. In an environment of care in which the most frequent patient complaints are about the time spent waiting for something to occur, decreasing that wait time by nearly an hour and a half is a significant achievement.
During the study period, the case mix index increased by 0.0305, indicating a more clinically complex patient population that required more health care resources. This finding is consistent with the change in mean ESI levels from 3.3 to 3.2, which is indicative of a patient population that has more complex needs.
One notablefinding was the increase of admission rates between the periods before and after implementation of the program, despite only a slight increase in patient acuity levels. This increase may be attributable to the increases in both volume and acuity in the year after implementation of the program.
Each month the hospital was able to decrease the amount of time spent diverting ambulance traffic to other facilities by more than 2 full days. In a setting in which approximately 20% of ED patients arrive by ambulance, every hour spent on diversion results in an
TABLE 2
Results of a hospital EDflow coordinator program
12 mo before EDFC (N = 46,624) 12 mo after EDFC (N = 49,814) ΔMean P
Encounters, monthly mean (±SD) 3885 (± 186) 4151 (±287) +266
ESI level, mean (±SD) 3.3 (± 0.5) 3.2 (±0.3) −0.1 .642
Admission, % (±SD) 22.9 (± 0.9) 24.6 (±1) +1.7 .001 Length of Stay Mean minutes (± SD) 274.3 (± 43.3) 186.7 (±41.8) −87.6 b.001a LWBS Mean No. (±SD) 186.7 (± 38.5) 135.6 (±45.6) −51.1 .002b Rate (± SD) 4.8% (± 0.9%) 3.3% (±1%) −1.5% Hospital diversion Mean hours (±SD) 93 (± 41.5) 43.3 (±29.6) −49.8 .008b Percent of month (±SD) 12.7 (± 5.8) 5.9 (±4.1) −6.8 ED diversion Mean hours (±SD) 13.8 (± 22.3) 4.2 (±3.9) −9.6 .174 Percent of month (±SD) 1.9 (± 3) 0.5 (±0.6) −1.3
EDFC, EDflow coordinator; ESI, Emergency Severity Index; LWBS, left without being seen; SD, standard deviation.
a Statistical significance at 0.01. b Statistical significance at 0.05.
average of 1.22 patients (ambulance arrivals per year/total hours per year not on diversion) being forced to seek treatment at a different emergency department. For a
tertiary and quaternary medical center that focuses on specialized care of patients with complex conditions, being forced to seek care elsewhere is a significant burden
FIGURE 1
Lost charges due to ambulance (EMS) diversion. Rounded dollar amounts are based on average amounts over a multiyear period.IP,Inpatient;OP,outpatient. Adapted from Falvo T, Grove L, Stachura R, Zirkin W. Thefinancial impact of ambulance diversions and patient elopements.Acad Emerg Med.2007;14:58–62.
because our patients may be seeking care not available at other facilities.
Theflow coordinator maintains open lines of commu-nication with charge nurses on the inpatient and observa-tion units, visiting them as needed and providing a consistent forum to identify and address potential areas for improvement. Granting bedside nurses the opportunity to improve the process by which patients are either admitted to, or transferred from, their units has resulted in a resounding increase in emergency nurse satisfaction with the admission process.
When patients are discharged more efficiently and those now-empty rooms are cleaned and prepared more quickly, the ED staff is able to move their patients out and begin treatment of the next potential admission. The advent of the EDflow
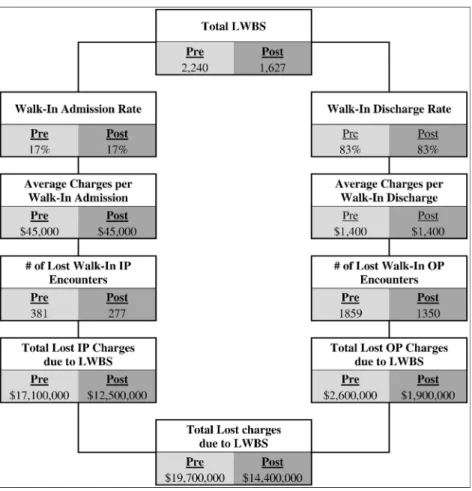
coordinator allows this process to be one of perpetual planning and anticipation; instead of waiting for the phone call that the room has been cleaned and is now ready for nurses to begin the safe patient handoff process, the flow coordinator is monitoring that process and keeping his or her nurses informed so a minimal amount of time is lost between events. Figure 1shows the total potential charges lost as a result of ambulance diversion. A decrease in diversion by an average of 49.8 hours per month translates to a decrease of over $23 million in annual lost potential charges.Figure 2 applies a similar formula to assess the total lost potential charges due to LWBS patients. A decrease in the LWBS rate by 1.5% (a 31% relative decrease) per month translates to an annual decrease in lost potential charges of more than $5 million.
FIGURE 2
Lost charges due to patients who left without being seen (LWBS). Rounded dollar amounts are based on average amounts over a multiyear period. IP, Inpatient; OP, outpatient. Adapted from Falvo T, Grove L, Stachura R, Zirkin W. The financial impact of ambulance diversions and patient elopements. Acad Emerg Med.2007;14:58–62.
The strength of the formula lies in its ability to display the maximum cost-saving potential of the system and its applicability to emergency departments of any size. By using the calculation method shown inFigures 1 and 2, personnel at any emergency department of any size can assess the potential cost-effectiveness of aflow coordinator program at their facility.
Limitations
The data collected were from only one large urban academic emergency department, which limits the external validity of the results. Although we recognize that all emergency departments need to develop new approaches to the meet the needs of patients in the face of a demand for treatment spaces that far exceeds the supply, our results may be more applicable to larger institutions than to smaller or nonacademic hospitals and health systems.
We do not know how these results would have differed if the only intervention was to hire 2 EDflow coordinators without providing interdepartmental and administrative support and establishing shared responsibility, but it is unlikely that the same levels of improvement would have been achieved. We also do not know how other care improvement, practice changes, or quality initiatives may have affected the results.
The limitation to the financial calculations is that the formula is based on averages and returns figures that represent the charges that can be billed. It represents only potential opportunities for charges and does not account for reimbursement rates, collection rates, or any of the other factors that may affect the hospital’s ability to collect payment for service.
The study did not explore other factors that may have contributed to the significant decreases largely because no other major systemic changes, interventions, or expansions (such as the opening of new patient care units, bed expansions, or significant changes to staffing matrices) occurred during the year after the flow coordinator program was initiated. One patient care unit changed locations and decreased in size from 23 to 18 beds, and a 6-bed medical-surgical ICU opened, leaving a +1 net change of available patient care beds.
Implications for Emergency Nurses
Theflow of patients in and out of the emergency department can be most effectively addressed and improved by treating it as a hospital-wide process instead of an ED problem. Every successful process improvement effort needs a champion9,10
who is able to not only drive the improvement effort but facilitate the culture change within the institution by leading others toward that improvement. The EDflow coordinator can serve as that champion and can be the catalyst for a hospital-wide culture change through which patient flow becomes embraced as a hospital-wide improvement oppor-tunity instead of an ED problem.
Conclusion
Our research shows that an ED flow coordinator, when supported by departmental and hospital leadership, can yield significant results in a large academic medical center and that the program is able to produce an effective return on investment.
REFERENCES
1. Pitts SR, Niska RW, Xu J, Burt C. National Hospital Ambulatory Medical Care Survey: 2006 emergency department summary. DHHS publication 2008–1250. Available at: http://www.cdc.gov/nchs/data/nhsr/nhsr007. pdf. Published August 6, 2008. Accessed March 31, 2014.
2. Centers for Disease Control, Prevention. National Hospital Ambulatory Medical Care Survey: 2010 emergency department summary tables. Available at: http://www.cdc.gov/nchs/data/ahcd/nhamcs_emergency/ 2010_ed_web_tables.pdf. Accessed March 31, 2014.
3. Hsia RY, Kellerman AL, Shen YC. Factors associated with closures of emergency departments in the United States.JAMA.2011;305(19): 1978-85.
4. Institute of Medicine. Hospital-based emergency care: at the breaking point. Available at: http://www.iom.edu/Reports/2006/Hospital-Based-Emergency-Care-At-the-Breaking-Point.aspx. Published June 13, 2006. Accessed March 31, 2014.
5. Falvo T, Grove L, Stachura R, Zirkin W. Thefinancial impact of ambulance diversions and patient elopements.Acad Emerg Med.2007;14:58-62. 6. Tanabe P, Gimbel R, Yarnold PR, Adams JG. The emergency severity
index 5-level triage system scores predict ED resources consumption. J Emerg Nurs.2004;30(1):22-9.
7. The Joint Commission. Implementation guide for the NQF endorsed Nursing-Sensitive Care Measure Set. Available at: http://www. jointcommission.org/assets/1/6/NSC%20Manual.pdf. Published December 2009. Accessed March 31, 2014.
8. Gilboy N, Tanabe T, Travers D, Rosenau AM. Emergency Severity Index (ESI): A Triage Tool for Emergency Department Care, Version 4: Implementation Handbook. AHRQ publication 12–0014. 2012 ed. Rockville, MD; 2011.
9. Pelletier LR, Beaudin CL. Q Solutions: Quality and Performance Improvement. 3rd ed. National Association for Healthcare Quality; 2012. 10. Barrett L, Ford S, Ward-Smith P. A bed management strategy for overcrowding in the emergency department. Nurs Econ. 2012;30 (2):82-5, 116.