Industry Valuation Driven Earnings Management
Tao Jiao, Gerard Mertens and Peter Roosenboom
ERIMREPORT SERIES RESEARCH IN MANAGEMENT
ERIM Report Series reference number ERS-2007-069-F&A
Publication October 2007
Number of pages 40
Persistent paper URL
Email address corresponding author [email protected]
Address Erasmus Research Institute of Management (ERIM)
RSM Erasmus University / Erasmus School of Economics Erasmus Universiteit Rotterdam
P.O.Box 1738
3000 DR Rotterdam, The Netherlands Phone: + 31 10 408 1182 Fax: + 31 10 408 9640 Email: [email protected] Internet: www.erim.eur.nl
Bibliographic data and classifications of all the ERIM reports are also available on the ERIM website: www.erim.eur.nl
ERASMUS RESEARCH INSTITUTE OF MANAGEMENT
REPORT SERIES
RESEARCH IN MANAGEMENT
A
BSTRACT ANDK
EYWORDSAbstract This paper investigates whether industry valuation impacts firms’ earnings management decisions. Existing accounting literature assumes that industry valuation has a constant impact on this decision. We argue that a higher industry valuation increases the perceived benefits of earnings management at a time when the negative consequences associated with accrual reversal and the probability of detection are believed to be lower. Using a sample of quarterly data of U.S. firms from 1985 to 2005, we find that the four-quarter lagged industry valuation has a positive relationship with industry aggregate (current) discretionary accruals. More specific, one standard deviation increase in the aggregate industry valuation is associated with a significant increase of 2.4 cents in quarterly earnings per share. Our results are robust after controlling for several factors, including bubble years, size, leverage and performance.
Free Keywords Industry valuation, Earnings management, Market to book ratio Availability The ERIM Report Series is distributed through the following platforms:
Academic Repository at Erasmus University (DEAR), DEAR ERIM Series Portal
Social Science Research Network (SSRN), SSRN ERIM Series Webpage
Research Papers in Economics (REPEC), REPEC ERIM Series Webpage
Classifications The electronic versions of the papers in the ERIM report Series contain bibliographic metadata by the following classification systems:
Library of Congress Classification, (LCC) LCC Webpage
Journal of Economic Literature, (JEL), JEL Webpage
ACM Computing Classification System CCS Webpage
Industry Valuation Driven Earnings Management
*Tao Jiao†
Gerard Mertens Peter Roosenboom
Department of Financial Management RSM, Erasmus University Rotterdam, the Netherlands
Contact
RSM, Erasmus University, Rotterdam Room T8-47 Burg Oudlaan, 50 Rotteram, 3062 PA the Netherlands Phone: +31 (0)10 4082546 Fax: +31 (0) 4089017 Email: [email protected]
* The authors thank Ingolf Dittmann, Abe de Jong, Douglas DeJong, Jeroen Suijs, Mathijs van
Dijk, Marcel van Rinsum, the seminar participants at Erasmus University, and the participants in 30th European Accounting Association Conference for their helpful comments.
Industry Valuation Driven Earnings Management
Abstract
This paper investigates whether industry valuation impacts firms’ earnings management decisions. Existing accounting literature assumes that industry valuation has a constant impact on this decision. We argue that a higher industry valuation increases the perceived benefits of earnings management at a time when the negative consequences associated with accrual reversal and the probability of detection are believed to be lower. Using a sample of quarterly data of U.S. firms from 1985 to 2005, we find that the four-quarter lagged industry valuation has a positive relationship with industry aggregate (current) discretionary accruals. More specific, one standard deviation increase in the aggregate industry valuation is associated with a significant increase of 2.4 cents in quarterly earnings per share. Our results are robust after controlling for several factors, including bubble years, size, leverage and performance.
1. Introduction
The current earnings management literature has examined earnings management from either a transaction-specific or a firm-specific point of view. In their review of earnings management literature, Healy and Wahlen (1999) mention that firms manage their earnings when they are at the time to raise capital, such as initial public offerings (IPOs) or seasoned equity offers (SEOs), or when they need to meet analyst expectations or bonus plan targets related to executive compensation schemes. However, these studies disregard the fact that market conditions, like economic growth and industry valuation, are not constant over time. Focusing on the latter, we hypothesize that industry valuation will influence managers’ decision to engage in earnings management. This can provide an explanation why earnings management occurs more frequent in some periods than in others. Our study contributes to two streams of literature.
First, we contribute to literature by providing evidence of industry effects on firms’ earnings management decisions. Firms in the same industry face similar market conditions and (growth) prospects. Prior studies provide evidence that these industry prospects affect firms’ financial decisions. Harford (2005) finds that merger waves occur in response to specific industry shocks that require large scale reallocation of assets. Mackay and Phillips (2005) find that industry and group factors are important to firms’ capital structure decisions. Given the
importance of such industry effects, we investigate the impact of industry valuation on earnings management and aim to provide more empirical evidence on how industry effects can affect firms’ decision making.
Second, our study provides new evidence on the relationship between stock market valuation and earnings management. Prior studies examine the association between valuation and earnings management. Jensen (2004) argues that over-valued firms have incentives to sustain their overvaluation. Kothari et al. (2006) empirically test Jensen (2004)’s argument and find evidence that the discretionary accruals of over-valued firms are much higher than firms with lower valuations. However, different from Kothari et al. (2006), we argue that the level of industry valuation can influence the earnings management decision of all firms in that industry, not only over valued ones. This is because the level of industry valuation can change the benefits and costs to manage earnings for all firms in that industry. Our study shows how different cycles of booms and bursts in any industry changes managers’ incentives to manage earnings. Rajgopal et al. (2007) focus on macro economic incentives that drive earnings management incentives, using macro economic variables (like GDP), that proxy for investor optimism in good times. Because economic cycles vary in time across industry, we argue that industry level provides a more accurate level of analysis to examine the impact of market conditions, i.e. the valuation levels of stocks on earnings management.
In this study, we employ a large sample of U.S. firms taken from COMPUSTAT. The sample period covers 20 years from 1985 to 2005. We test our hypothesis by examining the association between industry valuation and four-quarter ahead aggregate current discretionary accruals of individual firms in the industry. Following the behavioral finance literature (Baker et al., 2004), we use market to book ratio to proxy for the level of valuation. First, we find that after including the usual explanatory factors for earnings management, such as leverage, size, and performance, our measure for industry aggregate earnings management of each quarter remains is significantly positively associated with the lagged industry market to book ratio. This result holds for both current discretionary accruals and total discretionary accruals. In economic terms, this implies that one standard deviation increase in the industry valuation is associated with a significant increase of 2.4 cents in quarterly earnings per share. Second, to exclude alternative explanations, we run several robustness analyses, such as excluding high tech firms and excluding observations during bubble years. We continue to find a significantly positive association between aggregate current discretionary accruals and the industry market-to-book ratio.
The paper is organized as follows. In Section II we discuss related literature and develop our hypotheses. In Section III we describe our data and construct variables. In Section IV we present our main results, and analyze their robustness. In Section V, we discuss our findings.
2. Previous Literature and Hypotheses Development
Firms make earnings management decisions after balancing the benefits and the costs associated with this decision. The underlying economic rationale for earnings management is that benefits outweigh the costs. Inversely, earnings management motives decrease if costs outweigh the benefits. Before analyzing the effects of industry valuation on earnings management, we start with a discussion of the benefits and costs related to earnings management.
Benefits of Earnings Management
Since Ball and Brown (1968), numerous studies document a positive association between earnings surprises and stock returns. This offers managers the possibility to use earnings management in an attempt to influence stock price. Prior studies find evidence that support this argument. First, in their survey, Graham et al. (2005) report that CFOs’ main motivation to engage in earnings management is to influence the firm’s stock price. Second, managers’ personal wealth is closely linked with stock price because of equity based compensation and human capital (Murphy, 1999). Third, stock price will decline in reaction to firms missing their analyst forecasts (Skinner and Sloan, 2002).
Although incentives to influence stock price by earnings management always exist, we argue that the extent to which stock prices react to earnings is positively
associated with the industry valuation. Veronesi (1999) investigates the effects of market fundamentals on investors’ response to firms’ earnings announcements. His analytical model demonstrates that investors will overreact to bad news when the market is performing well, but under react to good news when the stock market is performing poorly. This argument can also be applied to an industry level. It implies that there is more severe punishment of releasing disappointing earnings when the industry is expected to perform well than when it is expected to perform poorly. However the benefits of meeting earning expectations are higher in good times than in bad times. Therefore, earnings management has more appeal to managers when the industry valuation is higher. This argument is consistent with Dyck and Zingales (2002, p.85) who argue that “during a downturn, the valuation of a stock depends more on its liquidation value than on its future growth, making it less sensitive to news.” In sum, we argue that the benefits of earnings management are higher when the industry has a higher valuation. Rational managers would time earnings management according to the level of the industry valuation.
Costs of Earnings Management
Marquardt and Wiedman (2004) argue that accruals reversal is one of the important costs associated with earnings management. It impacts the future earnings and thus constraints the future reporting flexibility of firms. For example,
an early recognition of income can potentially increase earnings in the current period. However this early recognition decreases the growth of future earnings, and limits the room of earnings management in the future. In the following part, we will discuss the influence of industry valuation on the costs associated with accrual reversal when firms engage into earnings management.
Accruals Reversal
Accrual reversal is one of the most important costs associated with earnings management (Marquardt and Wiedman, 2004). The decrease in future earnings as a result of accrual reversal is not only associated with negative stock price reactions (e.g. Teoh et al., 1998a and 1998b), it also constrains the flexibility of future earnings. However, we argue that the costs of accrual reversal is positively associated with industry valuation, i.e. the costs decrease in case of higher or increasing industry valuation and increase if industry valuation is lower or decreasing. Assuming that stock markets can predict future economic performance (Fischer and Merton, 1985, Lee, 1992), we propose the following relationship. When the average stock price of firms in an industry increases, managers of in that industry are more likely to have an optimistic outlook of the economic prospects and expect increasing future cash flows. As a consequence, they are more likely to believe that earnings management brings less constraint on future reporting flexibility, because the reversal of accruals will be covered, at
least partially, by increasing cash flows. In this case, the negative influence from accrual reversal will be mitigated. In the case of lower or decreasing average industry stock prices, the problem with reporting flexibility will be more severe if managers engage in earnings management. Large amount of accruals applied in the current period will bring much more difficulty in avoiding the negative consequences of an accrual reversal (i.e. a decrease of future earnings), since cash flow will decrease during an economic downturn or recession. Therefore, we conclude that the costs with reporting flexibility change with industry valuation. High industry valuation offers more reporting flexibility to managers.
The Probability of Detecting Earnings Management
One obvious challenge to our argument on accrual reversal might be that the participants of stock market can see through the components of earnings and thus detect accounting discretion. However, prior studies find that the probability of detecting earnings management by outsiders is not high (Sloan, 1996). In line with this, our claim is that it is lower when industry valuation is higher.
First, it is less likely for investors to detect earnings management. Investors, especially individual investors, lack the ability to distinguish cash flow and accruals. Sloan (1996) examines the information content of both accruals and cash flow. He finds that investors react to earnings rather than either of its components. This result provides an indication that it is difficult for investors to see through
earnings and identify the source of earnings changes. Managers can use this to inflate or deflate accruals depending on the stock market valuation levels. Graham et al. (2005) show that CFOs believe that for investors, earnings are a more important metric than cash flows. Hence, we argue that the industry valuation can mislead investors and influence their sentiment. A high industry valuation predicts growing future cash flow and thus leads investors to be (more) optimistic about the firms’ performance. In this case, it is easier for management to engage in earnings management, because scrutiny of investors is lower under these circumstances. Conversely, a low industry valuation increases investor skepticism and make them more suspect of firms’ performance.
Second, several studies find that the probability for journalists to see through firms’ discretion is low when an industry performs well. The financial press plays a key role in communicating information about corporate performance between firms and investors. Dyck and Zingales (2002) argue that journalists are less motivated to discover negative news when stock market valuation is high because (1) firms have more intention to release good news and are very selective to journalists during stock market booms; (2) in exchange for the access to information from firms, journalists have incentive to report more positive news. This result is also consistent with that of Solt and Statman (1988). They find that news writer’s sentiment in the current period is positively related to the stock market return in the prior period. Given these findings, we argue that the industry
valuation impacts effectiveness of media in communicating information and monitoring firms. It is less likely for them to alert investors about bad information, such as earnings management, during periods of high industry valuation. Hence, we propose that the probability of detecting earnings management by investors is lower, especially when stock market valuation is high.
Combining the above arguments about the influence of the industry valuation on the costs and the benefits of earnings management, as well as the likelihood of earnings management being detected, we predict that the incentives to engage in earnings management vary across time and are associated with aggregate levels of industry valuations: earnings management is expected to occur more frequently when industry valuation is high. Therefore, our main hypothesis is that industry valuation has a positive impact on the degree of earnings management in that industry.
3. Data and Variables Sample Selection
To construct our sample, we start with quarterly financial data of all COMPUSTAT firms appearing between 1950 and 2005. To control the effects of equity offers on earnings management, we also retrieve the data of IPOs and seasoned equity offers from SDC, which covers the period between 1970 and 2005. After merging these two samples, our initial sample contains data covering
a period from 1970 to 2005. Next, we screen our initial sample by deleting 4858 financial companies (SIC code starting with 6). Third, we delete the observations which do not have enough data to estimate discretionary accruals using the cross sectional modified Jones model. Fourth, we drop observations if there are less than 10 observations to estimate the coefficients of total accruals. Fifth, we exclude observations which have either missing market values and missing or negative book values, or missing control variables. Finally, we delete the outliers by excluding the bottom and top 1% of every variable. From the first to the final step, we obtain 164320 observations containing 9065 companies from the third quarter of 1985 to the fourth quarter of 2004. The steps of sample screening are shown in Table 1.
---Please insert Table 1 here--- Earnings Management Variables
We use current discretionary accruals as the proxy for earnings management, because current discretionary accruals are ‘the component most easily subject to successful managerial manipulation (Teoh et al., 1998, page 195). Prior audit quality research also argues that firms have most of their discretion over current accruals (Becker et al., 1998). In addition, the main difference between discretionary accruals and current discretionary accruals is the accruals associated with depreciation. Manzon (1992) and Hunt et al. (1996) find little evidence that
firms manage depreciation to meet short term earnings targets. Since our analysis focuses on the quarterly earnings management decisions, the quarterly frequency will be too short to use depreciation account for earnings management. Therefore, we expect that when firms face pressure from aggregate stock market valuation, they probably first choose to manage accounts such as tax and current liabilities rather than depreciation. Current discretionary accruals will thus be a more proper measurement for the degree of earnings management in this study.
We compute the quarterly current discretionary accruals based on the method of discretionary accruals in Matsumoto (2002). The total current accruals (TCAijtq)
of firm i in two-digit SIC code j in quarter q of year t are computed as follows (Equation 1):
) (
)
( ijtq ijtq ijtq ijtq
ijtq CA Cash CL STDebt
TCA = ∆ −∆ − ∆ −∆ (1)
Where ∆CAijtq = change in current assets (Compustat item # 40) ijtq
Cash
∆ = change in cash and cash equivalent (Compustat item # 36) ∆CLijtq = change in current liabilities (Compustat item # 49)
∆STDebtijtq = change in debt included in current liabilities (Compustat item # 45)
Furthermore, we use a second model to estimate current discretionary accruals (DCAijtq) and current nondiscretionary accruals (NDCAijtq). This model is similar
growth of long term assets since we are measuring the current part of discretionary accruals. In addition, we add a dummy for the fourth quarter of every year because it is well established that the accruals in the fourth quarter are different (Matsumoto, 2002). jt jt ijtq ijtq ijtq jt ijtq jt ijtq ijtq Qtr A AR REV A A TCA ε β β α + ∆ −∆ + + = − − − 4 1 2 1 1 1 1 (2) Where ∆REVijtq = change in revenue (Compustat item # 2)
∆ARijtq = change in account receivable (Compustat item # 37) 4
Qtr = the fourth quarter dummy
Aijtq−1 = lagged total assets (Compustat item # 44)
We estimate Equation 2 for each firm-year using all firm quarters in that year in the same industry (two-digit SIC code). To get sufficient data for parameter estimations, those firm years with less than ten observations are excluded. After estimating the parameters in Equation 2, we apply them into the same model and then get the estimation of NDCAijtq. The difference between TCAijtqand NDCAijtq
is the estimation of current discretionary accruals (DCAijtq) (Equation 3).
ijtq ijtq
ijtq TCA NDCA
DCA = − (3)
Industry current discretionary accruals are measured as the lag asset weighted average of discretionary accruals of all firms in an industry. Equation 4 presents the way to calculate industry current discretionary accruals.
− − × = i ijtq i ijtq ijtq jtq A A DCA DCA 1 1 (4)
Where DCAjtq = industry current discretionary accruals
Stock Valuation Variable
In their review of behavioral corporate finance, Baker et al. (2004) suggest that market-to-book ratio is the most often used proxy for stock valuation. Following the main stream studies, we also use this as our proxy for stock valuation.
We adopt the definition of market-to-book ratio by Kaplan and Zingales (1997) and Gompers et al. (2003). According to this definition, the market value of a firm is calculated as the book value of assets (Compustat item #44) plus the market value of common stocks, less the sum of book value of common equity (Compustat item #59) and balance sheet deferred taxes (Compustat item #79). The market value of common stocks is the product of outstanding shares (Compustat item #61) and the stock price at the end of fiscal quarter (Compustat item #14). The book value of assets is defined as total assets (Compustat item #44). Market to book ratio is a ratio of market value of a firm to the book value of assets of that firm.
The industry market-to-book ratio (MBjtq) is used as our proxy for stock market
capitalization of all stocks in quarter q of year t in industry j to the sum of the book value of these stocks in the same period and same industry.
= i ijtq i ijtq jtq B M MB (5)
Where Mijtq = the market value of firm i in quarter q of year t in
industry j
Bijtq = the book value of firm i in quarter q of year t in industry j
MBjtq = the industry market-to-book ratio
Control Variables
Because prior studies on earnings management have identified several factors that affect the degree of earnings management (e.g., Dechow et al. 1996; Bowen et al., 2004), it is important to control for these variables in our study as well.
Firm valuation (VALijtq-4): several studies (e.g. Degeorge et al., 1999,
Burgstahler and Eames, 1998) argue that firms manage their earnings to meet the stock market expectation and hence to sustain or increase their stock price. Jensen (2005) argues that overvalued equities count on their earnings to keep up the already high valuation. Kothari et al. (2006) find empirical evidence showing Jensen’s overvaluation theory is consistent with empirical findings of return behavior, analyst optimism and insider trading. However, Hirshleifer et al. (2004) find that undervalued equities also have incentive to manipulate earnings upwards
in order to show a performance comparable to industry peers. Therefore the impact of the firm’s stock market valuation on earnings management could be either positive or negative. We employ a market to book ratio at individual firm level to proxy for the stock market valuation at the firm level.
Demand from external financing (FreeCijtq-4): An ex-ante measure of the
demand for external financing (FreeCijtq-4) is developed by Dechow et al. (1996)
as in Equation 6. They argue that the demand for external finance depends not only on how much cash is generated from operating and investment activities, but also on the ‘stock’ of funds already available within the firm. Since current assets are convertible to cash, they represent the firm’s ‘stock’ of funds. When firms have fewer ‘stock’ of funds, there is a higher demand for external financing, hence, more incentives to manage earnings. We calculate the absolute value of the ratio of current asset to cash from operations except average capital expenditure. The inverse of this ratio indicates the number of years during which firms can fund their operations and investments by internal funds. Following Dechow et al. (1996), we use this variable as an indicator variable. It is coded as 1 if the FreeCijtq is less than -0.5 and 0 otherwise. The expected relationship between earnings management and FreeCijtq-4 is positive.
1 ) 4 ( 1 ) 4 ( 3 ) 4 ( 4 4 − − − − − − − − − = ijtq ijtq TO ijtq ijtq ijtq ets CurrentAss itures italExpend AverageCap erations CashFromOp FreeC (6)
Leverage (LEVijtq-4): Prior studies (such as Bowen et al. 1981, Dechow et al.
1996) use leverage to measure the debt covenant motivation for earnings management. Assuming that firms with more leverage are closer to debt covenant violation, these firms are more inclined to engage in earnings management. We use leverage to measure the closeness of firms to their potential debt covenant violation. Leverage is defined as total long term debt (Compustat item #51) scaled by total total assets (Compustat item #44).
Size (SIZEijtq-4): Several studies find that larger firms have more potential for
earnings management. Bartov (1993) argues that larger firms have more room for earnings manipulation through asset sales. Watts and Zimmerman (1990) argue that larger firms face higher political costs and hence have stronger incentives to manage earnings in order to reduce the potential political risk. Francis et al. (1996) have similar results for asset write-offs. So, the expected sign of the influence from size on earnings management is not clear from the literature. We use the natural logarithm of sales (Compustat Item #2) as the proxy of firm size. The sign of the relationship between discretionary accruals and firms size is not predicted.
Performance (ROAijtq-4): Dechow et al. (1995, p. 193) show that accruals are
correlated with not only the current performance but also with the past performance. However the (modified) Jones model only control for the current performance. Kothari et al. (2005) show that the models to estimate discretionary accruals are often mis-specified if the firms’ performance is not controlled for.
Bowen et al. (2004) include ROA as a control variable when analyzing the relationship between earnings management and corporate governance variables. We use return on assets (ROAijtq) to proxy for firms’ performance and use ROAijtq
as a control variable, where ROAijtq is defined as income before extraordinary
items (Compustat Item #8) scaled by lagged total assets (Compustat Item #44).
Equity Issue (IPOijtq+m, SEOijtq+m): Several studies (e.g., Friedlan, 1994, Teoh et
al. 1998) find that firms manage earnings upward before going public to attract investors. Similar income increasing earnings management is also found before seasoned equity offerings (Teoh et al. 1998b, Shivakumar, 2000). Lamont and Stein (2006) find that the scale and numbers of financial activities of firms are positively associated with the aggregate stock market valuation. Therefore, our study faces the challenge that results might partially driven by equity offerings. To control for this alternative explanation, dummies for both IPOs (IPOijtq+m) and
seasoned equity offers (SEOijtq+m) will be introduced into the analysis. IPOijtq+m
and SEOijtq+m stand for the IPO dummies and SEO dummies of company i in the
quarter q+m of year t in the industry j, where m varies from -4 to 4. These dummies are equal to one if in the four quarters before (m=[-4,0]) and after the quarter (m=(0, 4]) either IPOs or seasoned equity offers are implemented.
Industry and Quarter dummies(Din, Dqtr): to control for other unobservable
factors that might influence firms’ earnings management decisions we introduce industry (two-digit SIC code) and quarter dummies.
Descriptive Statistics
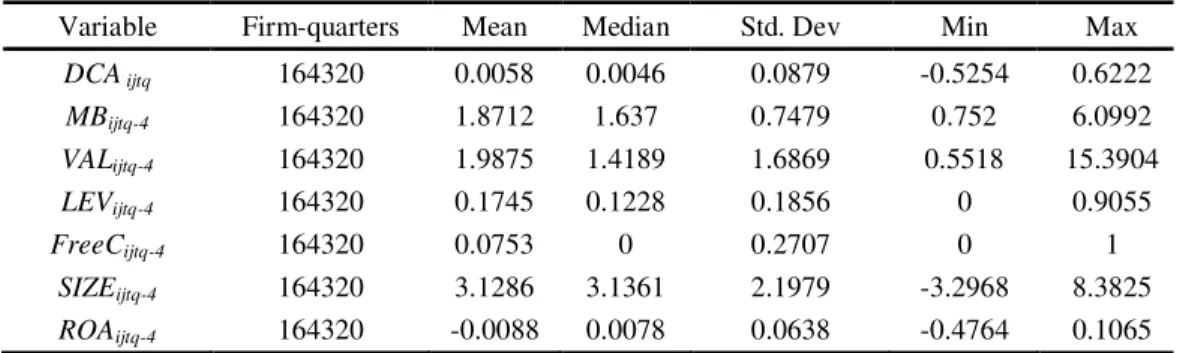
Descriptive statistics of the final sample appear in Table 2. To avoid that our results are influenced by outliers, we trim each variable at the first and 99th percentile. The mean of current discretionary accruals is 0.58%, and its median is 0.46%. The individual market-to-book ratio has a mean of 1.9875 and a median of 1.4189. The mean of the industry market to book ratio is 1.8712, and the median is 1.637. Comparing the mean of other control variables with those reported in Bowen et al. (2004), it appears that our sample has firms with a larger degree of earnings management, higher leverage and smaller size. This result is not surprising since they only include firms in the S&P 500, S&P 400 mid cap and S&P 600 small cap. The correlation matrix is reported in Table 3. Consistent with prior studies, total discretionary accruals have a positive relationship with free cash flows, firm size, and firm performance.
---Please insert Table 2 and Table 3 here---
4. Empirical Tests and Results
In this section, we present the results of our empirical tests. To distinguish the effect of industry valuation from that of the factors documented by prior studies, we develop a two stage analysis. In the first stage, we explain earnings management by regressing it on the control variables including leverage, size,
performance, demand for external funds, equity issue dummies, time dummies and industry dummies. Control variables excluding dummy variables (equity issue dummies, time dummies and industry dummies) have a one-year lag behind the period of earnings management. As a result of this, the error terms from the first step regression contain the component of earnings management not explained by the variables in the first stage regression. We then aggregate the error terms for each industry quarter. The aggregation is a proxy for the unexplained part of earnings management at industry level and thus the dependent variable in our second stage regression. In the second stage, we use a univariate regression to examine the association between unexplained earnings management in industry quarters and the four-quarter lagged industry market to book ratio. The coefficient estimated from this regression provides us with an estimate of the effect of industry valuation on the degree of earnings management in that industry. In comparison with a single stage analysis approach, the advantage of a two stage analysis is to avoid collinearity problems between the industry market to book ratio and the quarter dummies.
Equation 7 (see below) is the model we used in the first step of the regression with current discretionary accruals as the dependent variable. Panel A of Table 4 shows the results of this model. The coefficients of firm valuation, demand of external finance, and performance are consistent with prior studies. The signs of these coefficients are positive, while all are significant at 0.0001 level. Also the
coefficient of firm size is positive and significant at 0.1 level. This result is consistent with the idea that larger firms have more resources to manage earnings. We do not report the coefficients of quarter and industry dummies for reasons of brevity. The overall R square of Model 7 is 1.40%, suggesting that much of the variation in discretionary accruals remains unexplained. However, we should bear in mind that this low R square is not surprising because our sample is not constructed conditional on special events, like for example in the case of equity offerings. Moreover, prior studies on earnings management, such as Kasznik (1999) and Xie et al. (2002), report similar levels of explanatory power in their models. ijtq in qtr m n m n n ijtq m m n m n n ijtq m ijtq ijtq ijtq ijtq ijtq ijtq D D SEO IPO ROA SIZE FreeC LEV VAL DCA ε α α α α α α α α + + + + + + + + + + = = = − = = + = = − = = + − − − − − 4 , 23 4 , 15 4 , 14 4 , 6 4 5 4 4 4 3 4 2 4 1 0 (7)
Where DCAijtq = Current discretionary accruals estimated by modified
Jones model
VALijtq-4 = Market to book ratio of individual firms
LEVijtq-4 = Leverage, the ratio of long term debt to total assets
FreeCijtq-4 = Demand for external fund
SIZEijtq-4 = Firm size measured as ln(sales)
IPOijtq+m = IPO dummies
SEOijtq+m = Seasoned equity offer dummies
Dqtr = Quarter Dummies Din = Industry dummies
After the first stage analysis we aggregate the error term of each industry by quarter and regress the aggregated error terms on the industry market to book ratio (see equation 8).
jtq jtq i ijtq
MB
ν
λ
λ
ε
=
0+
1 −4+
(8) where i ijtqε
= Aggregated error terms from the first stage analysis per industry4
−
jtq
MB = Lagged aggregate industry market to book ratio
---Please insert Table 4 and 5 here---
Descriptive statistics of the variables used in the second stage are presented in Table 5. Panel B of Table 4 presents the result of the second stage analysis. The coefficient of the industry valuation from the second step is significantly positive, which is consistent with our hypothesis. This result shows that the industry average valuation has a positive relationship with the earnings management, after controlling for the usual suspects. The coefficient of the industry valuation is
0.0014, which is significant at 0.0001 level. This result implies that one standard deviation increase in industry valuation leads to an increase of 0.08 percentage point in aggregated error terms, which is about 11% of its average value. To translate this result into earnings per share, we first calculate the quarterly industry wide assets per share, which is a ratio of the sum of total assets to the sum outstanding shares in each quarter. The mean of the industry asset per share in our sample is 30.06 dollars per share. One standard deviation increase in industry market to book ratio will lead to an increase of about 2.4 cents (0.08% * 30.06= 2.4) in quarterly aggregate earnings per share. In sum, our result suggests that industry valuation influences the degree of earnings management, especially the current component of earnings management.
Discretionary accruals
Most earnings management studies use total discretionary accruals to proxy for earnings management. Although total discretionary accruals are not the best proxy in the context of our analysis, we also examine the relationship between the industry valuation and discretionary accruals. Equation 9 shows the first stage of the analysis with discretionary accruals as the dependent variable. In this stage, we still regress the firm level discretionary accruals on the control variables, which have been examined by prior studies. The error terms from this analysis are assumed to represent the part not explained by the control variables. After the
first stage analysis, we aggregate the error terms of firms in same industry of each quarter and regress the aggregated error terms on industry valuation in the second stage (Equation 10). ijtq in qtr m n m n n ijtq m m n m n n ijtq m ijtq ijtq ijtq ijtq ijtq ijtq D D SEO IPO ROA SIZE FreeC LEV VAL DA
ε
α
α
α
α
α
α
α
α
+ + + + + + + + + + = = = − = = + = = − = = + − − − − − 4 , 23 4 , 15 4 , 14 4 , 6 4 5 4 4 4 3 4 2 4 1 0 (9)Where DAijtq = Discretionary accruals estimated by modified Jones model
jtq jtq i ijtq
MB
ν
λ
λ
ε
=
0+
1 −4+
(10)Table 6 presents the result of the analysis based on Equation 9. In the Panel A of Table 6, except for the coefficient of firm valuation (VALijtq-4), the coefficients
of other independent variables are similar with those in prior studies. The signs of these coefficients are in line with expectations. Panel B of Table 6 shows the result of equation 10. Table 7 presents the statistics of the variables in the second stage analysis. The positive coefficient of industry average market to book ratio indicates a positive relationship between industry valuation and the earnings management, beyond the control variables. The coefficient of the industry valuation is 0.0027 and significant at 0.0001 level. One standard deviation increase in the industry valuation leads to an increase of 0.14 percentage points in aggregated error terms, which is about 16% of its average value.
---Please insert Table 6 and 7 here--- Robustness checks
To exclude alternative explanations for the previous results, we conduct several sensitivity analyses. First, it is possible that our results are driven by high tech firms because high tech firms use more stock based compensations that other firms. A higher level stock based compensation can create more incentives for firms to manage earnings. To control for these effects, we follow the definition of high tech firms by Loughran and Ritter (2004) and exclude these high tech firms from our sample. We find that the relationship between industry valuation and earnings management is still significantly positive. This result shows that the positive association between industry valuation and earnings management is not driven by the high tech sector.
Second, during the booming of the stock market in the late 1990s, the likelihood to detect earnings management may be higher than other periods. Accounting fraud cases may have increased investors scrutiny. Therefore, our results may be driven by the stock market bubble, such as in the years 1999 and 2000. To mitigate this effect, we exclude observations in 1999 and 2000 from our sample and re-run the analyses. The results remain significant positive, indicating an association between industry valuation and earnings management. Hence, our results are not driven by bubble years.
Third, we test our hypothesis using four quarter lagged industry valuation because we assume that managers take the action of managing earnings by evaluating industry valuation level of the same quarter in the past year. To examine the sensitivity of this to our results, we also test the relationship between earnings management and industry valuation of three quarter, two quarter and one quarter ago. The results show that earnings management also has a positive relationship with the industry valuation with three quarter lag, two quarter lag, and one quarter lag.
5. Summary and Conclusion
This study investigates the relationship between industry valuation and earnings management behavior. Previous academic research has investigated several capital market motivations of earnings management. However, most of these studies take the industry environment as constant and focus on earnings management around firm specific and transaction specific transactions. We argue that the industry valuation will affect the expected payoff and the cost of earnings management, and thus has an impact on earnings management. Our main hypothesis is that industry valuation has a positive impact on the degree of earnings management in an industry.
We apply a two stage empirical model to explore the association between industry aggregate earnings management and industry valuation. We use current
discretionary accruals as our proxy for earnings management because it is “the component most easily subject to successful managerial manipulation (Teoh et al., 1998, page 195)”. Besides using current discretionary accruals as the proxy of earnings management, we also follow other earnings management studies and use discretionary accruals as another proxy for earnings management. After controlling for the effects of other factors on earnings management, such as leverage, firm size and firm performance, we find a significant positive relationship both between industry valuation and aggregate discretionary current accruals, and between industry valuation and aggregate discretionary accruals. Therefore, we conclude that industry valuation is another motivation of earnings management.
In sum, the empirical findings reported in this study show that earnings management decisions are not only subjective to firm-specific or transaction-specific factors, but also influenced by levels of industry valuation. Our claim is that industry valuation provides an accurate measure to examine the impact of market conditions, i.e. the valuation levels of stocks on earnings management, since economic cycles vary in time across industry. Industry valuation therefore constitutes an important factor that enables us to explain earnings management motives. In addition, different from existing studies (Jensen, 2005) on overvalued firms and earnings management, we show that the level of industry valuation can impact the earnings management decisions of all firms in that industry.
References:
Ball, R. and P. Brown. 1968. An empirical evaluation of accounting income numbers. Journal of Accounting Research 6, 159-78.
Bartov, E. 1993. The timing of asset sales and earnings manipulations. The Accounting Review 68, 840-855.
Bartov, E., D. Givoly. And C. Hayn. 2002. The rewards to meeting or beating earnings expectations. Journal of Accounting & Economics 33, 173.
Baker, M, R. Ruback and J. Wurgler. 2004. Behavioral corporate finance: a survey. Handbook of Corporate Finance: Empirical Corporate Finance. Vol. 4, North-Holland.
Becker, C. L., M. L. Defond, J. Jiambalvo, and K.R. Subramanyam. 1998. The Effect of audit quality on earnings management. Contemporary Accounting Research 15, 1-24.
Bowen, R. M., Noreen, E. W. and J. M. Lacey. 1981. Determinants of the corporate decision to capitalize interest. Journal of Accounting and Economics 3, 151-179.
Bowen, R.M., S. Rajgopal, and M. Venkatachalam. 2004. Accounting discretion, corporate governance and firm performance. Working paper.
Burgstahler, D., and M. Eames. 1998. Earnings management to avoid losses and earnings decreases: are analysts fooled? Contemporary Accounting Research 20, 253–294.
Dechow, P., R. Sloan and A. Sweeney. 1995. Detecting earnings management. The Accounting Review 70, 193-225.
Dechow, P., R. Sloan, and A. Sweeney. 1996. Causes and consequences of earnings manipulation: an analysis of firms subject to enforcement actions by the SEC. Contemporary Accounting Research 13, 1-36.
Degeorge, F, J. Patel, and R. Zeckhauser. 1999. Earnings management to exceed thresholds. Journal of Business 72, 1-33.
Dyck, A. and L. Zengales. 2002. The bubble and the media. Corporate, Governance and Capital Flows in a Global Economy. Oxford University Press, New York.
Fischer, S. and R. Merton. 1985, Macroeconomics and finance: the role of stock market. NBER working paper No.1291.
Francis, J., D. Hanna and L. Vincent. 1996. Causes and effects of discretionary asset write-offs. Journal of Accounting Research 34, 117-134.
Friedlan, J. 1994. Accounting choices by issuers of initial public offerings. Contemporary Accounting Research 11, 1-31.
Gompers, P., J. Ishii and A. Metrick. 2003. Corporate governance and equity prices. Quarterly Journal of Economics 118, 107-155.
Graham, J., R., H. R. Campbell and S. Rajgopal. 2005. The economic implications of corporate financial reporting. Journal of Accounting and Economics 40, 3-73.
Harford, J. 2005, What drives merger waves? Journal of Financial Economics, 77, 529-560.
Healy, P. and J. Wahlen. 1999. A review of the earnings management literature and its implication for standard setting. Accounting Horizons13, 365-383.
Hirshleifer, D., K. Hou and S. H. Teoh. 2004. Accruals and aggregate stock market returns. Working paper.
Hunt, A., T.J. Shevlin and S. Moyer. 1996. Managing interacting accounting measures to meet multiple objectives: a study of LIFO firms. Journal of Accounting and Economics 21, 339-374.
Kaplan, S, N. and L. Zingales. 1997. Do investment-cash flow sensitivities provide useful measures of financing constraints? Quarterly Journal of Economics 112, 169-215.
Kasznik, R. 1999. On the association between voluntary disclosure and earnings management, Journal of Accounting Research 37, 57-81.
Kothari, R., A. J. Leone and C. E. Wasley. 2005. Performance matched discretionary accrual measure. Journal of Accounting and Economics 39, 163-197. Kothari, R., E. Loutskina and V. Nikolaev. 2006. Agency theory of overvalued equity as an explanation for the accrual anomaly. Working Paper.
Lamont, O. and J. Stein. 2006. Investor sentiment and corporate finance: micro and macro. American Economic Review 96, 147-151.
Lee, B. S. 1992. Casual relations among stock returns, interest rates, real activity and inflation. Journal of Finance 47, 1591-1603.
Loughran, T and J. Ritter. 2004. Why has IPO underpricing changed over time? Financial Management 33, 5-37.
Jensen, M. 2005. Agency costs of overvalued equity. Financial Management, 34, 5-19.
Mackay, P. and G. Phillips. 2005. How does industry affect firm financial structure? Review of Financial Studies 18, 1433-1466.
Manzon, G. 1992. Earnings management of firms subject to the alternative minimum tax. Journal of the American Taxation Association 14, 86-111.
Marquardt, C. A. and C. Wiedman 2004. How are earnings managed? An examination of specific accruals. Contemporary Accounting Research 21, 461-491.
Matsumoto, D. 2002. Management’s incentives to avoid negative earnings surprises. The Accounting Review 77, 483-514.
Murphy, K. 1999. Executive Compensation. Handbook of Labor Economics, Vol. 3, North Holland.
Rajgopal, S., L. Shivakumar and A.V. Simpson. 2007. The catering theory of earnings management. Working Paper.
Shivakumar, L. 2000. Do firms mislead investors by overstating earnings before seasoned equity offering? Journal of Accounting and Economics 29, 339-371.
Skinner, D. J. and R. G. Sloan. 2002. Earnings surprises, growth expectations, and stock returns or don't let an earnings torpedo sink your portfolio. Review of Accounting Studies 7, 289-312.
Sloan, R. G. 1996. Do stock prices fully reflect information in accruals and cash flow in future earnings. The Accounting Review 71, 289-315.
Solt, M. E. and M. Statman. 1988. How useful is the sentiment index. Financial Analyst Journal, September to October, 45-55.
Teoh, S., I. Welch and T. Wong. 1998a. Earnings management and the long-run market performance of initial public offerings. Journal of Finance 53, 1935-1974. Teoh, S., I. Welch and T. Wong. 1998b. Earnings management and the underpeformance of seasoned equity offerings. Journal of Financial Economics 50, 63-99.
Teoh, S., T. Wong and G. Rao. 1998. Are accruals during initial public offerings opportunistic? Review of Accounting Studies 3, 175–208.
Veronesi, P. 1999. Stock market overreaction to bad news in good times: a rational expectation equilibrium model. Review of Accounting Studies 12, 975-1007.
Watts, R. L. and J. L. Zimmerman. 1990. Positive accounting theory: a ten-year perspective. TheAccounting Review 65, 131-156.
Xie, B., W. Davidson and P. J. DaDalt. 2003. Earnings management and corporate governance: the role of the board and the audit committee. Journal of Corporate Finance 9, 295-316.
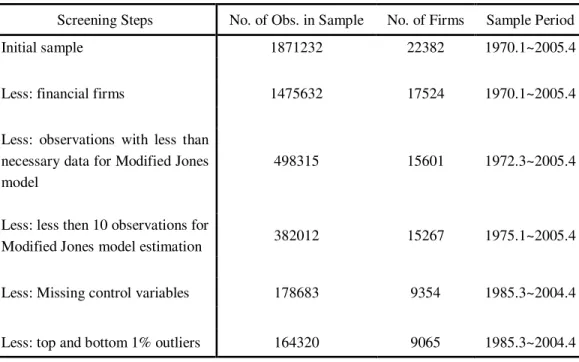
Table 1 Sample criteria
Table 1 presents the steps to screen our initial sample. Firstly, we screen this initial sample by non-US stocks and financial companies (SIC code starting with 6). Secondly, we delete the observations which do not have enough data to estimate discretionary accruals by cross sectional Modified Jones model. Thirdly, we drop observations if there are less than 10 observations to estimate the coefficients of total accruals. Fourthly, we exclude observations which have the missing market value and book value, and other missing control variables. Finally, we delete the outliers by excluding the bottom and top 1% of every variable.
Screening Steps No. of Obs. in Sample No. of Firms Sample Period
Initial sample 1871232 22382 1970.1~2005.4
Less: financial firms 1475632 17524 1970.1~2005.4
Less: observations with less than necessary data for Modified Jones model
498315 15601 1972.3~2005.4
Less: less then 10 observations for
Modified Jones model estimation 382012 15267 1975.1~2005.4 Less: Missing control variables 178683 9354 1985.3~2004.4 Less: top and bottom 1% outliers 164320 9065 1985.3~2004.4
Table 2 Descriptive statistics
Table 2 presents the descriptive statistics of the sample with current discretionary accruals as the dependent variable. DCAijtq is quarterly current
discretionary accruals estimated from modified Jones model. MBijtq-4 is industry market to book ratio with a four quarter lag behind the quarter of DCAijtq. VALijtq-4,
LEVijtq-4, FreeCijtq-4, SIZEijtq-4, ROAijtq-4, represent market to book ratio of
individual firms, leverage, demand of external capital, firm size, firm performance and firm risk respectively. They all have a four quarter lag behind the quarter when DCA is estimated. VALijtq-4 is defined as the book value of assets
(Compustat item #44) plus the market value of common stocks, less the sum of book value of common equity (Compustat item #59) and balance sheet deferred taxes (Compustat item #79). The market value of common stocks is the product of outstanding shares (Compustat item #61) and the stock price at the end of fiscal quarter (Compustat item #14). The book value of assets is defined as total assets (Compustat item #44). Market to book ratio is a ratio of market value of a firm to the book value of assets of that firm. LEVijtq-4 is a ratio of total long term debt
(Compustat item #51) to total total assets (Compustat item #44). FreeCijtq-4 is the
absolute value of the ratio of current asset to cash from operations except average capital expenditure. SIZEijtq-4 is defined as the natural logarithm of sales
extraordinary items (Compustat Item #8) scaled by lagged total assets (Compustat Item #44).
Variable Firm-quarters Mean Median Std. Dev Min Max
DCA ijtq 164320 0.0058 0.0046 0.0879 -0.5254 0.6222 MBijtq-4 164320 1.8712 1.637 0.7479 0.752 6.0992 VALijtq-4 164320 1.9875 1.4189 1.6869 0.5518 15.3904 LEVijtq-4 164320 0.1745 0.1228 0.1856 0 0.9055 FreeCijtq-4 164320 0.0753 0 0.2707 0 1 SIZEijtq-4 164320 3.1286 3.1361 2.1979 -3.2968 8.3825 ROAijtq-4 164320 -0.0088 0.0078 0.0638 -0.4764 0.1065 Table 3 Correlation matrix
Table 3 presents the correlation matrix of variables of the final sample.
DCA ijtq MBijtq-4 VALijtq-4 LEVijtq-4 FreeCijtq-4 SIZEijtq-4 ROAijtq-4
DCA ijtq 1 MBijtq-4 -0.0101 1 VALijtq-4 0.0124 0.2661 1 LEVijtq-4 -0.0083 -0.1624 -0.2085 1 FreeCijtq-4 0.0059 -0.0515 0.0247 0.1653 1 SIZEijtq-4 0.0173 -0.0917 -0.2131 0.2433 -0.1285 1 ROAijtq-4 0.0478 -0.1397 -0.2191 0.0305 -0.2267 0.4042 1
Table 4
Panel A of Table 4 presents the results of regression based on Equation 7, where the dependent variable is current discretionary accruals (DCAijtq) of firm i
in industry j at the quarter q of year t. VALijtq-4, LEVijtq-4, FreeCijtq-4, SIZEijtq-4,
ROAijtq-4, RISKijtq-4 represent market to book ratio of individual firms, leverage,
demand of external capital, firm size, firm performance respectively. They all have a four quarter lag behind the quarter in which DCAijtq is estimated. IPOijtq+m
and SEOijtq+mare dummies variables for IPOs and Seasoned Equity offers from
the four quarters before when DCA is estimated to the four quarters after that. The coefficients for quarter and industry dummies are also included in the regression but not reported here. Panel B of Table 4 presents of the results of the second stage regression based on Equation 8, where the dependent variable
i jtq
ε
is the quarterly aggregated error terms of each industry from the first step. The independent variable is the industry market to book ratio, which is the measurement of industry valuation.Panel A: Results of First Stage Analysis ijtq i t m n m n m ijtq n m n m n m ijtq n ijtq ijtq ijtq ijtq
ijtq VAL LEV FreeC SIZE IPO SEO D D
DCA =α +α +α +α +α + α + = α= + + +ε − = = + = = − = = + − − − − 4 , 22 4 , 14 4 , 13 4 , 5 4 4 4 3 4 2 4 1 0
Variable Coefficient P-Value Variable Coefficient P-Value VALijtq-4 0.0010 0.000 IPO ijtq+3 0.0039 -0.039 LEVijtq-4 -0.0052 0.000 IPO ijtq+4 0.0264 -0.018 FreeCijtq-4 0.0061 0.000 SEO ijtq-4 0.0039 0.000
SIZEijtq-4 0.0002 0.092 SEO ijtq-3 0.0043 0.001 ROAijtq-4 0.0725 0.000 SEO ijtq-2 0.0085 0.005 IPO ijtq-4 0.0002 0.979 SEO ijtq-1 0.0118 0.008 IPO ijtq-3 -0.0075 -0.042 SEO ijtq 0.0126 0.009 IPO ijtq-2 0.0199 -0.015 SEO ijtq-+1 0.0091 0.005 IPO ijtq-1 0.0035 -0.032 SEO ijtq+2 0.0042 0.000
IPO ijtq -0.0017 -0.043 SEO ijtq+3 0.0015 -0.003
IPO ijtq+1 -0.0242 -0.065 SEO ijtq+4 0.0052 0.001 IPO ijtq+2 0.0178 -0.023 Intercept 0.0433 0.390
Overall R-sqrt 0.014
No. of Observations 164320
Panel B: Result of Second Stage Analysis
jtq jtq i ijtq MB ν λ λ ε = 0 + 1 −4 +
Variable Predicted Sign Coefficient p-value
MBjtq-4 + 0.0014 0.000
Intercept 0.0053 0.000
Adjusted R-sqrt 0.007
No of observations 4549
Table 5
The Statistics of Variables in the Second Stage Analysis
Variable Industry Quarters Mean Std. Deviation Minimum Maximum
MBjtq-4 4549 1.5957 0.5361 0.7520 6.0992
4549 0.0075 0.0086 -0.0335 0.0608
−
i jtq 4
Table 6
Panel A of Table 6 presents the results of regression based on Equation 9, where the dependent variable is discretionary accruals (DAijtq) of firm i in industry
j at the quarter q of year t. VALijtq-4, LEVijtq-4, FreeCijtq-4, SIZEijtq-4, ROAijtq-4,
represent market to book ratio of individual firms, leverage, demand of external capital, firm size, firm performance respectively. They all have a four quarter lag behind the quarter in which DAijtq is estimated. IPOijtq+m and SEOijtq+m are
dummies variables for IPOs and Seasoned Equity offers from the four quarters before when DA is estimated to the four quarters after that. The coefficients for quarter and industry dummies are also included in the regression but not reported here. Panel B of Table 6 presents of the results of the second stage regression based on Equation 10, where the dependent variable
i jtq
ε
is the quarterly aggregated error terms of each industry from the first step. The independent variable is the industry market to book ratio, which is the measurement of industry valuation.Panel A: Results of First Stage Analysis ijtq i t m n m n n ijtqm m n m n n ijtqm ijtq ijtq ijtq ijtq
ijtq VAL LEV FreeC SIZE IPO SEO D D
DA =α +α +α +α +α + α + = α= + + +ε − = = + = = − = = + − − − − 4 , 22 4 , 14 4 , 13 4 , 5 4 4 4 3 4 2 4 1 0
Variable Coefficient P-Value Variable Coefficient P-Value
VALijtq-4 -0.0005 0.044 IPO ijtq+3 -0.0051 0.864
LEVijtq-4 0.0077 0.001 IPO ijtq+4 0.0191 0.527
FreeCijtq-4 0.0078 0.000 SEO ijtq-4 -0.0038 0.237
SIZEijtq-4 -0.0006 0.000 SEO ijtq-3 0.0010 0.763
ROAijtq-4 0.1136 0.000 SEO ijtq-2 0.0055 0.085
IPO ijtq-4 0.0000 0.999 SEO ijtq-1 0.0063 0.060
IPO ijtq-3 0.0010 0.976 SEO ijtq 0.0111 0.001
IPO ijtq-2 0.0303 0.343 SEO ijtq-+1 0.0067 0.052
IPO ijtq-1 -0.0087 0.780 SEO ijtq+2 0.0008 0.822
IPO ijtq -0.0307 0.401 SEO ijtq+3 0.0038 0.279
IPO ijtq+1 -0.0335 0.360 SEO ijtq+4 0.0087 0.015
IPO ijtq+2 0.0142 0.658 Intercept 0.0677 0.468
Overall R-sqrt 0.029
No. of Observations 127257
Panel B: Result of Second Stage Analysis of the DA Sample
jtq jtq i
ijtq λ λ MB ν
ε = 0 + 1 −4 +
Variable Predicted Sign Coefficient p-value
MBjtq-4 + 0.0027 0.000
Intercept 0.0043 0.000
Adjusted R-sqrt 0.004
No of observations 4391
Table 7
The Statistics of Variables in the Second Stage Analysis
Variable Industry quarters Mean Std. Deviation Minimum Maximum
MBjtq-4 4391 1.5909 0.5325 0.752 6.0992
4391 0.0086 0.0237 -0.0501 0.0847
−
i jtq 4
Publications in the Report Series Research
∗in Management
ERIM Research Program: “Finance and Accounting”2007
Revisiting Uncovered Interest Rate Parity: Switching Between UIP and the Random Walk
Ronald Huisman and Ronald Mahieu ERS-2007-001-F&A
http://hdl.handle.net/1765/8288
Hourly Electricity Prices in Day-Ahead Markets
Ronald Huisman, Christian Huurman and Ronald Mahieu ERS-2007-002-F&A
http://hdl.handle.net/1765/8289
Do Exchange Rates Move in Line with Uncovered Interest Parity?
Ronald Huisman, Ronald Mahieu and Arjen Mulder ERS-2007-012-F&A
http://hdl.handle.net/1765/8993
Hedging Exposure to Electricity Price Risk in a Value at Risk Framework
Ronald Huisman, Ronald Mahieu and Felix Schlichter ERS-2007-013-F&A
http://hdl.handle.net/1765/8995
Corporate Governance and Acquisitions: Acquirer Wealth Effects in the Netherlands
Abe de Jong, Marieke van der Poel and Michiel Wolfswinkel ERS-2007-016-F&A
http://hdl.handle.net/1765/9403
The Effect of Monetary Policy on Exchange Rates during Currency Crises; The Role of Debt, Institutions and Financial Openness
Sylvester C.W. Eijffinger and Benedikt Goderis ERS-2007-022-F&A
http://hdl.handle.net/1765/9725
Do Private Equity Investors Take Firms Private for Different Reasons?
Jana P. Fidrmuc, Peter Roosenboom and Dick van Dijk ERS-2007-028-F&A
http://hdl.handle.net/1765/10070
The Influence of Temperature on Spike Probability in Day-Ahead Power Prices
Ronald Huisman ERS-2007-039-F&A
http://hdl.handle.net/1765/10179
Costs and Recovery Rates in the Dutch Liquidation-Based Bankruptcy System
Oscar Couwenberg and Abe de Jong ERS-2007-041-F&A
http://hdl.handle.net/1765/10461
The Volatility Effect: Lower Risk without Lower Return
David C. Blitz and Pim van Vliet ERS-2007-044-F&A
Strategic Debt: Evidence from Bertrand and Cournot Competition
Abe de Jong, Thuy Thu Nguyen and Mathijs A. van Dijk ERS-2007-057-F&A
http://hdl.handle.net/1765/10504
Capital Structure Around the World: The Roles of Firm- and Country-Specific Determinants
Abe de Jong, Rezaul Kabir and Thuy Thu Nguyen ERS-2007-058-F&A
http://hdl.handle.net/1765/10517
The Effects of Federal Funds Target Rate Changes on S&P100 Stock Returns, Volatilities, and Correlations
Helena Chulia-Soler, Martin Martens and Dick van Dijk ERS-2007-066-F&A
Industry Valuation Driven Earnings Management
Tao Jiao, Gerard Mertens and Peter Roosenboom ERS-2007-069-F&A
∗
A complete overview of the ERIM Report Series Research in Management:
https://ep.eur.nl/handle/1765/1
ERIM Research Programs:
LIS Business Processes, Logistics and Information Systems ORG Organizing for Performance