Predicting Engineering Student Success Using Machine Learning
Tatenda Taodzera, Bhekisipho Twala,Johnson CarrollDepartment of Electrical and Electronics Engineering Science, University of Johannesburg, South Africa.
[email protected]; [email protected]; [email protected]
Recent years have seen an increase in the number of students from diverse backgrounds enrolling into South African universities, presenting many challenges. Some students struggle with their academic choices, and universities struggle to understand and address the individual needs of such a diverse student base. Fortunately, vast amounts of student information have been collected and stored, giving an opportunity for researchers in educational data mining to derive some useful insights from this data to help both the universities and students. This research aims to identify factors that contribute to the success and or failure of a student, then predict the future performance of the student at enrolment. By using data pre-processing techniques, the experiments identify the most significant success factors from the data at enrolment time. The most significant factors can then be used to identify students who may need extra support, and the nature of those factors can help determine the manner of support needed. This study implemented and evaluated the effectiveness of the most commonly used and new machine learning algorithms in predicting student performance on a sample of 1366 engineering students. The results show various degrees of success in predicting student performance, and it is hoped that these findings will guide the selection of machine learning algorithms for future studies.
Introduction
South Africa needs engineering graduates. The government of South Africa issued calls for engineering graduates to increase the infrastructural development of the nation thus the demand for engineering professionals is extremely high (Case, 2006). However, the throughput rates from engineering programmes at academic institutions are still low. As reported by Lawless (2005), annual graduations in engineering for 2005 were approximately 2000 and about 3000 qualifiers from programmes at universities of technology. By 2002, there were approximately 12 000 students in the university system and just over 2000 graduated that same year (Lawless, 2005). These figures are significantly low for huge a nation which has such a high demand for the engineering skill.
Most studies of student performance focus on western settings (Poh & Smythe, 2014). The South African context is different because it is a rapidly developing nation with a vast amount of opportunities and a critical demand for the engineering skill. Significant socio-economic disparity has a huge impact. Most of the rural schools are characterized by poor facilities, inadequate resources and generally high failure rates (Poh and Smythe, 2014). Some poor and rural students study by candlelight, walk long distances to get to school, and often support many dependants (Poh & Smythe, 2014). Consequently, students from these backgrounds, given their poor academic background and inadequate English-language ability, tend to face challenges in their tertiary studies and do not perform as well as expected (Rauchas et al., 2006). On the other hand, (and in the same university classroom), some South African students from various backgrounds attended better performing schools with significantly better learning facilities, well qualified teachers, and higher educational standards. Lastly, the minority attend expensive
and independent private schools or colleges where the quality of education is often extremely high (Mashiloane, 2015).
Better understanding of which aspects of students’ backgrounds impact on their success in engineering study is therefore of vital importance. This study seeks to better understand the interacting variables affecting engineering student performance at a South African university and to attempt to predict student success based on information available at enrolment. This will help the university to identify potentially at-risk students and develop more targeted measures to assist them. This study will implement and evaluate the effectiveness of the most commonly used and new machine learning algorithms in predicting student performance.
Data mining can be defined as the process of using a variety of data analysis tools to discover hidden patterns and relationships in data that may be used to make valid predictions. It is the process of extraction of useful information and patterns from a large data set. The selected algorithm or a combination of algorithms are implemented to build a model which searches for patterns of interest in the chosen dataset. The model built on the dataset is thus applied to predict new instances on new data. Machine learning is the field of study that gives computers the ability to learn without being explicitly programmed (Russell, 1995).
As an emerging field of study, educational data mining attempts to identify and expound on the key factors affecting student retention, pass rate, student performance and ultimately, quality of graduates released into the industry and society. South African universities currently use various methods to select and support first year students, but this research seeks to better identify factors associated with students’ success and failure, helping students choose the right course of study and predicting the academic performance of a student. Thus, the university will can better allocate student support resources and ultimately improve student retention and graduation rates.
Background
In an analysis of the related studies conducted over a 20-year period, it was observed that some of the commonly used machine learning algorithms include artificial neural networks (ANN), the J48 decision tree (DT), naïve Bayes (NB) classifiers, support vector machines (SVM), linear regression (LR), logistic regression (LG), and the k-nearest neighbour (kNN) algorithm. It was also noted that some of the features that were regarded as useful in the studies of student performance prediction were past academic scores, demographic and socio-economic information.
Research in student performance dates to 1996, when Cripps (1996) predicted student performance using ANN. Cripps (1996) investigated the effectiveness of ANN in predicting degree program completion, earned hours, and grade point average for college students. McLauchlan et al. (1999) researched on student performance with ANN and concluded that the algorithm showed promise as a predictive modelling tool which could be used for assessment or evaluation purposes. In the early 21st century, Hunt (2000) compared LG and the emerging ANN and concluded that logistic regression performed statistically better than the neural network. As machine learning developed, researchers such as Wang and Mitrovic (2002) implemented ANN to a student dataset and obtained an impressive 81% accuracy, with their main attribute being internal assessments. Minaei-Bidgoli and Punch (2003) mined data from an on-line educational system which involved student behaviour and traits including marks and used these features to predict students’ final grade.
Nigerian researchers (Oladokun et al., 2008) collected variables from 5 generations of graduates` data and built a model using ANN to predict the likely performance of a candidate
being considered for admission into the university and achieved a prediction accuracy of over 74% showing that ANN can work successfully as a prediction tool. Cortez and Silva (2008) investigated the reason for student failure in mathematics and the Portuguese language by using DT, random forest learning, ANN, and SVM. The results concluded that a good predictive accuracy could be achieved if the first and second school period grades were available. Ramaswami and Bhaskaran (2009) conducted a study on feature selection techniques in educational data mining using NB algorithm and determined the impact of feature selection on the prediction accuracy of a classifier. The results which they obtained showed that a minimum number of features resulted in an increase in prediction accuracy, increase in performance of an algorithm and reduction of computational time. Kovacic (2010) explored the impact of socio-economic, demographic and environmental factors on the persistent drop-out of students using DT algorithm and obtained a classification accuracy of 60.5%, thereby drawing a conclusion that the most important factors separating successful and unsuccessful students are ethnicity, course program and course block.
García and Mora (2011) presented work done using a NB algorithm to obtain a model for predicting new students` academic performance taking into consideration socio-demographic and academic variables and obtained 60% accuracy. Osmanbegović and Suljić (2012) investigated the impact of socio-economic, demographic variables and entrance test exam on student performance and conducted experiments using the DT, NB, and ANN algorithms to predict the final grade. In this case, the NB algorithm predicted better than the other two, with 76.65% accuracy, though the others also proved good predictors (the ANN predictor scored lowest with 71.2% accuracy).
Singh and Kumar (2013) evaluated the effectiveness of the NB algorithm, the decision table, instance based learning, and ANN in building a classification model for predicting student performance in 2013. In this case, the instance based learning algorithm generated the most efficient and effective model ideal for that dataset.
Freeman et al (2014) obtained accuracy of 65% using a DT algorithm and 69% using kNN. Also in the same year, Ahmed and Elaraby (2014) evaluated the DT algorithm, rule induction, ANN, kNN and NB algorithms for their effectiveness in classification of student performance and obtained a classification accuracy of 83.65% using the NB algorithm.
In a study conducted by Shahiri and Husain (2015), 90% prediction accuracy was obtained using DT algorithm in predicting student performance and the main attributes were internal assessment, student demographic and extra-curricular activities. Also in another 2015 research by Jishan et al (2015), 91% prediction accuracy in student performance using DT algorithm was obtained with cumulative grade point average as the most important attribute for prediction. Mashiloane (2015), a South African researcher experimented on classification and clustering and implemented a variety of machine learning algorithms to predict student performance in 2015. The study focused primarily on a dataset of 826 instances obtained from Computer science students at a South African university and the investigation obtained poor results of less than 50% performance in prediction from the classification algorithms implemented. Because of the poor performance of the classifiers implemented, it was not possible to convincingly answer the question that student performance in Computer Science could be predicted.
Most recently, Intelligentie and Bredeweg (2016) used internal assessment and extra-curricular activities as the main attributes and implemented a SVM that obtained 80% classification accuracy in student performance.
The literature review highlights the effectiveness and success of machine learning algorithms in predicting student performance. Interestingly, it can also be observed that relatively little student performance prediction research has been done in Africa, particularly in the South African context. It was also observed that five machine learning algorithms namely DT, ANN, SVM, LG and NB were frequently highly successful in student performance prediction in other academic environments; this research aims to evaluate these five machine learning algorithms in a South African context.
Research Question and Aim
The research question to be addressed by this paper is, “Is the use of machine learning algorithms in academic data mining effective in predicting student performance in South African engineering programmes?” This research aims to identify the contributing factors of student success in engineering education in a South African context and implement machine learning algorithms to predict, with the highest degree of accuracy, student performance of a prospective first year engineering student.
Methodology
This paper implements machine learning algorithms in academic data mining to understand and predict student performance. In this research, student performance is modelled as a classification problem. The response variable, motivated by the Universities’ rules and regulations, is based on the number of subjects passed to proceed to second year. The features evaluated in this paper consist of all the engineering student data that was made available to the researches by the University. However, after implementing feature selection methods, only the variables that contribute more to the success or failure of a student are the ones used in model building.
Five machine learning algorithms are identified in the literature for consideration in this study: SVM, ANN, DT, LG and NB. They are selected because of their success in other academic environments. A SVM algorithm is a discriminative technique that implements a separating hyperplane on the data points which maximises the margin between two classes. This method is highly effective for both linear and non-linear data and performs exceptionally well in both binary and classification tasks. ANNs are the computational or mathematical model derived from the biological neural network structure. The multilayer perceptron algorithm is a commonly used implementation of ANN which consists of “a set of sensory elements that make up the input layer, one or more hidden layers of processing elements, and the output layer of the processing elements” (Witten et al., 2016). The DT algorithm is a supervised learning technique which breaks down and subdivides a dataset into smaller partitions of similar nature while incrementally developing a decision tree model. The algorithm is developed through an iterative process of splitting data into discreet groups, where the objective is to maximize the distance between groups at each split. LG is a supervised learning technique which is used to ascertain the probability of an event occurring in a binary format. It describes data and elaborates more on the relationship between a dependent binary variable and one or more independent variables. The NB algorithm is technique which is derived from prior probability, a Bayesian approach that predicts future events based on previous knowledge, experience and the likelihood of occurrence. It is derived from Bayes rule of conditional probability stemming from the assumptions that attributes are conditionally independent and that there are no hidden attributes that can affect the prediction process.
Two software packages were used in conducting this study: Python 3.0 (Van Rossum, 2009) and Weka (Hall et al., 2005). Python is a programming language mainly used in the field of
data science and Weka is a software package developed at the Waikato University in New Zealand for statistical and machine learning.
The next section of the paper discusses how the student data is pre-processed into the correct format for further analysis. Then, feature selection techniques such as correlation analysis identify the most informative variables that attribute to student success. In the following section results are discussed. When evaluating performance of models built by the machine learning algorithms chosen in this study, accuracy refers to the percentage of the correctly classified instances and error is described by the percentage of the incorrectly classified instances. Data Pre-Processing
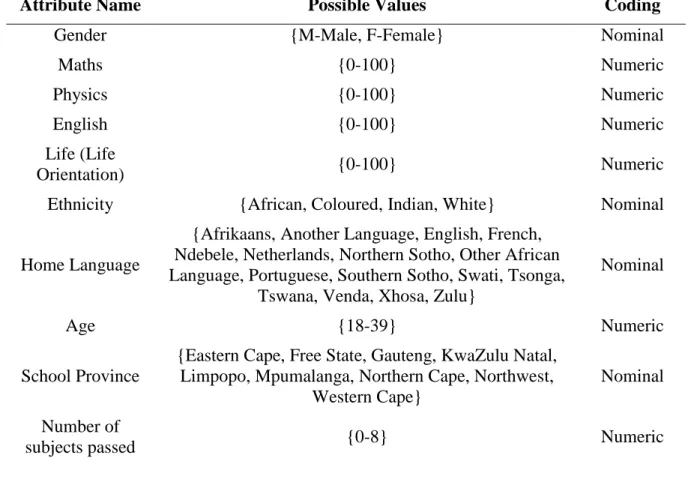
The dataset consists of enrolment and performance data for four-year engineering degree students from a South African university. The data underwent a knowledge discovery process involving pre-processing where it was cleaned, outliers were detected and removed and imputing decisions were made on missing values. The data was then transformed into the right format for analysis to be performed. After pre-processing the data, 1366 student records were taken into consideration. The features considered for this study are outlined in detail in Table 1. Note that these features were not necessarily selected based on assumed applicability to student success, but rather on the consistency and perceived accuracy of the available data. For example, socioeconomic indicators in this data set were based on unverified student application responses which were frequently missing. The possible values also reflect the raw data, and in some cases are as presented as reported by the applicants themselves.
Table 1. List of attributes available after pre-processing.
Attribute Name Possible Values Coding
Gender {M-Male, F-Female} Nominal
Maths {0-100} Numeric
Physics {0-100} Numeric
English {0-100} Numeric
Life (Life
Orientation) {0-100} Numeric
Ethnicity {African, Coloured, Indian, White} Nominal
Home Language
{Afrikaans, Another Language, English, French, Ndebele, Netherlands, Northern Sotho, Other African Language, Portuguese, Southern Sotho, Swati, Tsonga,
Tswana, Venda, Xhosa, Zulu}
Nominal
Age {18-39} Numeric
School Province
{Eastern Cape, Free State, Gauteng, KwaZulu Natal, Limpopo, Mpumalanga, Northern Cape, Northwest,
Western Cape}
Nominal Number of
Religion
{Afrikaanse Protestante Kerk, Anglican, Apostolic Faith Mission of Sa, Assembly of God, Christian, Full Gospel
Church, Gereformeerde, Hindu, Jehovah’s Witness, Jewish church, Lutheran, Methodist, Muslim, Nazarene,
Nederduitsch Hervormde, Old Apostolic of Africa, Other, Roman Catholic, Seventh Day Adventist, Zion}
Nominal
Result {P-Pass, F-Fail} Nominal
Variable Selection
Variable selection entails selecting the most relevant features necessary for optimally building prediction or classification models for better model performance. Irrelevant features result in low performing classifiers and thus must be excluded. It is necessary for elimination of noisy data and enables us to retain the most beneficial attributes. Furthermore, the prediction accuracy and training time of the model is greatly improved. There are a variety of ways of conducting feature or variable selection, but we focus on correlation analysis and wrapper methods. Filter methods use statistical analysis to individually check the relationship between each variable and the response variable. A scoring is thus applied indicating whether a feature can be kept or dropped. The most straightforward filter method is classical correlation analysis, which quantifies the dependencies between variables based on the data set. The resulting correlation is a number between -1 to 1; 0 indicates no correlation, while 1 and -1 indicate perfect positive and negative correlation, respectively. If two predictor variables are highly correlated, the prediction algorithm will not benefit from considering both variables. Also, if correlation between a feature and the response variable is 0, then that feature has no impact on the response and can clearly be dropped from the prediction analysis.
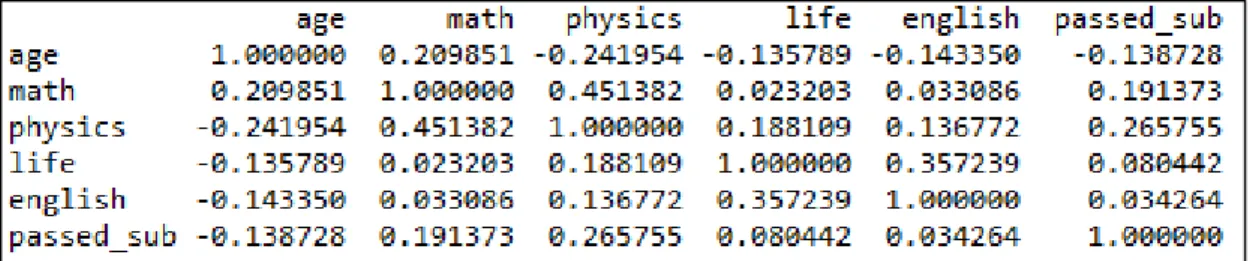
Figure 1. Correlation matrix showing the correlation between variables.
Figure 1 shows a subset of the correlation matrix for only the numeric variables in this study. The response variable, “passed_sub,” is the number of subjects passed. Note that physics is the most highly correlated feature to the response, followed by mathematics and age. One can also see that Maths and Physics are unsurprisingly the most correlated of the features. However, a correlation of around 0.472 is not strong enough to make one of the variables redundant, particularly when these two variables are the most correlated with the response. This is how the numeric data interacts with the response variable.
Applying correlation analysis to both the numeric and non-numeric variables in the dataset, correlation between a variable and the response variable can be determined and ranked in Table 2 as follows:
Table 2. Correlation ranking. Attribute Correlation Physics 0.2391 Maths 0.1836 Age Ethnicity Life English Religion Gender School province Home language 0.1191 0.0808 0.0773 0.052 0.0408 0.0387 0.0359 0.029
Another useful technique for analysing the set of features involves selecting subsets features implementing the prediction algorithms using only the subsets. A straightforward search can then identify which subsets of features yielded the best results, and one can then infer the most significant features from the best performing subsets. Table 3 shows which features were most likely to be included in the best performing feature subsets. Note that this list of significant features is similar (but not identical to) the features identified using correlation analysis.
Table 3. Feature selection using wrapper methods.
Selected Feature Rank
Maths 1 Physics Ethnicity School province Age 2 3 4 5
Based on the analysis of results from the wrapper methods and correlation analysis, the wrapper method rank is accepted as it is derived from an in-depth analysis of the variables using multiple algorithms to obtain the best combination of feature that explain the problem better.
Experiments and Results
The initial run of experiments conducted evaluate the performance of different classification algorithms in predicting student performance as shown in Table 4. In terms of classification accuracy, the DT algorithm performed best with an accuracy of 65.86%, and all the tested algorithms were better than 60% accurate.
Table 4. Classification performance comparison
Criteria Algorithm
LR NB ANN SVM DT
Correctly Classified Instances 259 260 247 265 270 Incorrectly Classified Instances 151 150 163 145 140
Prediction Accuracy 63.17% 63.41% 60.24% 64.63% 65.86% Table 5 shows an additional set of estimation criteria for each algorithm. Of interest is the Kappa statistic, which measures how closely the instances classified by each algorithm matches the ground truth. A Kappa of between 0.21-0.40 is considered fair, thus the algorithm has performed fairly. Again, the DT algorithm is the best performer, but all of algorithms could be categorised as fair classifiers.
Table 5. Estimation comparison of classifiers.
Criteria Algorithm
LR NB ANN SVM DT
Mean absolute error 0.45 0.4362 0.45 0.3537 0.435 Kappa statistic 0.2606 0.2635 0.2084 0.2897 0.3157 Root mean squared error 0.4753 0.4864 0.5025 0.5947 0.4846 Relative absolute error 90.10% 87.34% 90.08% 70.81% 87.41% Root relative squared error 95.10% 97.32% 100.53% 118.99% 96.94% Finally, several standard performance measures are presented in Table 6. Note the precision and recall values, which refer to what fraction of the predicted positive outcomes are correct and what fraction of the true positive outcomes were correctly predicted, respectively. Thus, precision is a measure of the classifier`s exactness and recall a measure of the classifiers completeness. The F-measure is the harmonic mean of precision and recall and indicates how well the model balances the two performance measures. In each of these measures the DT algorithm again performs best, with the other algorithms performing similarly.
Table 6. Detailed accuracy by performance measure Algorithm TP Rate FP Rate Precision Recall F-Measure MCC ROC Area PRC Area DT 0.659 0.343 0.658 0.659 0.658 0.316 0.622 0.623 SVM 0.646 0.358 0.647 0.646 0.645 0.292 0.644 0.594 NB 0.634 0.372 0.637 0.634 0.630 0.269 0.664 0.648 LR 0.632 0.372 0.632 0.632 0.630 0.262 0.677 0.655 ANN 0.602 0.393 0.608 0.602 0.600 0.212 0.655 0.654 Conclusion
In this study, five supervised learning algorithms were evaluated based on their performance to predict success or failure in a binary classification problem of classifying either a pass or fail in first year engineering courses. The DT algorithm proved to be very effective in this study of predicting student performance. This is a significant improvement from the previous study done by Mashiloane (2015) in which less than 50% prediction accuracy was obtained in predicting
student performance at a South African University. The success of decisions trees offer an advantage of simplicity and are easier to understand therefore they can be used in an academic setting to enhance and improve student learning by assisting in the allocation of resources and measuring student progress.
Additionally, correlation analysis and prediction using feature subsets were used to identify which of the student characteristics are significant in predicting student success. The variables observed to be most correlated to success include physics and mathematics, which seems appropriate given the engineering curriculum. Indeed, most South African engineering programmes explicitly consider math and physics scores for enrolment. Interestingly, this study also identified ethnicity and school province as significant when predicting student success. The significance of ethnicity is unsurprising when one considers the enduring effects of the Apartheid system on education in South Africa, and should serve as a clear indicator to universities that transformation requires ongoing and focused attention and effort. On the other hand, the significance of the school province could be a direct result of the differing provincial school systems, or might be an indirect indicator of geographic and logistical considerations such as how far a student must travel and whether they stay with family.
This study has shown that learning algorithms can be of value in predicting student success in engineering. Institutions can use these results to consider how to best utilise student support resources to target at-risk students.
Reference
Ahmed, A. B. E. D., & Elaraby, I. S. (2014). Data Mining: A prediction for Student's Performance Using Classification Method. World Journal of Computer Application and Technology, 2(2), 43-47.
Case, J. (2006, September). Issues facing engineering education in South Africa. In 3rd African Regional Conference on Engineering Education, Pretoria (pp. 26-27).
Cripps, A. (1996, February). Using artificial neural nets to predict academic performance. In Proceedings of the 1996 ACM symposium on Applied Computing (pp. 33-37). ACM. Cortez, P., & Silva, A. M. G. (2008). Using data mining to predict secondary school student
performance.
Fayyad, U., Piatetsky-Shapiro, G., & Smyth, P. (1996). From data mining to knowledge discovery in databases. AI magazine, 17(3), 37.
Frank, E., Hall, M., Holmes, G., Kirkby, R., Pfahringer, B., Witten, I. H., & Trigg, L. (2005). Weka. Data Mining and Knowledge Discovery Handbook, 1305-1314.
Freeman, S., Eddy, S. L., McDonough, M., Smith, M. K., Okoroafor, N., Jordt, H., & Wenderoth, M. P. (2014). Active learning increases student performance in science, engineering, and mathematics. Proceedings of the National Academy of Sciences, 111(23), 8410-8415.
García, E. P. I., & Mora, P. M. (2011, November). Model prediction of academic performance for first year students. In Artificial Intelligence (MICAI), 2011 10th Mexican International Conference on (pp. 169-174). IEEE.
Hunt, L. D. (2000). Comparison of neural network and logistic regression models for predicting the academic success of college freshmen. North Carolina State University. Intelligentie, B. O. K., & Bredeweg, B. B. (2016). An exploration of the most indicative
variables of learning performance in data collected from a Learning Management System. Jawitz, J., & Scott, L. (1997, November). Who does not succeed in engineering at the University
Conference, 1997. 27th Annual Conference. Teaching and Learning in an Era of Change. Proceedings. (Vol. 1, pp. 71-75). IEEE.
Jishan, S. T., Rashu, R. I., Haque, N., & Rahman, R. M. (2015). Improving accuracy of students’ final grade prediction model using optimal equal width binning and synthetic minority over-sampling technique. Decision Analytics, 2(1), 1.
Kovacic, Z. (2010). Early prediction of student success: Mining students' enrolment data. Lawless, A. (2005). Numbers & Needs: Addressing imbalances in the civil engineering
profession. The South African Institution of Civil Engineering. 0-620-35092-X.
Mashiloane, L. (2015). Educational data mining (EDM) in a South African University: a longitudinal study of factors that affect the academic performance of computer science I students (Doctoral dissertation, Faculty of Science, University of the Witwatersrand, Johannesburg).
McLauchlan, R. A., Stewart, J., & Pallerla, S. (1999). Using Neural Networks to Predict Student Academic Success in the Engineering Curriculum at Texas A&M University-Kingsville. In Annual ASEE GSW Conference.
Minaei-Bidgoli, B., & Punch, W. (2003). Using genetic algorithms for data mining optimization in an educational web-based system. In Genetic and Evolutionary Computation—GECCO 2003 (pp. 206-206). Springer Berlin/Heidelberg.
Mashiloane, L. (2015). Educational data mining (EDM) in a South African University: a longitudinal study of factors that affect the academic performance of computer science I students (Doctoral dissertation, Faculty of Science, University of the Witwatersrand, Johannesburg).
Mitchell, T. M. (2006). The discipline of machine learning (Vol. 9). Carnegie Mellon University, School of Computer Science, Machine Learning Department.
Oladokun, V. O., Adebanjo, A. T., & Charles-Owaba, O. E. (2008). Predicting students’ academic performance using artificial neural network: A case study of an engineering course. The Pacific Journal of Science and Technology, 9(1), 72-79.
Osmanbegović, E., & Suljić, M. (2012). Data mining approach for predicting student performance. Economic Review, 10(1).
Poh, N., & Smythe, I. (2014, December). To what extend can we predict students' performance? A case study in colleges in South Africa. In Computational Intelligence and Data Mining (CIDM), 2014 IEEE Symposium on (pp. 416-421). IEEE.
Ramaswami, M., & Bhaskaran, R. (2009). A study on feature selection techniques in educational data mining. arXiv preprint arXiv:0912.3924.
Russell, S., Norvig, P., & Intelligence, A. (1995). A modern approach. Artificial Intelligence. Prentice-Hall, Egnlewood Cliffs, 25, 27.
Rauchas, S., Rosman, B., Konidaris, G., & Sanders, I. (2006, March). Language performance at high school and success in first year computer science. In ACM SIGCSE Bulletin (Vol. 38, No. 1, pp. 398-402). ACM.
Shahiri, A. M., & Husain, W. (2015). A review on predicting student's performance using data mining techniques. Procedia Computer Science, 72, 414-422.
Singh, S., & Kumar, V. (2013). Performance analysis of engineering students for recruitment using classification data mining techniques. International Journal of Science, Engineering and Computer Technology, 3(2), 31.
Van Rossum, G. (2009). What’s New In Python 3.0. What's New In Python 3.0—Python V3. 0.1 Documentation.
Wang, T., & Mitrovic, A. (2002, December). Using neural networks to predict student's performance. In Computers in Education, 2002. Proceedings. International Conference on (pp. 969-973). IEEE.
Witten, I. H., Frank, E., Hall, M. A., & Pal, C. J. (2016). Data Mining: Practical machine learning tools and techniques. Morgan Kaufmann.