Dissertations Master's Theses and Graduate Research
Spring 2017
Fiscal Transparency in the Era of California's Local
Control Funding Formula: An Analysis of Funding
Levels, Expenditures, and Student Achievement
Blanca Baltazar-SabbahSan Jose State University
Follow this and additional works at:https://scholarworks.sjsu.edu/etd_dissertations
This Dissertation is brought to you for free and open access by the Master's Theses and Graduate Research at SJSU ScholarWorks. It has been accepted for inclusion in Dissertations by an authorized administrator of SJSU ScholarWorks. For more information, please contactscholarworks@sjsu.edu.
Recommended Citation
Baltazar-Sabbah, Blanca, "Fiscal Transparency in the Era of California's Local Control Funding Formula: An Analysis of Funding Levels, Expenditures, and Student Achievement" (2017).Dissertations. 2.
DOI: https://doi.org/10.31979/etd.5e8y-n8pu
FISCAL TRANSPARENCY IN THE ERA OF CALIFORNIA’S LOCAL CONTROL FUNDING FORMULA: AN ANALYSIS OF FUNDING LEVELS, EXPENDITURES, AND STUDENT
ACHIEVEMENT
A Dissertation Presented to
The Faculty of the Educational Doctoral Program in Educational Leadership San José State University
In Partial Fulfillment
of the Requirements for the Degree Doctor of Education
by
Blanca S. Baltazar-Sabbah May 2017
© 2017
Blanca S. Baltazar-Sabbah ALL RIGHTS RESERVED
The Designated Dissertation Committee Approves the Dissertation Titled
FISCAL TRANSPARENCY IN THE ERA OF CALIFORNIA’S LOCAL CONTROL FUNDING FORMULA: AN ANALYSIS OF FUNDING LEVELS, EXPENDITURES, AND STUDENT
ACHIEVEMENT
by
Blanca S. Baltazar-Sabbah
APPROVED FOR THE EDUCATIONAL DOCTORAL PROGRAM IN EDUCATIONAL LEADERSHIP
SAN JOSÉ STATE UNIVERSITY
MAY 2017
Rebeca Burciaga, Ph.D. Department of Educational Leadership Emily Slusser, Ph.D. Child and Adolescent Development Rosa E. Coronado, Ed.D. Director of Special Projects, San Benito
ABSTRACT
FISCAL TRANSPARENCY IN THE ERA OF CALIFORNIA’S LOCAL CONTROL FUNDING FORMULA: AN ANALYSIS OF FUNDING LEVELS, EXPENDITURES, AND STUDENT
ACHIEVEMENT
by Blanca S. Baltazar-Sabbah
This research presents an analysis of California’s Local Control Funding Formula (LCFF) before and after implementation (AY 2013 to AY 2016). Funding allocations, expenditures, and student achievement data were analyzed across nine school districts in Northern California. Findings revealed a significant increase in state and local funding after implementation of LCFF for all districts. Statistical analyses showed larger districts received the greatest increases in funding and per pupil funding increases with the number of students who were eligible for Free and Reduced Lunch (FRL). While these trends were consistent both before and after the implementation of LCFF, the percent of funding spent on instruction, instruction-related services, pupil and ancillary services did not differ. Although expenditures for total revenue are tracked, there is no
statewide system for tracking supplemental and concentration fund grants and yet, districts have full flexibility on how to spend these additional dollars within the eight state priorities. The lack of transparency at the district level compromises the replicability and scalability of district practices and undermines ongoing efforts for educational reform. Furthermore, findings revealed a significant increase in graduation rates after implementation of LCFF for all students, English Learners, and students eligible for FRL.
v
ACKNOWLEDGMENTS
First and foremost I would like to express my gratitude to my family for their unconditional love and support during this journey. Specifically to the love of my life Faris, and my sons, Zahir and Amir who inspire me to be a better person every day. They are my guiding light and bring peace to my heart. I am lucky to have such caring
siblings, Cesar, Ulises, and Wendy who are strong role models to my children and are always willing to step in when needed. I am grateful for the warm and kind words of encouragement from my husband’s family. I thank my comadres for sharing tears of joy and struggle with me. I am blessed to have my mother Silvia who has instilled in me a strong work ethic, humility, and faith. Without her support, it would have been nearly impossible to finish my dissertation. I honor my late father Cruz for teaching me the importance of building trusting relationships and that quality time with loved ones is to be cherished. This dissertation is dedicated to my late abuelita Maria whose consejos, fuerza, and prayers shaped the person I am today.
I am grateful to have a space to acknowledge my advisor, Dr. Rebeca Burciaga, my dissertation committee Professor, Dr. Emily Slusser, and educational leader, Dr. Rosa E. Coronado for their guidance and encouragement to complete this dissertation. I gratefully acknowledge my colleagues in the SUHSD for their camaraderie and support. Finally, I would like to thank the “First Sixteen” cohort for being true partners in the process, for their encouragement and instilling hope that we will create dynamic educational experiences for our students as instructional leaders.
vi
TABLE OF CONTENTS
List of Tables... viii
List of Figures... ix
List of Terms and Abbreviations………. xi
Chapter 1. Addressing the Opportunity Gap... 1
Moral Imperative of Achieving Fiscal Equity... 1
Access and Equity... 3
Historical Context of School Finance Reform... 4
Current Education Finance Reform... 5
Statement of the Problem... 6
Purpose of the Study... 7
Methodology... 8
Significance of the Study... 9
Summary……… 9
Chapter 2. Literature Review... 10
School Finance Prior to the Local Control Funding Formula... 10
Serrano v. Priest 1971, 1976, 1977... 11
Senate Bill 90 (Chapter 1406, Statutes of 1972)... 12
Proposition 13 (1978)………. 12
Proposition 98 (1988)... 13
Williams Settlement (2000)... 14
Proposition 30 (2012)... 14
Proposition 55 (2016)... 14
Funding Sources Prior to the Local Control Funding Formula (1963-2013)... 15
General Purpose Funds... 15
Categorical Funds... 16
Other Local Revenue... 17
Consequences of Fiscal Policies Prior to LCFF... 18
New Funding Formula and Accountability... 19
Local Control Funding Formula... 19
Spending Restrictions... 22
Local Control Accountability Plan... 23
Summary... 29 Chapter 3. Methodology... 30 Research Questions... 30 Funding... 31 Student Demographics... 32 Student Achievement... 32 Expenditures... 33
vii Time... 33 Sample Selection... 33 Analysis... 35 Ethical Considerations... 36 Limitations... 36
Chapter 4. Results and Findings... 38
Total State Revenue Before and After Implementation of LCFF... 38
Instruction, Pupil, and Ancillary Services Expenditure Patterns... 42
Student Achievement and Funding... 45
Graduation Rates... 47
Yearly Progress in English………. 48
Summary... 49
Chapter 5. Conclusions and Recommendations... 51
Funding Levels... 51
Expenditures... 52
Fiscal Equity and Student Achievement... 54
Recommendations... 56
Direction for Future Research... 57
Summary... 58
viii LIST OF TABLES
Table 1. How LCFF is Implemented... 21 Table 2. Required Data for LCAP Priorities Areas... 26 Table 3. Size, Population, and Student Demographics of the School Districts Included
in Sample... 34 Table 4. Demographics of 9 Sample Districts, Averages for AY 2013 - AY 2016... 46
ix
LIST OF FIGURES
Figure 1. 2011-12 State provides the majority of K-12 revenues……….. 16
Figure 2. Sources of funding vary across California districts………. 19
Figure 3. Process of School District LCAP Adoption………... 27
Figure 4. County Office Review of LCAP... 28
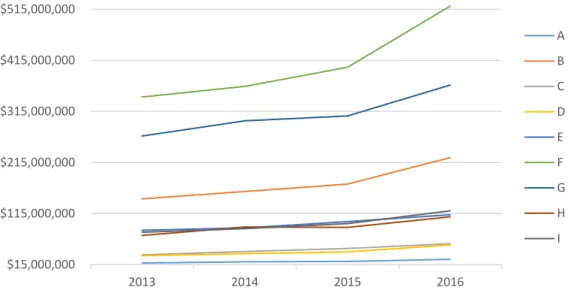
Figure 5. Nine school districts’ 4-year state and local revenue trends... 39
Figure 6. Per-Pupil State Funding AY 2013, AY 2014, AY 2015, and AY 2016... 40
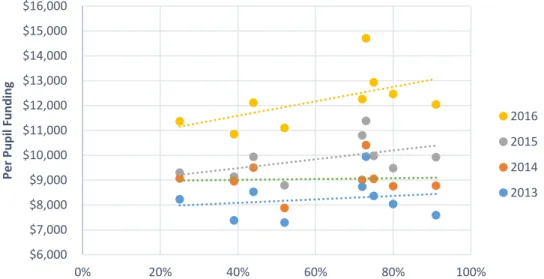
Figure 7. Four year trend of the relationship between students eligible for FRL and per pupil funding... 41
Figure 8. Four year trend of the relationship between the percentage of EL students and per pupil funding... 42
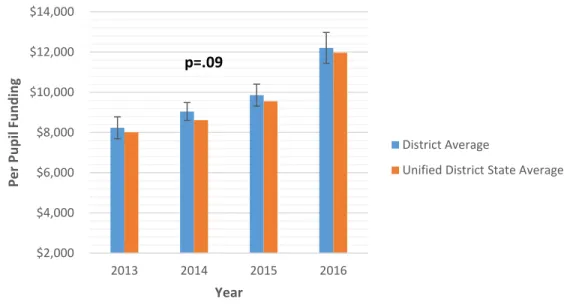
Figure 9. Per pupil funding average comparison of nine districts and state unified school districts across four years... 47
Figure 10. Comparison of average graduation rates for all students, ELs and students eligible for FRL in nine unified school districts across four years... 48
Figure 11. English Learner yearly progress as measured by the CELDT across AY 2013, 2014, and 2015... 49
x
LIST OF TERMS AND ABBREVIATIONS
American Civil Liberties Union (ACLU): An organization that works to defend individual rights and individual liberties guaranteed by the Constitution and laws of the United States.
Average Daily Attendance (ADA): A similar term as enrollment except that student attendance is taken into account. It is calculated by counting how many students are physically present on each day of attendance and dividing that number by 180 days of the school year. It is through the calculation of ADA that school districts receive state funding. Thus, school districts do not receive funding for days that students do not come to school.
Annual Measurable Achievement Objectives (AMAO 1): Annual increases in the number or percentage of English Learners making yearly progress in learning English based on the California English Language Development Test (CELDT).
Basic Aid: This term is used to describe the 6% of California school districts whose local property tax base exceeds their state revenue limit. These districts are allowed to keep the extra tax revenue, which give them significantly more funding per student than non-basic aid school districts. The majority of these districts are in the Bay Area in affluent communities. Since their tax base exceeds the revenue limit they do not receive unrestricted state aid.
Base Grant: Provides a uniform grant for each school district and charter school per unit of average daily attendance (ADA), based on the grade span of the pupils, i.e.
kindergarten through grade 3 (K–3), grades 4–6, grades 7–8 and grades 9–12.
Concentration Grant: Grant equal to 50 percent of the adjusted base grant multiplied by ADA and the percentage of targeted pupils exceeding 55 percent of a local
educational agency’s (LEA) enrollment.
Cost of Living Adjustment (COLA): An annual inflator to a base revenue amount meant to offset rising costs.
English learner (EL): This term is used to describe students who are unable to
communicate fluently or learn effectively in English, who often come from non-English-speaking homes and backgrounds, and who typically require specialized or modified instruction in both the English language and in their academic courses.
xi
Local Educational Agency (LEA): An acronym used to refer to describe school districts. This term is used to refer to describe school districts, County Offices of Education, and can also be applied to charter schools that receive funding directly from the state instead of the funding being passed through a local school district budget.
Local Income: Income realized by school district beyond the revenue limit and other state and federal sources. Local income includes parcel taxes, lease income from surplus properties, interest earned, grants, and contributions from foundations.
Restricted Revenue: Revenue federal, state, and local sources that is supplemental and designated for a specific purpose or category of student.
Revenue Limit: The amount of state guaranteed unrestricted funding a district receives. Each school district has a unique revenue limit value per student. The total allocation due to the district is calculated by multiplying its revenue limit value by last year’s ADA or the current year ADA (whichever is greater). The amount of local property tax a district receives is subtracted from this multiplied value and the difference is back filled by the state in the form of state aid.
Standardized Account Code Structures (SACS): A common system implemented statewide in 1999 to code district revenue and expenditures. The account structure consists of Fund – Resource –Year – Goal - Function – Object –Site – Management Field (a listing and description of all resources, function, and object codes are available in the appendix). Site and management fields are optional for school districts are not
downloaded to state databases.
Supplemental Grant: Grant equal to 20 percent of the adjusted base grant multiplied by ADA and the unduplicated percentage of targeted disadvantaged pupils. Targeted pupils are those classified as English learners (EL), meet income requirements to receive a free or reduced-price meal (FRPM), foster youth, or any combination of these factors
(unduplicated count).
Unrestricted Revenue: Income from revenue limit and local sources for school district general operating expenses.
Chapter 1
Addressing the Opportunity Gap
Access to equal educational opportunities is a human right (UNESCO, 2007). Yet, all too often, financial resources predetermine the quality of one’s education (Anyon, 1980). As we prepare to grapple with the latest manifestations of educational reform across the United States, we must face the reality that schools are not provided with equitable funding for every student (Rodriguez & Rolle, 2007). Despite unequal funding, students from low-income families are compared to wealthy students with over
simplistic accountability measures. Accountability reforms based on student
achievement presume that students are given adequate human and material resources to ensure a fair opportunity to achieve expected outcomes (Guiton & Oakes, 1995). As such, the term “achievement gap” is a misnomer because students who attend schools with inadequate resources are, in reality, experiencing an “opportunity gap” (Burciaga, 2016). The implication of achieving fiscal equity so as to close the opportunity gap will be explored in this study across four years (AY 2013 to 2016) of school finance reform in California.
Moral Imperative of Achieving Fiscal Equity
California’s implementation of the Local Control Funding Formula (LCFF) was
enacted to provide adequate resources for our high need students (Brown, 2013). LCFF is a weighted funding system that was implemented in all public schools during
require more resources to have the same opportunities and achieve meaningful outcomes (Affeldt, 2015). Some studies have concluded that money does not matter and that family and individual effects outweigh other factors (Hanushek, 1991, 1994, 1996). However, Ladson-Billings (2006) believes that inequities in school funding maintain the unequal outcomes for the rich and the poor. Thus, increasing educational opportunities through coherent school funding systems is part of our moral imperative to provide equitable opportunities and to achieve expected academic outcomes.
According to the gross product data from June 2016, California is one of the
wealthiest states in the nation and is the world’s sixth largest economy (Kaplan, 2015). Yet, when compared to other states, California was ranked 42nd in per-student spending in AY 2015 (Kaplan, 2015). With 6.2 million children attending school, California is one of the largest public school systems in the country (CDE, 2016). More than half of California’s students, 3.6 million, qualify for free or reduced meals (CDE, 2016). Poor students of color disproportionately tend to attend impoverished schools, while wealthier white children often attend private, charter or more affluent community public schools (Rodriguez & Jongco, 2007). The current level of learning opportunities provided to students resembles the racial and class patterns that were in place before the United States Supreme Court declared that "separate but equal" schools were "inherently unequal" in Brown v. Board of Education (López & Burciaga, 2014; Rodriguez & Jongco, 2007).
Studies have identified a clear link between educational funding and student achievement. For example, Rodriguez and Jongco (2007) found the gap in per pupil spending highly impacts teacher salaries, especially in districts with high numbers of socioeconomically disadvantaged students. The poorer the district, the larger
concentration of under-prepared teachers with emergency credentials. A lack of highly qualified teachers, rundown facilities, outdated textbooks, and low teacher salaries contribute to substandard learning conditions for socioeconomically disadvantaged students (Rodriguez & Jongco, 2007). Ladson-Billings (2010) commented that school funding not only perpetuates educational inequities, but highlights institutional racism within our schools. Poor communities of color are more likely to receive less school funding and as a result, must educate their children with inadequate human and material resources.
Access and equity. Anyon’s (1980) study concluded that schools’ practices and pedagogies are influenced by the economic and employment expectations for those students based on their parents’ socio-economic class. She explains that the schools attended by students of working class families were very structured and had little flexibility, whereas the schools with students of higher social class had less structure, sometimes not even utilizing bells. Students were given curriculum aligned to the type of work they were expecting to pursue based on their social class. For example, in the working-class schools, the majority of the work was mechanical and repetitive with little explanation or connection to a larger context. Yet, in the middle-class school, work is
the goal is to follow directions in order to get the right answers, and sometimes the directions require problem-solving, questioning, and decision-making. Although not explicitly stated this was the “hidden curriculum.” Anyon (1980) provides examples of the type of jobs students were prepared to do such as being the worker versus the owner of a company. This echoes one of Max Weber’s (1922) three components within his theory of stratification-social class is based on the economically determined
relationship to the market. For example, if one is from an affluent social class it is almost guaranteed the one is a homeowner versus a renter. The United Nations (UN) suggests that education is both a human right and an indispensable means of realizing other human rights thus the role government plays is critical in supporting reforms such as school finance to achieve an adequate education for every child.
Historical Context of School Finance Reform
Historically, local property taxes have been the major source of funding for public schools throughout the United States (Kirst, 2010). Typically, the use of property taxes was set by the local school board, other local officials, or directly by citizens. This local control led to dramatic differences in school funding, usually depending on the relative property wealth of the surrounding community. During the 1970s, the courts in many states ruled that these wealth-related differences in school support needed to be eradicated, such as in Serrano v. Priest, (1971) (Serrano I); Serrano v. Priest, 18 (1976) (Serrano II); and Serrano v. Priest, 20 (1977) (Serrano III). Senator Robert F. Kennedy was one of many who called on state governments to come up with new ways to fund
public schools more equitably. Over 40 years ago during the Elementary and Secondary Education Act hearings, Kennedy urged,
These children really don’t have a lobby speaking for them and do not have parents that can be clamoring down here because they cannot afford to take the bus ride, or cannot afford to fly down here, and they are the ones, I think, who are of concern. They have been ignored in the past. We are fighting for them and others have; but the fact is that we are just awakening to the needs in this part of the country, and what I want to make sure of is not that the money is not wasted, because you can find more money, but the fact that the lives of these children are not wasted (McLaughlin, 1975, pp. 1-2).
Kennedy’s words are reminiscent of today’s efforts towards a more equitable funding system, and can be compared to Governor Brown’s edict regarding local control. Current Education Finance Reform
Like Senator Kennedy, Governor Brown of California had similar ideals – he believed in giving parents and local educators a voice in the decision-making process for their students’ education. On July 1, 2013, Governor Brown signed the Local Control Funding Formula (LCFF), a new school finance system with the intended goal to achieve greater systemic equity, transparency, and performance through localized control of school funding allocations. California’s revenue limit formula, which had been in place for 40 years, was complex and heavily criticized for still being inequitable and inefficient (Loeb, Bryk, & Hanushek, 2008; Timar & Roza, 2010). LCFF is based on an equity premise that students with greater need require additional resources to have the same educational opportunities and to be academically successful (Affeldt, 2015). Under LCFF, California
Local Educational Agencies (LEA) have flexibility in the use of these funds, eliminating many of the categorical programs directed funds to student with identified needs.
LCFF identifies differences in student population and specifically provides additional funding for “unduplicated count of pupils” in three key subgroups: Foster Youth, English Learner or Socio-Economically Disadvantaged students. “Unduplicated count” means that each pupil is counted only once even if the pupil meets more than one of these criteria. The state applies the formula based on the districts’ reported numbers in each of the key subgroups.
While this weighted system seeks to provide districts with additional resources in proportion with higher numbers of students in key subgroups, it is unclear how funding allocations are monitored. This study will therefore explore how California is
implementing a policy that seeks to address student needs related to fiscal equity in ways that are meaningful and replicable.
Statement of the Problem
California’s revenue limit entitlement formula was inequitable and lead to inadequate human and material resources in our poorest schools, which limited educational opportunities. In contrast, the Local Control Funding Formula (LCFF) seeks to make progress towards fiscal equity. Under LCFF, California districts are primarily funded using a combination of state aid and local property taxes. The state aid differs across districts based on the student populations, allocating more to districts that have “high-need” students. Districts have full flexibility to utilize this funding and it is unclear
if districts are redistributing their funding in such a manner to help close the opportunity gap for our most marginalized students. Further, California educators pensions and retirement rates are increasing and will begin to compete for fiscal resources in the near future, thus it is imperative that discussions of how to best educate the students in the California continue through the lens of fiscal equity.
Purpose of the Study
The current study is an analysis of California’s Local Control Funding Formula before and after implementation. The purpose of this study is to compare state funding allocations and district expenditures among nine California public schools before the Local Control Funding Formula (LCFF) (AY 2013) and during the first three years of its implementation (AY 2014, 2015, and 2016) to determine the relationship between fiscal equity and student academic achievement. Prior to LCFF, the state funding formula included revenue limit entitlements for general purposes and multiple categorical programs that restricted the use of funding. The California Department of Education (CDE) provided guidelines and restriction that were tied to categorical programs – there was no flexibility in the use of this funding. This dissertation addresses the following questions:
1. How have funding levels changed in California public K-12 school districts since the implementation of LCFF?
2. How have funding expenditures changed in California public K-12 school districts since the implementation of LCFF?
3. Has LCFF achieved fiscal equity and helped close the opportunity gap? Methodology
The researcher conducted a secondary analysis of publicly accessible data with focuses on five variables: funding allocations, student populations, student achievement data, expenditures, and time. To answer the first question, a repeated measures
ANOVAs was conducted. Time (years 1, 2, 3, and 4) served as the independent variable (IV) and Total Funding Allocated (per District) served as the dependent variable (DV). These variables were used to show whether funding level patterns based on revenue limit entitlements and base grant allocations changed across each school year.
To answer the second question a repeated measures ANOVA was conducted to evaluate the amount spent (DV) across funding categories before and after the
implementation of LCFF (IVs). Interviews were also held with County Office of Education (COE) Fiscal Managers to confirm findings after reviewing financial data on the California EdData website.
To answer the third question, a correlation analyses comparing the percentage of students in the Free and Reduced Lunch program and EL students to funding allocations was conducted. It was hypothesized there would be a positive relationship between the percentage of SED and EL students (IVs) and funding allocations (DV) before and after LCFF. Further, to address whether LCFF helped to close the opportunity gap, a repeated measures ANOVA was conducted to evaluate the graduation rates (DV) and English Learner yearly progress (DV) before and after the implementation of LCFF (IV).
Significance of the Study
Few empirical studies have been conducted to date to determine the effects of the implementation of LCFF. However, recent studies were conducted on how LCFF will impact California’s new accountability system (Affeldt, 2015; Menefee-Libey & Kerchner, 2015). Furthermore, studies were also conducted on the challenges and successes of the first two years of LCFF and LCAP implementation (Humphrey, & Koppich, 2014; Koppich, Humphrey, & Marsh, 2015). This dissertation will advance the level of knowledge in the field of education finance with an empirical study designed to investigate funding levels, expenditure patterns and student achievement.
Summary
An equitable educational opportunity is guaranteed by the 14th amendment for every student in the nation. For decades, California has struggled to narrow the opportunity gap for our most socioeconomically disadvantaged students due to its complex and inequitable education finance system. Now, California is in a position to achieve fiscal equity with its adoption and implementation of the Local Control Funding Formula. The question that remains to be answered is whether the most impoverished schools will have the funding resources to positively impact the lives of 3.6 million students once LCFF is fully implemented.
Chapter 2 Literature Review
This chapter reviews policy, court cases, and research related to funding for public schools in California. It commences with a summary of school finance prior to the Local Control Funding Formula (LCFF) (1963-2013) and highlights six state policies that
influenced funding. The chapter further examines the research related to funding sources prior to LCFF, the consequences of fiscal policies prior to LCFF, and the new funding formula.
School Finance Prior to the Local Control Funding Formula
Kirst (2006) provides a synthesis of California’s finance system beginning with the 1970s when schools were funded primarily by local property taxes. In Serrano v. Priest (1971) the state Supreme Court ruled the California had to end the linkage between district assessed property value per pupil and total district spending. This landmark case addressed the funding inequities that existed in California, it struck down public-school, general-fund, financing structure as a violation of equal protection because under this system per pupil expenditures varied greatly and depended on a school district’s tax base. In 1978, voters passed Proposition 13 which drastically cut local property taxes and gave more control of all school funding policies to the state. In addition to per-pupil revenue limits, there were more than 100 state and federal categorical-aid programs (Kirst, 2006). Categorical-aid programs targeted a particular pupil population and/or program, such as English Learners or socioeconomically disadvantaged pupils. It was
not until recently that California began to consider a weighted pupil formula such as that adopted by Kentucky or Florida which adjusts funding based on pupil needs. Kirst (2006) explained that pupil weights allow for local control of programs. However, the lack of confidence the state had about local policymakers made it necessary to dictate academic interventions through specific categorical programs.
Serrano v. Priest (1971, 1976, & 1977). After Brown v. Board of Education,
reformers began to widen the scope of equal educational opportunity and began to see schools as a means to remedy social inequalities, regardless of race (Elmore &
McLaughlin, 1981). This was important because disparity in educational opportunity is manifested in differential educational outcomes (Ladson-Billings, 2013).Three landmark rulings in Serrano v. Priest (1971, 1976, & 1977), changed the trajectory of school finance for California schools. This case set the agenda for an extended legislative debate and exposed the conflicts between the courts and legislatures over school finance reform (Elmore & McLaughlin, 1981). Although, it remains unclear how this lawsuit began, what is known is John Serrano was a parent of several Los Angeles public school students who had ‘faith in education as an instrument of social equality” (Elmore & McLaughlin, 1981, p. 33). This case was litigated at the same time that a number of legal scholars were working independently to define equality of educational
opportunity.
The three Serrano rulings by the California Supreme Court concluded that California did not meet the 14th Amendment clause of the United States and the California
Constitution (1971, 1976 & 1977). Additionally, the court stated school district revenues were so reliant on local property tax revenues that the funding created large district-to-district disparities and thus denied students of an equal educational opportunity. The inequity stemmed from the vast differences in property values across the state (Timar, 2006). The court decisions was one of several that led efforts by the California
legislature and voters to restructure the school finance model.
Senate Bill 90 (Chapter 1406, Statutes of 1972). The California legislature enacted this measure in response to the first Serrano decision. It attempted to implement a strategy that would adjust districts’ revenue limits with the purpose of equalizing funding. The strategy was known as the “squeeze formula.” The lower-spending districts saw an increase in revenue limits faster than high-spending districts with the goal of closing the equity gap. This progress towards funding parity was expected to take several years. “However, before the state could equalize spending, Proposition 13 passed in 1978, drastically cutting local property taxes” (Kirst, 2006, p. 3).
Proposition 13 (1978). Officially named the “People's Initiative to Limit Property Taxation,” Proposition 13 was an amendment of the Constitution of California approved by voters. The initiative “create[d] a uniform statewide property tax of one percent” and limited increases in property taxes to 2% per year and rolled back property assessments to their 1975-76 levels (Weston, 2013, p. 1). The initiative had a near immediate effect, prior to the passage of Proposition 13 in 1978, California schools had a $9 billion budget. After the passage of Proposition 13, schools lost $3 billion overnight. The combination
of per-pupil revenue limits and Proposition 13 hindered districts’ abilities to raise money locally for public education, requiring schools to rely on Sacramento as their main
source of funding (Kirst, 2006). California’s education finance system became one of the most centralized systems in the country (Kirst, 2006; Timar, 1994).
Proposition 13 was the result of voter frustration with the legislature’s inability to provide property tax-relief (Elmore & McLaughlin, 1981). This proposition shifted the focus of fiscal equity away from students (Serrano v. Priest) to the taxpayers. School governance and finance now had to depend on the state to fund public education. It created a competitive structure for all social services in the state (including education, police, nursing, and fire departments) and all other local government services were in competition for a portion of the state’s general fund (Elmore & McLaughlin, 1981). Ten years later in 1988, there a shift to equalize funding with Proposition 98.
Proposition 98 (1988). Proposition 98 established a guaranteed minimum funding level from property and state taxes for K-12 education each year, calculated by applying three “tests” according to the state's economic and fiscal conditions. “Proposition 98 states that K-12 education shall receive the greater of a fixed percentage of state General Fund revenues (Test 1) or the amount they received in the prior year, adjusted for enrollment and inflation (Tests 2 and 3)” (California Budget Project, 2006, p.3). Equal does not necessarily mean equitable resources across districts. Parents once again advocated on behalf of their children to bring attention to student needs.
Williams Settlement (2000). On May 17, 2000, the Williams v. California lawsuit was filed to ensure equitable educational opportunities across the state. Eliezer Williams, a middle school student in San Francisco, and his father were frustrated by the
inadequate teachers, textbooks and facilities. They decided to pursue a lawsuit with the support of Public Advocates and American Civil Liberties Union (ACLU) among others (Rodriguez & Jongco, 2007). The lawsuit culminated in a settlement agreement between the plaintiffs and the California Department of Education. The Williams Settlement guarantees California students the basic educational necessities: qualified teachers, adequate textbooks, and clean, safe, and functional school facilities.
Proposition 30 (2012). Upon its passage, Proposition 30 temporarily increased the state’s sales tax and the income tax for higher earning households, creating an influx of additional funding for schools. The increased sales tax was set to expire in 2016. The increased income tax for households earning more than $250,000 impacted the top 3% of California taxpayers and was set to expire in 2018 (California Budget Project, 2012). This proposition was important because it stabilized school funding since the great recession began and helped districts attain financial stability.
Proposition 55 (2016). The California Children’s Education and Health Care
Protection Act of 2016 extended Proposition 30 personal income tax rate increases from 2019 through 2030. Most of California’s K-12 funding is provided by the Prop. 98
minimum funding guarantee, discussed earlier in this chapter. This guarantee is based on varying economic and fiscal conditions, including state General Fund revenue
collections. All else being equal, General Fund revenues from 2018-2019 to 2030-2031 is expected to be higher with Prop. 55(California Budget Project, 2016). The fiscal impact of this proposition is that it increases funding for districts of roughly half of the revenue raised by the measure.
Funding Sources Prior to the Local Control Funding Formula (1963-2013)
California’s finance system did and does consists of state, local, and federal sources. State revenues are collected from personal income tax, sales tax, corporate tax, state lottery revenue, and state bond funding for facilities (Timar, 2006). Local sources include property taxes, contributions, timber tax, interest income, developer fees, other fees, and local bond funding (Timar, 2006). During this forty year period, revenue sources to school districts comprised general purpose funding, categorical, and other local funding.
General purpose funds. General purpose funding included a combination of base revenue limit, revenue limit add-ons, and excess local property taxes (Timar, 2006). The base revenue limit was the amount of general purpose funding per Average Daily Attendance (ADA) that a district received in state aid and local property taxes. This was the largest component of the school funding formula, comprising about 95% of the total General Purpose funding as shown in Figure 1. Every district’s base revenue limit was unique because it was calculated by adding its 1972-1973 state aid allocation and schools’ share of local property tax revenues, then dividing the sum by its ADA (Timar,
2006). All districts’ revenue limits were readjusted after Proposition 13, which negatively impacted public school funding.
Figure 1. 2011-12 State provides the majority of K-12 revenues.
Adapted from the California Department of Education Finance and Grants
Categorical funds. Another component of California’s pre-LCFF public education finance system was categorical funds that were restricted such that could only be used for a specific student population or program (California Department of Education, 2014b). Categorical funding began in the 1960s “as state legislators reacted to political pressure to address the needs of disadvantaged children and signaled their lack of confidence in local educators to do so successfully” (Bersin, Kirst, & Liu, 2008, p. 2). By the 1980s, the legislature had increased categorical programs to about 13% of total K-12 funding, which represented a six-fold increase since its inception (Timar, 2006).
According to Kirst (2006), categorical funding was a mechanism used by politicians to prevent increases in state aid from being spent on increases to teachers’ salaries.
55% 1% 11% 33% State Lottery Federal Local
In 2008-2009, restrictions were removed from 40 of the 60 state categorical
programs. Categorical flexibility was adopted as part of the 2007-2008 budget where all categorical programs were assigned to one of three tiers (Imazeki, 2012). Tier 1
programs were left largely intact; funding was not cut and no flexibility was granted. Similarly, no flexibility was granted for Tier 2 programs, however, they experienced some reductions in funding. Local Educational Agencies (LEAs) were given complete flexibility when expending funding for Tier 3 (Imazeki, 2012).
Categorical funds were not equitably allocated across districts and they were not systematically allocated to districts on the basis of students’ need, even though districts serving greater proportions of low-income students generally received more categorical funding than other districts (Loeb et al., 2008; Timar, 1994; Timar & Roza, 2010). Even so there was substantial variation in categorical funding for districts with similar populations (Weston, 2011). Duncombe and Yinger (2006) also found categorical funding in California to be inefficient because the extent of categorical funding was negatively correlated with districts’ abilities to improve student achievement.
Other local revenue. Other local revenue included in California’s finance system prior to LCFF included parcel taxes, reimbursements, and donations, leases, transfers, fees, and other sources of local revenue. Generally speaking, these types of revenues were limited and did not generate much funding for school districts (Timar, 2006).
Consequences of Fiscal Policies Prior to LCFF
Efforts to achieve fiscal equity before LCFF failed to establish a foundation formula that would lead to adequate student performance in every district (Duncombe & Yinger, 2006). Loeb and colleagues (2007) stated California’s education finance system has revenue fluctuations that impact long-term planning and decision-making because of its macroeconomic trends. Any sustained improvement efforts were more likely in a predictable policy environment that encouraged rational decision making and long-term capacity building (Brewer & Smith, 2008). California’s fiscal structure led to historic equalization as a goal without regard for adequacy or academic standards (Kirst, 2006).
At times, the lens by which policymakers create laws are based on their perceptions. These perceptions are based on how constituents will respond to the feasibility of
various policy options. This perceptual screen is labeled “the assumptive worlds of policymakers” (Marshall, Mitchell, & Wirt, 1989). This perceptual screen is also influenced by California voters, who are disproportionately older, whiter, wealthier, better educated, and homeowners. Nonvoters are younger, ethnically diverse, low socio-economically disadvantaged, less educated and are typically renters (as cited in Kirst, 2006). Kirst (2006) highlighted the need for an overhaul of the state public finance and “the first step must be to throw the current system out and not try to patch it” (p. 23). He further stated that there was a need for a more coherent finance system that must to be in alignment with local policies.
Many studies have found California’s school finance system inequitable, with wide variation in per-pupil funding (Duncombe & Yinger, 2006; Loeb, et. all, 2007; Kirst, 2006) The system is governed by such a complex array of laws and formulas that only a few experts understand it (see Figure 2).
Figure 2. Sources of funding vary across California districts.
Adapted from Education Data Partnership, 2012-13 District Finance Reports
New Funding Formula and Accountability
The Local Control Funding Formula (LCFF) was based on the premise that local decisions drive funding allocations with oversight by county office of education (COE) officials. The following section addresses the new formula as well as the Local Control Accountability Plan (LCAP).
Local control funding formula. Governor Brown signed the Local Control Funding Formula bill on July 1, 2013, with the intent to bring “government closer to the people, to the classroom where real decision are made and directing the money where the need
$2,000 $4,000 $6,000 $8,000 $10,000 $12,000 $14,000 $16,000 $18,000 Per -Pu p il re ve n u e District
ADA Other Local Revenue ADA Other State Revenue ADA Federal Revenue ADA Revenue Limit Sources
and the challenge is greatest” (Office of Governor Edmund G. Brown Jr., 2013, p. 1). This law replaced a complex and inequitable finance system that had been in place for 40 years. This new weighted funding formula was based on an equity premise that students with greater need require additional resources to have the same educational opportunities to be academically successful (Affeldt, 2015). The formula includes a per-pupil base grant, a supplemental grant based upon the number of unduplicated
students who are low income, English learner (EL), and foster youth, and a
concentration grant for districts with over 55% of this targeted population (Taylor, 2013).
Base grants, which represent the bulk of the funding, are allocated according to districts’ average daily attendance in four grade spans (K-3, 4-6, 7-8, and 9-12), and are updated for cost-of living adjustments (Taylor, 2013). The LCFF also made base rate adjustment in K-3 and high school grades. The K-3 adjustment increased funding by 10.4% with the intent to cover costs associated with class size reduction (CSR) (Taylor, 2013). The high school adjustment was not tied to any particular service, however, the adjustment was originally related to the costs of providing career technical education (CTE) in high school. In addition to the base grant, districts received a supplemental grant which is an additional 20% of the grade-span base rate according to the number of ELs, foster youth, or students eligible for free and reduced lunch (California Department of Education, 2016). However, this formula was based on an unduplicated student count so a district receives a maximum adjustment of 20% above the grade-span base
for any one student, even if the student fell into all three subgroup categories (California Department of Education, 2016). For example, an EL, foster youth student counts once in this formula. Districts receive the concentration grant if they have a subgroup above 55%. For each student in that subgroup above the 55%, the district received an
additional 50% of the grade-span base grant (California Department of Education, 2016). However, a charter school could not receive funding for a greater proportion of the targeted students than the district in which it resides (Taylor, 2013). See Table 1.
Table 1 LCFF Implementation Example Student Base K-3 Ratio K-3 Adjustment EL/LI Supplement EL/LI Concentration Total English Learner (EL) /
Low Income (LI)
$ 7,000 $ 500 $ 1,500 - $ 9,000
El/LI $ 7,000 $ 500 $ 1,500 $ 4,000 $ 11,000
Non-EL/LI $ 7,000 $ 500 - - $ 7,500
Adapted from California’s Legislative Analyst’s Office
About 15% of districts will not benefit from the new formula as they fall in one of three categories: basic aid districts, non-isolated single-school districts, and anomalous districts (Taylor, 2013). Basic aid districts compromise about one in nine of the state’s nearly 1,000 districts, but this number varies from year to year. They did not receive additional state funding because they received more funding from local property taxes than they would from the LCFF, however they still had to comply with the state’s new accountability requirements (EdSource, 2016). Non-isolated, single-school districts and
anomalous districts will remain at their AY 2013 funding levels until their revenue amounts dropped below their LCFF targets.
The goal was for LCFF to be fully funded by 2020-21 school year. The legislature defined “fully funded” as the end of the transition from the old revenue system to the new base funding per student, which must be uniform, and the proportion of high-needs students in a district would determine its additional funding (EdSource, 2016). Each year the base grant will change so as to accommodate Cost of Living Adjustments (COLAs), fluctuations in Average Daily Attendance (ADA) and student demographics, and increases in property tax revenue (Taylor, 2013). Over the course of the eight year transition, additional LCFF funding will be allocated based on the funding “gap.” The “gap” is the difference between their prior-year funding level and their target LCFF funding level. Theoretically, every district would see the same proportion of their gap closed, but the funding they receive depends on the size of their gap (Taylor, 2013). Although the gap has closed faster than expected in the first three years of
implementation, it was expected to slow after AY 2017 due to the phased-in expiration of Proposition 30 taxes (EdSource, 2016).
Spending restrictions. Although the majority of categorical programs were eliminated under LCFF, there were 14 programs remaining. One of the fiscal equity measures of LCFF was that local educational agencies must “increase or improve services for [high need] pupils in proportion to the increase in funds” specifically supplemental and concentration funds (California Education Code, 2013a). The statute
further stated these funds be no more restrictive than similar federal Title I
requirements. In an effort to ensure that districts were spending the weighted funding on serving high need students, Cal. Educ. Regs. Tit. 5, 15496 et seq, mandates that districts justify expenditures as “effective” towards meeting the needs of the targeted students. The State Board of Education did not require districts to list expenditures for high-need students and this was a point of contention for advocacy groups and some legislators who wanted detailed accounting to ensure monies were spent on the pupils who generated the funding (EdSource, 2016). However, the State Board insisted the focus should be on actions to improve and increase services in proportion to the funding received, and not on the expenditures themselves. (EdSource, 2016).
Local control accountability plan. Not only did legislature require a complete overhaul of a four decade education finance system that shifted control over budget and policy from the State to local school boards, it also established a set of new rules for district transparency and accountability (EdSource, 2016). Affeldt (2015) asserted LCFF was not solely a school finance reform, but it was paving the way for a new state
accountability system. Districts are now required to adopt a Local Control Accountability Plan (LCAP). Districts were required to complete the LCAP template for the first time in AY 2015, one year after LCFF was implemented (Taylor, 2013). Since then, the California Department of Education modified the template, but the requirements remain the same.
The LCAP template is organized in three sections: stakeholder engagement, goals, and actions and services. In the first section, district officials provided a description of stakeholder engagement and the impact it had on the LCAP. The stakeholders must include teachers, principals, administrators, other school personnel, local bargaining units, parents, and pupils (California Education Code, 2013b). Furthermore, districts had to present their proposed plans to a parent advisory committee that included parents of targeted student subgroups and, in some cases, a separate EL parent advisory
committee when at least 15% of students and at least 50 pupils in the district were ELs (California County Superintendents Educational Services Association, 2014).
The advisory committees provided recommendations after they had an opportunity to review multiple data points such as student achievement (Taylor, 2013). Districts are then required to respond to written comments of the advisory committee. Finally, districts were also required to inform the public that they may submit written
comments regarding the specific actions and expenditures in the LCAP (Taylor, 2013). Superintendents were not required, however, to adopt the committees’
recommendations, but they had to respond in writing to the recommendations before the LCAP was approved (California Department of Education, 2016). According to Affeldt (2015), “California is helping to model the importance of community
engagement in local programs and decision-making as a key component of the new accountability” (p. 7).
In the second section of the LCAP, district officials set annual goals and determined how they would spend their monies to achieve those locally-derived goals. There were 24 metrics within eight state priority areas that must be addressed including: basic services, course access, implementation of state standards, parent involvement, pupil achievement, pupil engagement, and school climate among other pupil outcomes, see Table 2 (California Education Code, 2013a). District officials also identify the schools and the targeted student subgroups for which the goals were applicable and then determine measurable metrics by which to evaluate their progress toward meeting those goals (California County Superintendents Educational Services Association, 2014). Finally, districts were required to assess the progress they were making on the
indicators they selected to determine if they are meeting their goals for the baseline year (AY 2015) as well as for the following two years, see Table 2 (State Board of Education, 2013).
Table 2
Required Data for LCAP Priorities Areas
Priority Area Required Data
Basic Services Rate of teacher misassignment
Student access to learning materials that support academic standards
Information about school facilities Implementation of Common Core State
Standards (CCSS)
Implementation of new CCSS for all students
Course Access Student access and enrollment in all required areas of study
Student Achievement Performance on standardized tests
Share of students that are college and career ready Share of students that are college and career ready Share of English Learners that become English proficient Rate of English Learner students who are reclassified as English proficient
Share of students that pass Advanced Placement (AP) exams with score of 3 or higher
Share of students determined prepared for college by the Early Assessment Program (EAP)
Parent Involvement Information around school district efforts to seek parent input
Information around how school district promoted or advertised parental participation
Student Engagement School attendance rates Chronic absenteeism rates Middle school dropout rates High school dropout rates High school graduation rates
School Climate Student suspension rates
Student expulsion rates Other local measures Updated from California’s Legislative Analyst’s Office
In the final section of the LCAP, district officials were required to explicitly state what actions and services they were providing for all students, as well as the targeted student subgroups, in order to meet their goals (State Board of Education, 2013). Districts must also update the expenditures related to the actions and services for all
students, and for the targeted students every year (State Board of Education, 2013). However, districts did not have to list expenditures for high-need students (EdSource, 2016). Once the LCAP was adopted by the local school board, it was effective for three years and each year there had to be an annual update that included the effectiveness of the actions and services toward meeting their goals (Taylor, 2013). The school district LCAP adoption process is illustrated in Figure 3. If districts followed this process, they “should be designing, robust, community-owned LCAPs that lay out how educator and school capacity will be supported and enhanced by strategic and equitable allocation of resources to deliver deep and meaningful learning” (Affeldt, 2015, p. 7). Once the district adopts the LCAP, then it was submitted to the County Office of Education (COE) for approval.
Figure 3. Process of School District LCAP Adoption
Develop proposed plan
Solicit recommendations and comments from the
public in hearing Present proposed plan to parent advisory committees
for review and comment Solicit written comment on
proposed plan from public
Respond in writing to comment of parent advisory committees
Adopt plan in public hearing
Consult with school employees, local bargaining units, parents, and students
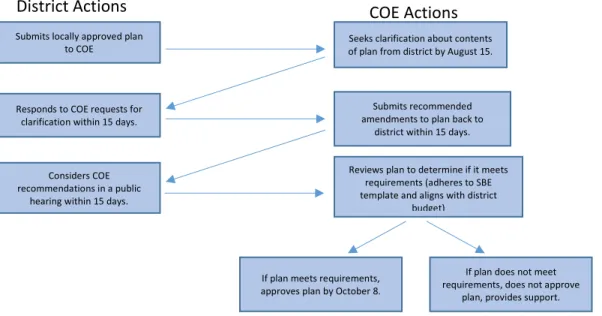
Within five days of the LCAP adoption, a district had to submit its plan to its COE for review to ensure that each district’s LCAP met the requirements for the plan set by the State Board of Education and Legislature, and that the district’s budget reflects the plan’s goals (EdSource, 2016). The process of COE review is displayed in Figure 4 (Taylor, 2013). The county engaged in a multi-step review as required by California Education Code 52070 that could lead to several revisions:
● “The district must send the plan to the county superintendent within five days of adopting it.
● The county superintendent has until Aug. 15 to seek clarification about the plan.
● The district governing board then has 15 days to respond to the county superintendent’s request for clarification.
● The county superintendent has another 15 days to submit recommendations for amendments to the plan.
● The district must consider those recommendations at a meeting of the school board.
● The county can either approve the plan by Oct. 8 each year or reject it for failing to comply with state requirements and work with the district to improve it (EdSource, 2016).”
Figure 4. County Office Review of LCAP
Summary
Due to the complexity of California’s funding model, the literature review focused primarily on the court cases (Sierra v. Priest) and policies (propositions 13, 98, and 50) that have shaped California’s finance model. Having a general understanding of the historical context provides a backdrop to the Local Control Funding Formula (LCFF), California’s current funding model. This empirical study is designed to advance
knowledge about district funding levels, expenditure patterns and student achievement in the era of LCFF.
Submits locally approved plan
to COE of plan from district by August 15. Seeks clarification about contents
Responds to COE requests for clarification within 15 days.
Submits recommended amendments to plan back to
district within 15 days.
Reviews plan to determine if it meets requirements (adheres to SBE template and aligns with district
budget)
District Actions COE Actions
Considers COE recommendations in a public
hearing within 15 days.
If plan meets requirements, approves plan by October 8.
If plan does not meet requirements, does not approve
Chapter 3 Methodology
The purpose of this research was to compare district funding levels and expenditures among nine California public K-12 school districts before the
implementation of Local Control Funding Formula (LCFF) and during the first three years of implementation (AY 2014, AY 2015, and AY 2016) to determine if LCFF has begun to address fiscal inequities across districts and help close opportunity gaps. Prior to LCFF, the state funding formula included revenue limit entitlements for general purposes and multiple categorical programs that restricted the use of funding were dictated by the state. The revenue limits placed the focus on equalizing resources across districts without regard for their differences in student populations or providing adequate education (Kirst, 2006). The funding formula, which had been in place for 40 years, was complex and heavily criticized for being inequitable, inefficient, and inadequate (Loeb et al., 2008; Timar & Roza, 2010).
Research Questions
The researcher conducted a secondary analysis of publicly accessible data (including measures of funding, student demographics, student achievement data, expenditures, and time) to address the following questions:
1. How have the funding levels changed in California public K-12 school districts since the implementation of LCFF?
2. How have funding expenditures changed in California public K-12 school districts since the implementation of LCFF?
3. Has LCFF achieved fiscal equity and helped close the opportunity gap? Funding. Measures of funding include dollar amounts allocated to revenue limit entitlement, state categorical funding, base, and supplemental and concentration grants. The revenue limit formula prior to LCFF was based on a per pupil dollar amount, multiplied by the number of pupils enrolled in a district. The calculation was based on average daily attendance (ADA) and funded by local property taxes and state aid (Weston, 2010). State categorical funding targeted a particular program, such as K-3 class size reduction or student populations, such as English Learners. This funding had restrictions on how it could be spent, for example Economic Impact Aid could only be used to increase English Learner academic achievement, and it could not be used on infrastructure or administrative costs (Weston, 2011).
The base grant provided a uniform grant for each school district per unit of ADA, based on the grade span of the pupils (i.e., K-3, grades 4-6, 7-8, and 9-12). The
supplemental grant equaled 20% of the adjusted base grant multiplied by ADA and the unduplicated percentage of targeted disadvantaged pupils. Target pupils were those who were classified as English learners (EL), met income requirements to receive a free or reduced-price meal (FRPM), were identified as foster youth, or met any combination of those factors (unduplicated count). The concentration grant equaled 50% of the
adjusted base grant multiplied by ADA and the percentage of targeted pupil exceeding 55% of district’s enrollment.
Student demographics. LCFF seeks to address the needs of ELs and
socioeconomically disadvantaged students (SED) students, therefore variables of interest include the percentage of English Learners (ELs) and percentage of socioeconomically disadvantaged students in each district. English Learners were identified based on the parent response to a home language survey and an initial administration of the California English Language Development Test (CELDT) which assesses the child’s English language proficiency. Socioeconomically disadvantaged (SED) students were identified based on income requirements to receive a free or reduced-price meal.
Student achievement. California’s new accountability system includes four indicators to measure district and school success with performance standards that include readiness for college and careers, graduation rates, progress of English Learners, and suspension rates. Additionally, the data is disaggregated by significant subgroups. A significant subgroup is determined if there are 30 or more students that fall into a category by race, ethnicity, or program. In this study, student achievement was measured by graduation rates and English Learner progress. English Learner progress was measured by a students’ performance on the California English Language
Development Test (CELDT). The results were reported as annual measurable
cohort using the state’s California Longitudinal Pupil Achievement Data System (CALPADS) (CDE, 2016).
Expenditures. Expenditures were measured according to the Standardized Account Code Structure (SACS), which included resource, object, and function fields. The
resource field tracked activities that had financial reporting requirements (e.g., class size reduction) and restrictions on how funds could be spent. The object field classified expenditures according to types of items purchased or services obtained. The function field designated a general operational area and/or type of activity that was taking place, such as instruction (CDE, 2016). Function fields were divided into the following nine categories of activities: instruction, instruction-related services, pupil services, ancillary services, community services, enterprise, general administration, plant services, and other outgo.
Time. So as to measure changes in the levels of funding and expenditures before and after the implementation of LCFF, the researcher explored data from AY 2013 (before the implementation of LCFF) and AY 2014, 2015, and 2016 (representing the first three years of LCFF implementation).
Sample Selection
The California public school system consists of 946 public school districts. Many of these districts (n = 344) are unified and serve students in grades K-12. Private and charter schools were not part of the study as they do not rely on local property wealth. Examining the effect of the Local Control Funding Formula on California public school
fiscal equity, the researcher evaluated the degree to which school funding changed among nine unified school districts (K-12) from four different counties in the state of California. The districts were selected based on the availability of public data and stratified based on their size. The sample districts are a representative sample of districts across California. They include rural, suburban and urban districts with varying student demographics. Three of the selected districts were considered large, serving over 20,000 students; three were considered medium, serving between 6,000 and 20,000 students; and three were considered small, serving fewer than 6,000 students. See Table 3.
Table 3
Size, Population, and Student Demographics of the School Districts Included in Sample
County District Size Percentage of
English Learners
Percentage of SED students
Urban OUSD Large 32% 76%
Urban and Rural MPUSD Medium 31% 68%
NMCSD Small 45% 82%
SUSD Small 43% 77%
Urban GILUSD Medium 24% 59%
SJUSD Large 22% 47%
SCUSD Medium 25% 68%
Urban and Rural PVUSD Large 48% 76%
SLVUSD Small 2% 18%
Note: Large = greater than 20,000; medium = fewer than 20,000 and greater than 6,000; small = fewer than 6,000. Data retrieved from the 2015-16 school year.
Analysis
To address the first research question, “How have funding levels changed in California public K-12 school districts since the implementation of LCFF?” a repeated measures ANOVA was conducted. Time (years 1, 2, 3, and 4) served as the independent variable (IV) and Total Funding Allocated (per District) served as the dependent variable (DV). This analysis was used to show whether funding level patterns based on revenue limit entitlements and base grant allocations changed across each school year.
To address the second research question, “How have funding expenditures changed in California public K-12 school districts since the implementation of LCFF?” a repeated measures ANOVA was conducted to evaluate the amount spent (DV) across funding categories (IV) before and after the implementation of LCFF. Time as measured in years served as the repeated measure. Interviews were also conducted with finance managers for two county offices of education.
To address the third research question, “How has LCFF achieved fiscal equity and helped close the opportunity gap?” a correlation analyses comparing the percentage of students in the Free and Reduced Lunch program and EL students to funding allocations was conducted. It was hypothesized there would be a positive relationship between the percentage of SED and EL students (IVs) and funding allocations (DV) before and after LCFF. Further, to address whether LCFF helped to close the opportunity gap, a repeated measures ANOVA was conducted to evaluate the graduation rates (DV) and English
Learner yearly progress (DV) across four years (IV) before and after the implementation of LCFF.
Ethical Considerations
This study conformed to ethical standards in conducting research. All of the data used within this study is public information available at www.ed-data.org. This
researcher, in conjunction with a university advisor, reviewed all methods applied in this study to ensure ethical standards were met.
Limitations
The size of this study included nine public K-12 school districts within California and the financial scope of the study was limited to revenue limit entitlements. This study included two student achievement measures; graduation rates and annual progress for English Learners as measured by the California English Language Development Test (CELDT). Further, it was difficult to attribute any student outcome to one variable, such as a funding formula. Another limitation was the reliance on district level data as the unit of analysis. District level measures did not provide sufficient detail to expose how funding was distributed to different schools and to different students within those schools. The study contained no data on individual schools and did not attempt to investigate whether resources were equitably distributed internally by a school district. School site level data was available, but most key financial decisions were made at the central office level or were mandated by collective bargaining agreements, thereby, vastly limiting the degree of discretionary decision-making by individual sites.
Additionally, a major focus of this study was on school district revenue, which was allocated by the state to districts, not school sites.
Chapter 4 Results and Findings
The results and findings of this study are discussed in this chapter. Each research question is identified individually with statistical and qualitative data as appropriate. Four steps were taken to evaluate district funding levels and expenditures to determine if there were any changes across the four years; evaluation of district funding,
expenditures, analysis of per pupil funding, and an investigation about whether a relationship exists between funding and student achievement.
The first step was to evaluate the district allocation per year to show whether district funding levels changed during the first three years of LCFF implementation. The second step was to evaluate expenditure per year to determine if there were any changes across the four years within four categories of activities: instruction, instruction-related services, pupil services, and ancillary services. The third step included an analysis of per pupil funding based on the percentage of students eligible for Free and Reduced Lunch (FRL) and EL students to investigate if there was a
relationship between the percentages and funding levels before and after LCFF. Finally, the researcher examined per pupil funding to investigate if there was a relationship to graduation rates and progress towards English proficiency rates (AMAO1).
Total State Revenue Before and After Implementation of LCFF
To address the first research question, “How have funding levels changed in