Transfer mispricing in Finland:
evidence using export data
Santtu Kerko
Master’s Thesis
University of Helsinki
Faculty of Social Sciences
Economics
Faculty
Faculty of Social Sciences
Department
Department of Political and Economic Studies Author
Santtu Ilari Kerko Title
Transfer Mispricing in Finland: Evidence Using Export Data Subject
Economics Level
Master’s Thesis
Month and year June 2020
Number of pages 59 + 3
Abstract
When dependent firms trade with one another, no usual market incentives apply to the pricing decision. Prices determined in such a case are called transfer prices. Global differences in corporate tax rates encourage multinational enterprises to manipulate their transfer prices to shift profits to avoid taxes. It is estimated that one third to over half of global trade value is between related parties, making potential tax gains large from transfer mispricing. Literature has proposed transfer mispricing to be one of the major channels for international profit shifting.
This thesis examines whether transfer mispricing can be found in export prices of Finnish multinational enterprises. The data set is obtained by merging Finnish Customs data on International Trade in Goods in 2014-2017 and Statistics Finland Enterprise Group Register. By combining the two data sets, information on export prices on firm, product and destination level are tagged with information on dependencies in the destination country. This allows comparing intra-firm trade prices with independent trade prices.
The model used to distinguish transfer mispricing is a fixed effects difference-in-differences regression, where differences in independent and dependent export prices are compared in their response to destination tax differences. Information on firm, product, export date and destination characteristics are used to control for differences between independent and dependent trade prices that are not explained by tax motivations.
The results provide evidence of transfer mispricing in magnitude comparable to the previous research. A 10 percent decrease in destination tax rate is estimated to lead to 1.2 percent decrease in intra-firm export prices of Finnish multinational enterprises. This implies 0.8 billion euros of underreported exports in 2017, totaling 160 million euros of corporate tax losses. These results are questioned by using a more robust method than applied in previous empirical literature. According to the more conservative estimates, the main evidence of transfer mispricing loses statistical significance.
The results give broad confidence intervals for transfer mispricing of Finnish multinational enterprises, which do not cancel out either large-scale profit shifting or nonexistent price manipulation. They encourage further research on the subject exploiting more detailed data on transaction level dependencies. In addition, the role of foreign affiliates in transfer mispricing calls for more detailed data.
Keywords
Transfer pricing, profit shifting, international trade, multinational enterprises, economic geography, corporate taxation Where deposited
Tiedekunta
Valtiotieteellinen tiedekunta
Laitos
Politiikan ja talouden tutkimuksen laitos Tekijä
Santtu Ilari Kerko Työn nimi
Siirtohinnoittelu Suomessa: tutkimusaineistona tavaravientihinnat Oppiaine Taloustiede Työn laji Maisterintutkielma Aika Kesäkuu 2020 Sivumäärä 59 + 3 Tiivistelmä
Konsernien sisäisen kaupan hinnoittelu ei noudata tavanomaisia markkinaehtoisen kaupankäynnin kannustimia. Tällaista toisiinsa riippuvuussuhteessa olevien osapuolten kaupan hinnoittelua kutsutaan siirtohinnoitteluksi. Valtioidenväliset erot
yhteisöverotuksessa kannustavat monikansallisia konserneja manipuloimaan siirtohintojaan veroja vältelläkseen. Koska konsernien sisäisen kaupan arvon on arvioitu kattavan kolmasosan tai jopa yli puolet maailmankaupan arvosta, siirtohinnoittelu muodostaa merkittävän kanavan voitonsiirrolle alemman verotuksen maihin. On arvioitu, että siirtohinnoittelu on suurimpia voitonsiirtokanavia globaalissa taloudessa.
Tässä tutkielmassa on selvitetty, esiintyykö siirtohinnoittelua suomalaisten monikansallisten yritysten vientihinnoissa. Aineistona käytettiin Tullin tavaravientiaineistoja vuosilta 2014-2017 yhdistettynä Tilastokeskuksen konsernirekisteriaineistoon. Nämä kaksi aineistoa yhdistämällä saatiin selville, milloin vienti yrityksen, tuotteen, vientimaan ja vientikuukauden tarkkuudella kohdistuu maahan, jossa viejällä on tytäryhtiöitä. Tämä mahdollisti siirtohintojen vertaamisen vastaaviin markkinahintoihin.
Mallina tutkimuksessa on käytetty difference-in-differences-regressiota kiinteillä vaikutuksilla. Mallissa verrataan siirtohintojen ja markkinahintojen eroja siinä, miten ne reagoivat veroasteen muutokseen viennin kohdemaassa samalla kontrolloiden muilla vientimaan ominaisuuksilla sekä yritysten, tuotetyyppien ja vientiajankohtien kiinteillä vaikutuksilla.
Tulokset antavat samansuuntaisia arvioita veromotivoituneesta siirtohinnoittelusta kuin aikaisemmat tutkimukset. Kymmenen prosentin laskun kohdemaan veroasteessa arvioidaan johtavan 1,2 prosentin laskuun suomalaisten monikansallisten yritysten siirtohinnoissa. Tämä tarkoittaa, että Suomen viennin kokonaisarvosta vuonna 2017 uupuu 0,8 miljardia euroa siirtohinnoittelun vuoksi, mikä vastaa 160 miljoonaa euroa keräämättömiä yhteisöveroja. Tulokset eivät ole kuitenkaan tilastollisesti merkitseviä, kun menetelmässä poiketaan aikaisemman kirjallisuuden suosimasta mallista ja hyödynnetään tilastollisesti konservatiivisempaa tapaa parametrien estimoinnissa.
Tulokset antavat viitteitä suomalaiskonsernien siirtohinnoittelusta, mutta laajojen luottamusvälien vuoksi ei mahdollisuutta siirtohinnoittelun olemattomaan rooliin verovälttelyssä eikä toisaalta sen laajamittaista hyödyntämistä voida kumota.
Tulevaisuudessa tarkempia arvioita voidaan saavuttaa yksityiskohtaisemmalla tiedolla kauppatapahtumien riippuvuussuhteista. Myös ulkomaisten konsernien siirtohintojen tutkiminen edellyttää tarkempaa tietoa kaikkien Suomessa toimivien yritysten ulkomaankaupan riippuvuussuhteista.
Avainsanat
Siirtohinnat, siirtohinnoittelu, veronkierto, kansainvälinen kauppa, kansainväliset yritykset, konsernit, talousmaantiede, verotus Säilytyspaikka
Contents
1 Introduction 1
2 Theory and Literature 5
2.1 Transfer pricing as opposed to market pricing . . . 5
2.1.1 International case with differing corporate income taxes 6 2.1.2 Cost component of transfer mispricing . . . 7
2.1.3 Problems in the arm’s-length principle . . . 9
2.2 Empirical studies . . . 10
2.2.1 The basic model for analyzing transfer pricing . . . 11
2.2.2 The triple-difference method . . . 13
2.2.3 Recent developments in methods and further results . . 14
2.2.4 Effects on economic measures . . . 16
2.2.5 Transfer price regulation and its possible pitfalls . . . . 17
3 Finnish Institutions 19 4 Data 22 4.1 Export data and data on firm dependencies . . . 22
4.2 Country-specific variables . . . 24
4.3 Data set description . . . 25
5 Empirical methods 29 5.1 Difference-in-differences regression with fixed effects . . . 29
5.2 Controlling for arm’s-length price manipulation . . . 32
5.3 Standard error clustering and additional models . . . 33
5.4 Implementing the analysis . . . 34
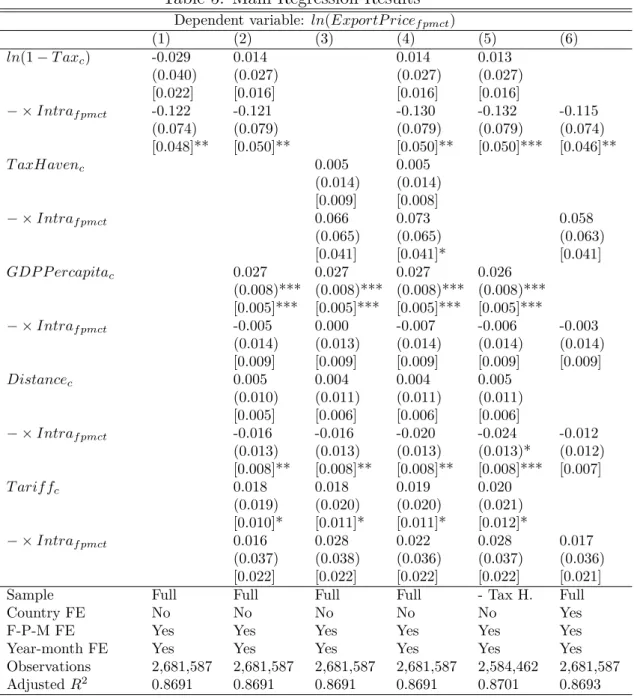
6 Results 36 6.1 Main results . . . 36
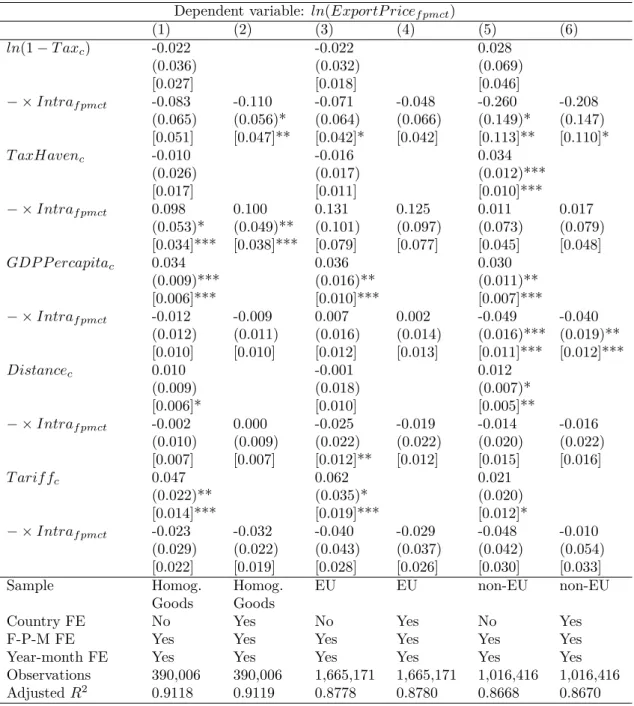
6.2 Additional results . . . 40
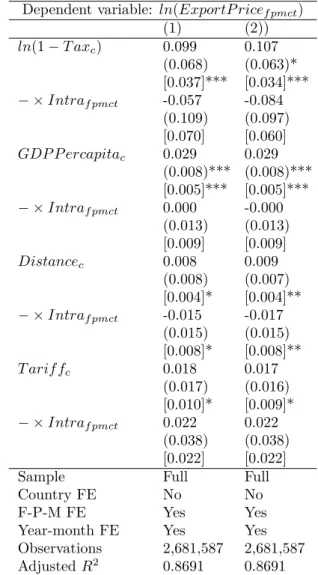
6.3 Robustness checks . . . 44
7 Discussion 49
8 Conclusions 53
References 54
1
Introduction
In the modern global economy with differing national tax regimes, multi-nationally operating enterprises (MNE) have an incentive to shift profits to low-tax countries to ease their total tax burden. Research has found vast empirical evidence of profit shifting and identified multiple tools for MNEs to shift their profits (Hines, 1999; Devereux et al., 2007; Dharmapala, 2014; Beer et al., 2018). In addition to transfer mispricing, in which prices are manipulated to shift income from one country to another, these include in-ternational debt shifting (Huizinga et al., 2008; De Mooij, 2011), in which MNEs create intra-company loans to restructure their global assets, strategic location of intellectual property (Alstadsæter et al., 2018), tax treaty shop-ping (Weichenrieder and Mintz, 2010), tax deferral (Egger, 2015; Hasegawa and Kiyota, 2017), and inversion of headquarter location (Desai and Hines, 2002). The common feature for all profit shifting tools is that they exploit MNE parent and subsidiaries being subject to host country taxation, which exposes the MNE operations to multiple tax systems.
Profit shifting is an important policy theme due to its ability to distort competition and erode tax base. MNEs gain advantage over domestic firms while being able to shift their profits to low-tax countries, leading to unfair competition and efficiency losses. As MNEs use their profit shifting toolbox to ever lower their total tax load, governments are tempted to lower their corporate tax rates in order to keep companies and their taxable profits in their home country (Devereux et al., 2002; Devereux and Loretz, 2012). Due to such efforts to attract MNEs, corporate tax rates fall to a level lower than they would otherwise be, harming public finance and pushing more pressure on other taxable sources. OECD (2015) estimates suggest that corporate profit shifting reduces corporate tax revenue by 4-10%. Finke (2013) suggests that affiliates of MNEs pay 27% less taxes than comparable domestic firms in Germany, and Habu (2017) estimates that taxable income of foreign affiliates in the UK are 12.8% lower than for comparable domestic firms.
The focus of this thesis is on transfer mispricing and its specific effects as a profit shifting tool. Transfer mispricing occurs when two firms within a
multi-national enterprise (MNE) trade with one another and determine trade prices outside the usual market conditions. The necessary condition for market price determination is that buyers and sellers are independent of each other, but in case of dependent firms, the pricing decision is mostly arbitrary or reg-ulated to imitate market prices. However, when it comes to international trade, the dependent firms have an incentive to deviate from market prices to avoid taxes. This can manifest in MNEs trading goods at a lower price to a country with a lower tax rate, or vice versa, to transfer MNE profits to the country with the lower tax rate. Transfer mispricing occurs when MNEs deviate from the market price and decide their transfer prices to optimize profits with respect to taxes.
Economics literature has identified transfer mispricing as an important tool for international tax avoidance. Heckemeyer and Overesch (2017) run a meta-analysis of the accumulated research and estimate that up to 70% of profit shifting is conducted via transfer mispicing. One of the reasons transfer mispricing is such a powerful profit shifting tool is the sheer amount of intra-firm transactions of the total international trade volumes. Clausing (2003) suggests that 40% of US international trade is intra-firm trade and according to Davies et al. (2018), over 50% of MNE international trade value in France in 1999 was intra-firm. IMF (2009) estimates that 30 to 40% of total world trade is between related parties.
Due to the vast share of intra-firm trade in international trade, transfer mispricing not only impacts on tax base and competition. It is also sug-gested that transfer mispricing affects trade statistics and national account-ing, such as trade deficits via biasing export and import volumes and prices. Vicard (2015), using French 2008 trade data, estimates that transfer mispric-ing caused export value to decrease 0.8% and import value to increase 0.5%, causing the trade deficit to worsen by 9.7%. Other empirical papers have also estimated similar trade deficit bias caused by transfer mispricing (Cristea and Nguyen, 2016; Davies et al., 2018; Liu et al., 2017). Solutions have been devel-oped to calculate more reliable export and import price indexes from transfer prices to tackle bias in economic measures (IMF, 2009; Diewert et al., 2005) and to regulate multinational pricing strategies to diminish their biasing
ef-fect on national accounts (OECD, 2017). Global efforts in managing transfer mispricing have been developed during the last decade, such as OECD Base Erosion and Profit Shifting package (OECD, 2015), which presents tools for governments to deal with profit shifting. Efforts to tackle transfer pricing have been found effective. Riedel et al. (2015) show that introduction of transfer pricing rules can decrease corporate profit tax sensitivity by 50%.
The evidence on transfer mispricing have been obtained either indirectly by analysing profit shifting in general or directly by analysing prices them-selves. The direct evidence has been acquired by testing whether MNEs ma-nipulate their intra-firm export and import prices according to the countries’ relative tax rates. These analyses rely on large data sets containing detailed information on export and import prices grouped by product types, destina-tion countries and individual firms. Large and detailed data sets are needed, since a number of different factors affecting pricing decisions must be con-trolled for, such as product quality, firm characteristics and market conditions. Failing to identify all the factors affecting pricing decisions risk the reliabil-ity of results, putting a lot of pressure on data selection and econometric methods.
While empirical research has been conducted on transfer mispricing in countries such as the US (Clausing, 2003; Bernard et al., 2006; Flaaen, 2017), France (Davies et al. 2018; Vicard, 2015), Germany (Overesch, 2006; Hebous and Johannesen, 2016) and Denmark (Cristea and Nguyen, 2016), no similar analysis has yet been made for MNEs operating in Finland. This research aims to fill the gap and provide an empirical estimate of transfer mispricing in Finland using a detailed export data set and the methods presented in previous literature to distinguish the effects of transfer mispricing on Finnish exports. Given the varying tax systems, regulatory schemes and international trade profiles of different countries, empirical results are hard to generalize over countries and time periods. Therefore, to understand transfer mispricing in Finland and patterns of profit shifting, it is important to have an analysis performed with Finnish data.
In Chapter 2, I present theory on transfer pricing and present empirical literature that has tried to estimate the magnitude of price manipulation.
In Chapter 3, characteristics of the Finnish tax system are presented, and in Chapter 4, the data sets used in this research are described. In Chapter 5, I present methods applied to the data set, results of which are reported in Chapter 6. As a conclusion, these results are examined more carefully in Chapters 7 and 8, presenting the final conclusions of the research.
2
Theory and Literature
In this section, I will go through the theoretical motivation for transfer mis-pricing and provide literature review on empirical research conducted to esti-mate the effects of transfer mispricing and its magnitude in real economies.
Throughout this paper, I use the term “transfer pricing” to refer to pricing which involves dependent parties, and “transfer mispricing” as the special case in which such pricing also facilitates profit shifting. Distinguishing the two is important because transfer pricing does not necessarily imply profit shifting, and confusing the two concepts may lead to misunderstanding. Eventually, pricing between dependent parties is a necessary and legal practice facilitating the movement of goods and services within MNEs or dependent domestic firms, for example as part of a production chain. Transfer pricing is thus a theoretical concept encompassing various firm behavioral aspects, other than just profit shifting incentives, and a practice deeply embedded in the institutional structure of international and domestic trade (Göx and Schiller, 2006). In this framework, transfer mispricing can be seen as a special case of transfer pricing, arising from a systemic failure to regulate unwanted firm behaviour and providing firms with a channel for profit shifting.
Not all literature does such conceptual distinction, but may use the term “transfer pricing” to represent both intra-firm pricing in general and profit shifting activity. However, I follow De Mooij (2011) and Beer et al. (2018) to better distinguish these two.
2.1
Transfer pricing as opposed to market pricing
Transfer pricing is defined as pricing occurring between related parties, such as two separate firms that are part of the same corporate. The differences in transfer pricing and regular market pricing arise when the trading partners do not fulfill the condition of independence. The basic microeconomic theory suggests that when independent buyers and sellers meet in the marketplace, the price is set for both parties to gain utility in the transaction. This applies whether the market is competitive, monopolistic or oligopolistic, revealing
information about the preferences of each buyer or seller taking part in the transaction, and about costs, value added, productivity and profitability of each independent agent.
The standard microeconomic pricing theory illustrates the price setting case when each party is independent of each other. The outcome price of such a scenario can be called “an arm’s-length price”. However, when the condition of independence is eased, it can be seen that the pricing decision becomes arbitrary. When the corporate profits are summed up, the costs and profits of an internal transaction between two related firms cancel out, no matter what price is used in the transaction, leaving no economic incentive for the pricing decision (Diewert et al., 2005). However, economic transfer pricing can lead to efficiency gains for large companies, and extensive literature exists for decentralized decision making in organizational economics (e.g. Hirshleifer, 1956).
2.1.1 International case with differing corporate income taxes
When the two dependent trade partners situate in different countries, a set of restricting conditions start applying to the otherwise arbitrary pricing de-cision. The corporate income taxes in the two countries can be different, which gives an incentive to the MNE to choose the price so that profits are transferred to the country with the lower tax rate (Kant, 1988; Horst, 1971). Following the paper of Clausing (2003), the profit functions for the two firms in different countries can be defined as:
π1 =R1(s1)−C1(s1+m) +pm (1)
π2 =R2(s2)−C2(s2−m)−pm (2)
where π is the firm revenue, R the revenue as a function of sales s in the home country and C the costs as a function of production. Additionally, the profit is determined by the sales to the foreign affiliate m and the price p
assigned to these foreign sales. In these equations, p represents the transfer price, which multiplied by the quantity of sales m depicts the income shifted
from firm to another as a result of internal transactions. When introduced with firm income tax rates, the total after-tax profit of the MNE can be illustrated as:
π= (1−t1)π1+ (1−t2)π2 (3)
where ti is the income tax rate in country i. To maximize this total
after-tax profit, the MNE optimizes with respect to transfer price p. This can be achieved by taking the first derivative of the total profit with respect to transfer price p:
πp = (1−t1)m−(1−t2)m (4)
=−(t1−t2)m
Thus when t1 > t2, πp < 0 and the corporate maximizes its profits by
setting the transfer price as close to zero as possible (when assumed that negative prices are not feasible). Vice versa, when t1 < t2, πp > 0 and the
corporate maximizes its profits by setting the price as high as possible, but as noticed by Bernard et al. (2006), limited with the condition that taxable income stays positive also for the firm in the high-tax country (p−→p∗, where
p∗ is the price that sets π2 in equation (2) to zero). As Beer et al. (2018)
em-phasise, this concept of separate accounting, in which individual subsidiaries are subject to different tax treatment, is the basis for all international profit shifting and also forms the incentive for transfer mispricing.
2.1.2 Cost component of transfer mispricing
For the tax collecting authorities, the former example provides worrying re-sults. In a situation with no government regulation, internationally operating firms are best off by pricing all their profits into the low-taxing countries, thus eroding the taxable income for high-taxing countries and encouraging unhealthy tax competition. To ensure that the MNEs pay their taxes in
countries where the additional value is actually created, it is often expected of them to set their transfer prices to imitate the arm’s-length prices, which is referred to as the arm’s-length principle (OECD, 2017). The regulatory authority can sanction the corporate for prices that differ remarkably from the referenced arm’s-length prices, creating a cost component to the corporate profit function (Kant, 1988). This type of “transfer mispricing concealment cost” is adopted in most empirical papers. Davies et al. (2018) format this cost component as follows:
C =f[|p−p∗|] = γ 2(p−p
∗
)2+µ, ifp6=p∗ (5)
= 0, ifp=p∗
where γ reflects the strictness of the country on transfer price rules, µ
is a fixed cost component that is always present when transfer mispricing is practiced, p is the transfer price that the corporate chooses, and p∗ is the comparable arm’s-length price. In this equation, it can be seen that the cost of transfer mispricing is the greater the more the corporate chooses to deviate from the arm’s-length price and the stricter the government is to punish when it observes deviations from the arm’s-length prices. Inserting this cost term into the profit function (eq. 3) yields
π = (1−t1)π1+ (1−t2)π2−f[|p−p∗|] (6)
Here it can be seen that deviating from the arm’s-length price makes the corporate better off only when there is enough trade volume, tax difference and price difference to compensate the concealment cost, and additionally, to compensate the risk of being caught by the regulatory authority. Davies et al. (2018) suggest that this theoretical formulation creates a band of inaction, which makes deviating from the arm’s-length prices profitable only for big firms exporting and importing sufficiently large quantities to countries with significantly lower tax rate.
2.1.3 Problems in the arm’s-length principle
There are problems when using the arm’s-length principle to evaluate the comparable market price for the traded goods. Obviously, not all intra-firm transactions have a clear reference price in the free market, since similar inde-pendent trade might not be observed between the same countries, same prod-ucts and similar firms (Bartelsman and Beetsma, 2003; Beer et al., 2018). Bernard et al. (2006) analyze the US export price differences by firm de-pendency status by tagging each intra-firm transaction with a “comparable uncontrolled price”, defined by the US tax code and OECD tax guidelines (for an updated version, see OECD (2017)), ending up only finding a suffi-cient comparable uncontrolled price for one third of the transfer prices. This means that for two thirds of the intra-firm transactions in their customs export and import data, an estimate for the comparable uncontrolled price cannot be assigned. One of the biggest problems in defining comparable uncontrolled prices is product differentiation, which ensures that for many products there are no arm’s-length prices, since in practice, there is only one firm producing and trading on a certain type of good.
To estimate a reference price for those goods that cannot be assigned an arm’s-length comparable uncontrolled price, a cost-plus method can be used. As a rule of thumb, a cost-plus method uses information on costs of trading partners to deduce what is the price for the transaction that leaves both firms with a theoretical surplus in the transaction (Diewert et al., 2005). However, relying on multiple methods to determine acceptable prices for intra-firm transactions leads to an even wider spectrum of plausible and legitimate transfer prices for MNEs to apply, which allows them to choose the most suitable one for taxation purposes (Davies et al., 2018).
As shown by Cristea and Nguyen (2016), the MNE facing an arm’s-length principle restriction on its pricing decisions may also have an incentive to manipulate its arm’s-length prices. This creates another obstacle when using the arm’s-length principle to solve for the reference price for the intra-firm transaction, since even the reference price can be subject to manipulation. However, such a practice creates an additional cost for the firm since
manip-ulating its trade prices with unrelated parties may mean increased losses in its market-based trade. For example, when manipulating export prices to a low-tax country, the firm should decrease its prices for the independent firms, thus deviating from the optimum and losing in these transactions. Therefore, the total volume of the intra-firm trade must be large enough compared to the independent trade for this practice to be profitable.
Due to the problems in the arm’s-length principle, estimating the mag-nitude of transfer mispricing is also a difficult task requiring a lot from the identification applied in the empirical research. The most obvious difficulty concerns the lack of reference prices, but on top of that, arm’s-length price manipulation further erodes the credibility of comparing arm’s-length prices to intra-firm prices. Even if there is a risk of arm’s-length price manipulations, many of the earlier empirical papers, such as Clausing (2003) and Bernard et al. (2006), assume that MNEs do not have the power to manipulate arm’s-length prices, or they do not take the possibility of arm’s-arm’s-length manipulation into account at all.
2.2
Empirical studies
In this section, I will go through the empirical research that have been made to explore whether transfer mispricing can be found in real world data and to calculate the magnitude of transfer mispricing in real economies. Various methods have been used to distinguish transfer pricing from market pricing and their potential differences, but mostly large micro-data sets have been involved. This has been necessary, since to differentiate transfer pricing from arm’s-length pricing, one needs to have information on the firm level to iden-tify the dependencies of the trading parties, as well as detailed information on good quality and destination, since controlling for the product type and market characteristics is essential when comparing prices of independent and dependent transactions.
Most of the research available finds statistically significant evidence on transfer mispricing. This might be due to publication bias, although when reflecting on the theoretical basis of transfer mispricing, there are clear reasons
to expect transfer mispricing occurring in real economies. The estimated elasticity of transfer pricing on tax differences between trading countries varies from 0.5 to 6, which Beer et al. (2018) suggest might be due to differences between countries, firms and sectors studied, as well as the data and the methods used.
2.2.1 The basic model for analyzing transfer pricing
Clausing (2003) is one of the most cited empirical papers on the effects of tax differences on transfer pricing. Her work relies on US price index data, which consists of a representative sample of international trade prices in the US gathered by Bureau of Labor Statistics for 1997-1999. In this data set, each price is tagged with information on country of export or import, good type and if the trade is between related parties or not. These price data are then formatted into a regression model, in which log price is explained by a dummy of intra-firm trade adjusted by exporting or importing country tax rate. The full regression model is:
ln(Priceit) = α+β1ln(1−Tax rateky) (7)
+β2ln(1−Tax rateky)×Intrafirm dummyit
+β3ln(Exchange rate indexkt)
+β4ln(Exchange rate indexkt)×Intrafirm dummyit
+β5Intrafirm dummyit+β6Inputeit
+β7Linkit+β8No dollarit+βzIndustry dummies +vit
where iindicates individual products, k countries,t month of observation and yyear of observation. The variables “inpute” and “link” refer to whether the price has been inputed or estimated as a link price, since the data set is used for calculating price indexes and thus includes instrumental observations to deal with missing observations. The industry dummies are used to control for different industry categories. The main interest lies in coefficientβ2, which
existence of destination tax rate differences on transfer prices. In addition to this basic model, Clausing uses GDP and GDP per capita to control for income differences between countries, which account for differing market conditions across countries. As a result, Clausing finds that a 1% lower or higher tax rate in a country is associated with as much as 1.8% lower intra-firm export prices and 2.0% higher intra-firm import prices relative to the arm’s-length prices.
The model is analogous to the more common difference-in-differences model, which uses panel data to isolate impacts of a treatment from other time-dependent changes in variables (see e.g. Card and Krueger, 1994). In the most simple setting, treatment and control group are measured before and after the treatment, so that the common time-dependent trend can be omit-ted from the estimate of the treatment impact. By replacing treatment with intra-firm dummy and time variable with tax rate, it can be noticed that such a model looks very similar to the one applied by Clausing (2003):
Y =α0+α1 ×Tax rate +α2×Intrafirm dummy (8)
+α3 ×Tax rate×Intrafirm dummy +
where Tax rate = ln(1−Tax rateky). To interpret this simplified version
of the full regression model, it is useful to consider the two differences forming the core of interest: difference in prices caused by tax rate, and difference in prices caused by export mode, i.e. whether price is arm’s-length or intra-firm. To come to the conclusion that intra-firm export prices are smaller than arm’s-length prices for lower tax rate countries, one needs to control for arm’s-length prices depending on tax rates and intra-firm price differences from arm’s-length prices. The cross term of intra-firm dummy and tax rate then isolates the difference of the two price groups in the way they depend on the tax rate variable.
Bernard et al. (2006) employ an analysis similar to Clausing (2003) on the US customs bureau data on exports for years 1993-2000, using a tight pairing of intra-firm and reference prices called “price wedges” as the regressand in the
model. The study finds that 1 percentage point decrease in corporate tax rate or increase in tariff increases the price wedge between related-party and arm’s-length prices by 0.56 to 0.66 percentage points. The paper also concludes that the price wedge depends positively on firm size and export volume, which are also conclusions in later research (Davies et al., 2018). Even if the paper is not published in an academic journal, its empirical analysis using customs data is later replicated and modified in further papers (Cristea and Nguyen, 2016; Davies et al., 2018). Flaaen (2017) explores transfer pricing in the US by investigating the case of “one-time dividend repatriation tax holiday”. The paper concludes that when comparing pre and post-tax holiday transfer prices, strategic transfer mispricing can be observed in the US multinationals trading internationally. Flaaen (2017) modifies the difference-in-difference model by Bernard et al. (2006) to explore the variance in price wedges before and after the tax repatriation holiday relative to differing tax rates across export and import countries.
2.2.2 The triple-difference method
Cristea and Nguyen (2016) develop further the empirical methods developed by Clausing (2003) and Bernard et al. (2006) by taking into account that the MNEs involving in strategic transfer mispricing tend to also manipulate their arm’s-length prices to make their pricing decisions appear more in tune with the arm’s-length principle imposed by the tax authorities. Whereas Bernard et al. (2006) identified transfer mispricing by price wedges with an intra-price and an arm’s-length price of the same firm, good and country, Cristea and Nguyen (2016) argue that such identification underestimates the volume of transfer mispricing, because the closest arm’s-length reference price is subject to manipulation by MNEs to cover their tax avoiding behaviour. They sug-gest an alternative strategy to better isolate the volume of strategic transfer mispricing by using a triple-difference method, which exploits the temporal variation of firm dependencies. By comparing the prices before and after an MNE has established an affiliate to a country, another layer to the basic difference-in-differences model can be added, which removes the biasing effect
caused by arm’s-length manipulation. Cristea and Nguyen (2016) find that MNEs in Denmark in 1999-2006 reduce their intra-firm export unit values by 5.7 to 9.1 percent to low-tax countries, suggesting transfer price manipulation to avoid taxes.
Even if Cristea and Nguyen (2016) use a more sophisticated method to distinguish arm’s-length price manipulation, they do not identify accurately the true intra-firm trade from the independent trade in the Danish customs data set in use. The same method of using affiliate geographic information as a proxy for intra-firm trade is used by Vicard (2015), Hebous and Johannesen (2016) and Liu et al. (2017). However, Davies et al. (2018) criticize such an approach by showing that there is significant variation of intra-firm and independent trade volumes in countries where the firm has an affiliate. They argue that by neglecting the accurate identification of transaction dependen-cies, Cristea and Nguyen (2016) risk failing to obtain an accurate estimate for the magnitude of transfer mispricing. However, their analysis on the effects of establishing an affiliate on transfer mispricing is unique, and using data on Denmark gives rare evidence on transfer mispricing in a small open economy.
2.2.3 Recent developments in methods and further results
Most recent of the empirical papers studying transfer mispricing is by Davies et al. (2018) which concentrates on identifying tax-avoiding component in French transfer prices with a detailed data set combining French customs data on exports and imports, a survey on foreign activities of French MNEs, a firm-level data set on financial linkages between French firms and the effective tax rates and tariff information facing French exporters. By combining all the above data sets, Davies et al. (2018) are able to tag the totality of French exports and their prices with information on their dependency status for 1999, creating a unique data set for investigating transfer pricing behaviour. By also taking into account the manipulation of arm’s-length prices, as suggested by Cristea and Nguyen (2016), but with a less complicated method, Davies et al. (2018) are able to isolate the tax-avoiding component in transfer prices. The idea is that prices are not compared within the same firm, product and country
by tight pairing of intra-firm and arm’s-length prices, as done by Bernard et al. (2006), but rather within same firm and product across countries with differing tax rates. Davies et al. (2018) also investigate tax haven status effects on transfer price manipulation.
As a result, Davies et al. (2018) find that tax-avoiding transfer mispricing is primarily found in only a small number of large MNEs. Additionally, tax-avoiding behaviour is concentrated in tax havens, with no evidence of tax avoidance if they are disregarded. Intra-firm export prices are 10.4% lower than the market prices in tax havens, indicating that French MNEs exported with an underpriced value of 1 billion euros less due to tax avoiding purposes. Using the UK export data from 2005-2011 and similar empirical methods, Liu et al. (2017) find that a 1 percentage point lower tax rate decreases intra-firm export prices by 3% compared to arm’s-length prices. Opposite to the results of Davies et al. (2018), they find that most transfer mispricing takes place in non-tax haven countries, which is explained to be possibly caused by the small amount of UK trade to these countries. In addition, transfer mispricing is suggested to depend on the firm’s R&D intensity, and it is found to react strongly to the UK policy shift from a worldwide to a territorial tax system. In total, 2010 export value is estimated to be underreported as much as £600 million.
Vicard (2015) exploits panel data from France in 2000, 2007-2009 and 2014 and finds similar systematic evidence for French transfer mispricing as Davies et al. (2018). However, he finds underreported taxable income on both exports and imports to be even higher, up to 8 billion euros in 2008.
Hebous and Johannesen (2016) find evidence on transfer mispricing in German service trade, including intellectual property, headquarter services and sea transport. Evidence on transfer mispricing in service trade is scarce, even if the arm’s-length principle is even less applicable for controlling transfer mispricing in services than goods, suggesting a more pronounced effect of transfer mispricing via services. The paper reminds that other studies so far have only identified transfer mispricing in trade of goods, which disregards the vast possibilities for profit shifting by international service trade.
2.2.4 Effects on economic measures
In addition to finding evidence on profit shifting via transfer mispricing, the results of empirical research on transfer mispricing have a wide range of ef-fects on multiple economic measures that are of interest to researchers and policymakers. The usual conclusion in empirical transfer mispricing literature is that total export values are lower and import prices higher than they would be without transfer mispricing. Such results are calculated simply by multi-plying the estimate for elasticity of intra-firm prices with total exports per country and their tax differences (Liu et al., 2017; Vicard, 2015). This gives the amount of income shifted given the parameter of intra-firm price elastic-ity on tax difference. Ever further calculations can be made to solve for the corporate tax losses from this estimate of underreported corporate income.
Decreased export value and increased import value lead to a number of further conclusions. Vicard (2015) states that such biased statistics worsen trade deficits. Profit shifting in general is observed to understate value added in high-taxing countries, which leads to underestimating total GDP (Seppälä et al., 2014; Maffini and Mokkas, 2011; Bruner et al., 2018). Guvenen et al., (2017) argue that whenever profit shifting increases, even GDP growth gets underestimated, which originates from domestic productivity growth increas-ingly calculated as foreign rather than domestic income.
Export and import price indexes are also considered to have an impact by transfer mispricing. Eden (2001) defines use of transfer prices in calculating export and import prices as essential, since almost half of US international trade is intra-firm, and thus excluding transfer prices would lead to overes-timating the share of small exporters and importers in calculated indexes. Diewert et al. (2005) propose not to use transfer prices in constructing ex-port and imex-port price indexes, but instead prices of comparable arm’s-length transactions. This policy is also encouraged by IMF Export and Import Price Index Manual (IMF, 2009) in the limits of its practical applicability and ad-ministrative costs to the statistical agencies.
Neiman (2010) challenges the view that international transfer prices are primarily driven by profit shifting motives. Using time-series data on
intra-firm prices, Neiman (2010) concludes that they are less sticky, less synchro-nized and exhibit greater exchange rate pass-through than arm’s-length prices. According to Neiman (2010), there is evidence that intra-firm prices convey mainly economic information about MNE costs and profitability beyond being mere accounting constructs and means to profit shifting. In order to under-stand the effects of transfer mispricing on economic measures discussed above, investigating their temporal behavior is argued to be necessary.
2.2.5 Transfer price regulation and its possible pitfalls
Transfer price regulation has drawn increasing attention by policy makers during the last decades, and recent efforts to restrict MNE profit shifting have been presented by national governments, OECD (2015) and the European Comission (2018). One of the central tools to tackle profit shifting by transfer mispricing has been the OECD Transfer Pricing Guidelines (OECD, 2017), which is used around the world as a transfer price regulation standard.
While the aim of transfer price regulation is to hinder profit shifting, it also has impacts on firm behavior and economy that exceed the original purpose. IMF (2009) warns that transfer price regulation puts pressure on MNEs to rely on legal consulting in navigating domestic and foreign regulations, increasing the cost of international trade. Behrens et al. (2014) study firm behaviour under transfer price regulation by arm’s-length principle and present a the-oretical model in which multinationals choose their organisational structure according to the government transfer mispricing strictness, relying more on foreign affiliates when restrictions are relaxed compared to relying on foreign independent distributors when restrictions are strict. Keuschnigg and Dev-ereux (2013) use a similar kind of simulation model to evaluate the effects of transfer pricing rules on the economy, suggesting that transfer price reg-ulation by arm’s length-principle creates global welfare losses by preventing multinationals to choose pricing strategies that match financial market im-perfections. De Mooij and Liu (2020) find that MNEs decrease investment after introducing transfer price regulation. These papers show the difficulties of efficient transfer pricing regulation and examples of how transfer pricing
3
Finnish Institutions
To further specify the incentives faced by MNEs operating in Finland, it is necessary to explore the characteristics of Finnish corporate tax system in re-lation to the international patterns of profit shifting. When analysing effects of profit shifting on a country, individual characteristics of the tax system need to be addressed to uncover what are the main drivers of profit shifting activity, and what kind of legislation applies to MNEs operating in that par-ticular country (Dharmapala, 2016). Differences in tax systems complicate comparing results for different countries with similar research methods, and it is logical to assume that various institutional and structural differences, as well as differences in the composition of international trade, form the basis for why different magnitudes of transfer mispricing are observed across countries. Two main types of corporate tax systems can be identified as territorial and worldwide systems (Beer et al., 2018). In a territorial system, foreign earnings of MNEs are exempted in the residence country taxation, so that only income in the source country is classified as taxable income. The world-wide system, on the other hand, considers income from all countries subject to home country taxation. Davies et al. (2018) argue, that a territorial tax regime provides a simpler mapping between a tax differential and transfer mispricing incentives as compared to the worldwide system, because in the latter, even the income acquired in a third country unrelated to the trans-action may complicate tax incentives in a single export transtrans-action. This happens because income from all countries the MNE has activities in are aggregated to a single taxable income basket, which limits possibility for sep-arate accounting. Huizinga and Laeven (2008) have employed a model taking complex geographic patterns into account when estimating profit shifting pat-terns. However, their analysis concentrates on profit shifting in general rather than the role of transfer pricing as a profit shifting tool.
Despite worldwide tax systems in the US and, until recently, in the UK, research using data for them have found evidence on transfer mispricing (e.g. Bernard et al., 2006, Liu et al., 2017). However, Liu et al. (2017) find that the UK tax reform from a worldwide to a territorial tax system in 2009 increased
observed transfer mispricing. This would indicate that territorial tax system indeed gives more incentive to transfer mispricing, as also suggested by Markle (2016).
Finland has characteristics of a worldwide tax system, since in principle, MNEs need to pay taxes for income on both Finnish and foreign sources (Verohallinto, 2019). This is also elaborated by Finnish Ministry of Finance, which states that “companies with unlimited tax liability in Finland are liable for tax on all of their income, regardless whether the income is received from Finland or another country” (Ministry of Finance, 2020). However, Finland is usually categorized as belonging to the group of territorial taxation (Matheson et al., 2013), which may be a result of the fact that the two categories are not clear-cut (Beer et al., 2018), and that in practice, taxation would in effect be similar to that in other territorial tax system countries. If not, transfer mispricing incentives could be expected to be milder for MNEs operating in Finland as compared to countries previously researched with territorial tax system.
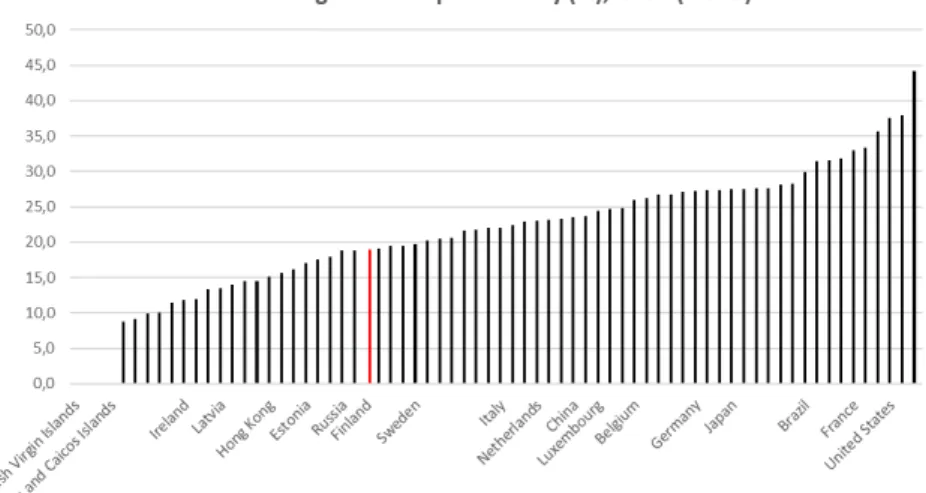
Figure 1: Effective average tax rate per country. More details on tax rates in the Appendix (Table A2). Source: OECD Corporate Tax Database
A substantial decrease in corporate tax rate took place in Finland in 2014 lowering the corporate tax rate from 24% to20%. Due to this policy change, profit shifting from Finland could be assumed to have become less attractive
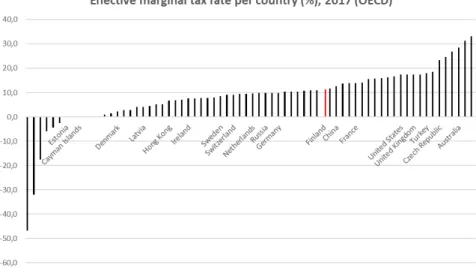
Figure 2: Effective marginal tax rate per country. Full list of tax rates in the Appendix (Table A2). Source: OECD Corporate Tax Database
in recent years compared to before the tax decrease. According to the OECD tax database, the effective average tax rate (EATR) of Finland at 19% was slightly below the sample median of 22%, which makes Finland a country of relatively moderate corporate taxes in 2017 (Figure 1). However, the effective marginal tax rate (EMTR) for Finland at 11.4%, another OECD measure for taxes faced by MNEs, is slightly above the sample median of 9.5% in 2017 (Figure 2). The moderate tax rates of MNEs in Finland can be compared to those of Denmark in the research by Cristea and Nguyen (2016), which found evidence of tax evasion by transfer mispricing despite moderate tax rates in Denmark. The worldwide characteristics of the Finnish tax regime and moderate corporate tax rate need to be taken into consideration when formatting the analysis on transfer mispricing and later when interpreting the results.
4
Data
4.1
Export data and data on firm dependencies
The data used consists of two separate tables by Statistics Finland and Finnish Customs. The Finnish Customs data includes information on total exports from Finland, categorized by exporting firm, export country and CN8 product type code, divided for each month 2014/1-2017/12. The Statistics Finland data, on the other hand, provides information on the dependencies of Finnish firms domestically and abroad. These two data sets are combined to recover the geographical distribution for each Finnish enterprise and to tag trade flows according to the information on geographical dependencies.
In an ideal setting, each transaction in the customs data could be given an accurate information on its export mode – in other words, whether the trans-action takes part arm’s-length or intra-firm. Such an identification method has been used by Davies et al. (2018) using a similar customs data for France in 1999, merging accurate information on export mode from a unique and extensive survey conducted on French MNEs for one year only. However, equivalent information for Finnish MNEs is not available and, therefore, MNE geographical structure is used as an approximate on the export mode, as in papers by Liu et al. (2017), Vicard (2015) and Cristea and Nguyen (2016).
The identification of export mode is clearly inaccurate using only the MNE geographical location information, since not all trade flows to countries where the firm has dependencies is intra-firm in nature. Despite its clear weakness in identifying intra-firm trade, the strength of the identification strategy em-ployed lies in its ability to be accurate on defining the control group, which comprises only of arm’s-length trade: since the arm’s-length group includes only trade to countries were the firm has no dependencies, no intra-firm trans-actions are mistakenly allocated to this group.
To ensure that the control group of arm’s-length trade does not have any intra-firm transactions, the foreign-owned MNEs need to be dropped out of the data set, for their complete corporate structure cannot be revealed using the data set on firm dependencies. The Statistics Finland data set on
depen-dencies of the Finnish firms has information on the nationality of the final parent company, revealing some information of the geographical structure of a foreign affiliate in Finland. However, since all other branches and nationalities under the parent company cannot be identified, the information on MNE’s geographical structure remains largely unknown. The motivation to keep the control group of arm’s-length trade clear of intra-firm transactions encourages to concentrate on Finnish-owned firms only, since their entire global structure can be tracked using the Statistics Finland data on Finnish foreign affiliates. Unfortunately, applying such a restriction implies that no conclusions can be made on transfer mispricing practiced by foreign-owned MNEs in Finland.
As an indicator that the intra-firm transactions for foreign MNEs may be misidentified, there are vast differences in shares of intra-group trade for foreign and Finnish MNEs. Of total price observations for foreign MNEs, only 15.2% are allocated into the intra-group, whereas the same proportion for Finnish MNEs is 34.5%. The difference is even more pronounced when comparing the share of intra-group trade value of total value of exports, which for foreign MNEs is 21.4% and for Finnish MNEs almost three times more at 59.1%. These observations would indicate that the intra-firm transactions for foreign MNEs are largely misspecified into the control group of arm’s-length trade, encouraging to concentrate solely on data for Finnish MNEs. However, when interpreting these proportions, it is important to keep in mind that the intra-group trades are not necessarily real intra-firm transactions, but also include trade to a third party to a country where the MNE has an affiliate. Therefore, the intra-group share of Finnish MNE exports is overestimating the true volume of intra-firm trade. On the contrary, the control group for Finnish MNEs does not include any intra-firm trade.
To further modify the data set, state-owned firms are excluded, since their pricing strategies may substantially differ from private firms (Davies et al., 2018). The exports of these firms account for 0.9% of the total value of Finnish exports.
4.2
Country-specific variables
As the two main data sets described above are combined, we are given a table of unit price per firm, CN8 product type, country of export and a variable indicating if the transaction belongs to the arm’s-length or the intra-firm group as defined previously. Additional country-specific information on GDP per capita, country distance from Finland in kilometers, tariffs, tax haven status and corporate income tax rates can be merged into the data set using the information on the export destination available for each transaction. These country-specific variables are used to control for variations in prices that are related to different market conditions and institutional structures in export countries. The tax rate can be used to distinguish whether differences in arm’s-length and intra-firm prices are systematically related to lower tax levels. The relation between different tax regimes and differences between arm’s-length and intra-firm prices is of main interest in later analysis to study if systematic transfer mispricing exists or not.
Information on GDP per capita in US dollars and current prices is ob-tained from IMF database (IMF, 2020). It is used to estimate the impact of the relative wealth of the export country on export prices. As a general assumption, export prices are expected to be lower to countries with a lower GDP per capita, even within the same product category. A similar assump-tion can be made of the export country distance from Finland, obtained from CEPII database (Mayer and Zignago, 2006), considering that the greater dis-tance the good needs to travel, the larger the transportation costs and thus export prices.
There are various alternatives that can be used as a proxy for tax costs faced by MNEs in different countries. In reality, the true tax costs in a coun-try for each induscoun-try and firm differ depending on various aspects, such as production structure, the universe of tax rules and legislation in a country. Therefore, using a single variable to describe the entire set of tax incentives in a country for each firm can only capture a portion of the real tax incentives in action. To follow the research made by Davies et al. (2018), effective marginal tax rate (EMTR) provided by the OECD Corporate Tax Statistics Database
(OECD, 2020), is used to give the best estimate of the tax incentives faced by a firm operating in a country. EMTR is especially well suited for this purpose, since it measures the income saved by shifting an additional unit of income, or the marginal utility of income shifting. EMTR is a synthetic tax policy indicator (Hanappi, 2018), meaning that it differs from the statutory tax rate, the rate officially imposed on corporate income by the government. OECD EMTR information is only available for year 2017, which is why statutory tax rate from the OECD Corporate Tax Statistics Database for each individual year is used for a robustness check. The statutory tax rate reflects the corpo-rate income tax corpo-rate as expressed in the legislation, and does not necessarily capture the true tax incentives facing MNEs. Tax rates used in the analysis are listed in the Appendix (Table A2).
As a source for tariffs faced by Finnish companies by export country and HS4 product code, I use World Integrated Trade Solution database (IMF, 2019). Information on tariffs is an important factor in determining export prices, since they affect directly the export costs. It can be assumed, that arm’s-length prices are higher to destinations with higher tariffs for the given product, to compensate the tariff losses to the exporting firm and ensuring that trade is profitable for the exporter. In opposite, intra-firm prices can be assumed to be lower to destinations with higher tariffs, since the MNEs have an incentive to avoid tariff costs, which are usually proportional to the value exported.
4.3
Data set description
Export value of foreign affiliates make a large proportion of the total export value from Finland in the original data set. Therefore, as I use only exports by Finnish MNEs and independent firms, 35.5% of the export value is omitted from the sample. The differences in Finnish and foreign owned MNEs and firms can be seen in Table 1.
Table 2 presents an overview on the export sample of Finnish firms and MNEs used further in the analysis. As indicated by the mean of export value, a single transaction in intra-group is more than double that of the
arm’s-Table 1: Comparison of foreign affiliate and Finnish MNE and independent firm exports 2014-2017
Foreign Finnish Total Number of observations 1,155,900 2,681,587 3,837,487 Mean of log(price) (log(e)) 3.57 3.33 3.40 Sum of export value (billion e) 63.5 115.2 178.7
Mean of export value (e) 54,936 42,995 46,996 Intra-group value (%) 21.4 59,1 46.3
length group. Additionally, the mean of log price gives the first evidence that intra-firm trade prices are lower than arm’s-length prices. This difference is not yet suggestive of systematic transfer mispricing, since it may be based on various differences between the transactions in these two groups. For example, the intra-group consisting of lesser-quality goods or trade towards less developed countries could explain the difference. In addition, a single transaction being more valuable in intra-group could lead to additional unit costs, such as transport unit costs, being lower for the intra-firm group. To look for a systematic response of the price groups on destination country taxation, a more detailed analysis is needed.
Table 2: Summary statistics of prices and export values by export mode, Finnish MNEs and independent exporters 2014-2017
Control group Intra-firm group Total Number of observations 1,752,427 929,160 2,681,587 Mean of log(price) (log(e)) 3.51 3.00 3.33
Sum of export value 46.3 68.9 115.2 (billion e)
Mean of export value (e) 26,416 74,149 42,995
Tax Haven value (%) 3.4 1.3 2.1
Figure 3 presents the geographical distribution of intra-firm group exports, showing the share of intra-group transaction of total exports by destination country. The greatest proportion of intra-group trade can be found in the United States and the Netherlands, both of which have a share of intra-group trade above 80% of the total exports. China and Sweden are other important export destinations with above 70% share of their exports
intra-Figure 3: Shares of intra-group trade value per destination country in 2014-2017, circle size represents total export value of the destination. Only 40 top destinations by export value presented.
group, whereas less intra-group trade can be observed in Germany and Russia, where the share of intra-group trade stays below 60%, and the UK, France, Japan and the rest of the Nordic countries, where the intra-group share is approximately 40%. Even if the figure does not tell the actual share of intra-firm trade to these destinations, it may give some hint of where the intra-intra-firm transactions are more prevalent and, in addition, accurately describes when an affiliate is present in an export country.
Figure 4: Shares of intra-group trade value by CPA categories, circle size represents total export value of the CPA category. Explanations of CPA categories in Appendix (Table A1).
Figure 4 illustrates the share of intra-group transactions by commodity type, classified by CPA category. As is the case with export destinations, intra-group exports show a great variation by commodity type. In general, the most exported goods tend to also be the most intra-group oriented. Highest share of intra-group exports can be identified in basic metals (24), paper and paper products (17) and coke and refined petroleum products (19), where the intra-group share is 70 - 90% of the total exports. Less intra-group trade can be identified in computer, electronic and optical products (26) and electrical equipment (27), where intra-group share is slightly below 60%, and machinery (28), where intra-group share is around 50%. Motor vehicles, trailers and semi-trailers (29), chemicals and chemical products (20) and wood and wood products (16) are exported intra-group in 40% of their value. Products of agriculture (1) are exported intra group less than 10% of their value. As an outlier, the small group of Architectural and engineering services (71) is exported almost 100% intra-firm. However, this category is small in export value, since it mainly describes services not included in goods exports. Full description of CPA categories in Figure 4 are listed in the Appendix (Table A1).
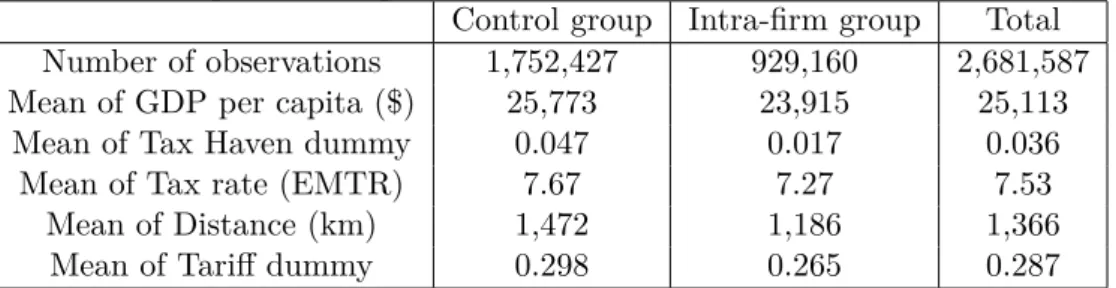
Table 3: Summary statistics of country variables by export mode, Finnish MNEs and independent exporters 2014-2017.
Control group Intra-firm group Total Number of observations 1,752,427 929,160 2,681,587 Mean of GDP per capita ($) 25,773 23,915 25,113
Mean of Tax Haven dummy 0.047 0.017 0.036 Mean of Tax rate (EMTR) 7.67 7.27 7.53
Mean of Distance (km) 1,472 1,186 1,366 Mean of Tariff dummy 0.298 0.265 0.287
Table 3 presents means of country variables in the data set. The share of export transctions to tax havens is 3.6 percent in the total sample, but only 1.7 percent in intra-firm group transactions. It can also be seen that trade in intra-firm group is more likely to direct to countries with slightly lower GDP per capita, lower effective marginal tax rate, smaller distance to Finland and less tariffs imposed to the exported products.
5
Empirical methods
The empirical methods in this research are mostly based on work by Davies et al. (2018), which in turn employs very similar methods to other empiri-cal papers studying transfer mispricing (Clausing, 2003; Bernard et al., 2006; Vicard, 2015; Liu et al., 2017). At the core of each of these empirical paper, there is a difference-in-differences model with fixed effects to isolate the dif-ference between arm’s-length and transfer prices across different tax regimes, controlled by product, firm and market characteristics.
To start with, export price data is used instead of import price data, since the former includes information on exporting firm. This information is impor-tant to distinguish firm dependent characteristics from other sources of price variation. Information on exporting firm allows to control for productivity differences between firms and other important factors in production that af-fect pricing, which makes export price data ideal for identification of transfer mispricing (Davies et al., 2018).
As discussed in the data section, the biggest difference to the work by Davies et al. (2018) is that I rely on geographic proxies to identify transfer prices from arm’s-length prices. Therefore, the interpretation of the results is not as straightforward and needs to take into account the inaccuracy caused by the identification strategy. However, as other papers have also used a similar geographic proxy in their research (Cristea and Nguyen, Cristea and Nguyen 2016; Hebous and Johannesen, 2016; Liu et al., 2017; Vicard, 2015), with otherwise very similar methods to Davies et al. (2018), they can be used to mirror the effects of inaccurate transfer price identification on results.
5.1
Difference-in-differences regression with fixed
ef-fects
The difference-in-differences model used follows the one conducted by Davies et al. (2018) and can be written:
ln(Pricef pmct) = α1Intraf pmct (9)
+α2ln(1−Taxct) +α3ln(1−Taxct)×Intraf pmct
+α4Tax havenc+α5Tax havenc×Intraf pmct
+α6Countryct+α7Countryct×Intraf pmct
+µf pm+µt+f pmct
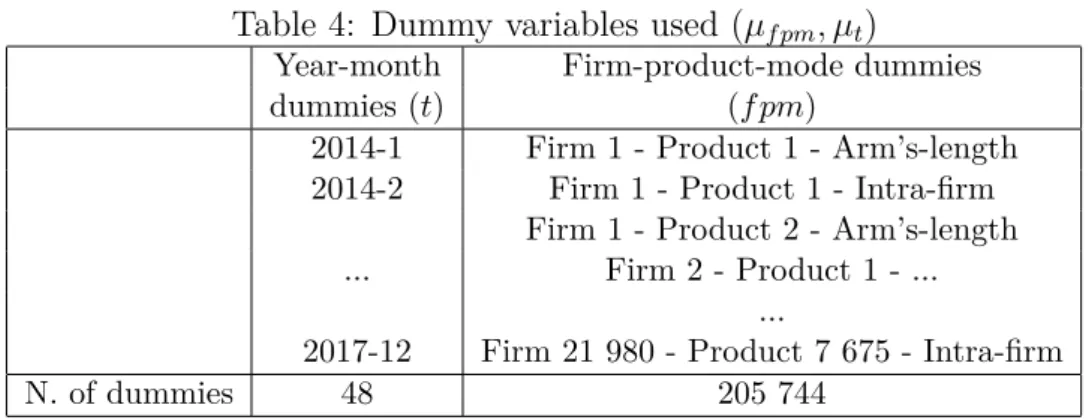
This model is almost similar to the one used by Clausing (eq. (7)), in that it aims to explain the logarithm of prices with a set of country-dependent regressors and fixed effects dummy variables using a difference-in-differences approach for arm’s-length and intra-firm price groups across tax rates in ex-port countries. Each exex-port price represents a combination of exex-porting firm, product type, month and destination country. In this particular model, there are two types of fixed effect dummies: an individual dummy is assigned for each year-month pair (µt), and another dummy is assigned for each unique
combination of firm-product-mode (µf pm), where mode stands for intra-firm
and arm’s-length group status. The dummy variables are illustrated in Table 4 and they act as a critical detail to control for time-specific and firm-product-mode-specific variation in prices. What is left for the country variables to explain is the variation unrelated to the attributes controlled by the dummy-variables. For example, in a group of cars exported intra-firm by a firm X, the observations differ only in their export country after the fixed effect dummies are used. The price variance of these observations are explained by a set of country-specific variables, which consist of the tax variable (Taxct), tax haven
dummy (Tax havenc), GDP per capita, distance from Finland in kilometers
and tariffs (Countryct).
Fixed effects regression is often called “within-estimation”, since creating dummy variables for different groups of observations makes it possible to focus only on within-group variation (Verbeek, 2017). Creating a dummy variable is identical to creating a new variable set, in which the mean value of the group is subtracted from the value of each observation. As a result, differences
Table 4: Dummy variables used (µf pm, µt)
Year-month Firm-product-mode dummies dummies (t) (f pm)
2014-1 Firm 1 - Product 1 - Arm’s-length 2014-2 Firm 1 - Product 1 - Intra-firm
Firm 1 - Product 2 - Arm’s-length ... Firm 2 - Product 1 - ...
...
2017-12 Firm 21 980 - Product 7 675 - Intra-firm
N. of dummies 48 205 744
between groups can no longer be compared, since their differences have been erased. The usual application of fixed effects is the difference-in-differences model as presented here, where group-dependent individual traits need to be controlled for to estimate the impact of treatment on one of the groups. By controlling for group-dependent characteristics, one is able to isolate the impact of treatment from all other possible sources of variation in differing outcomes for the two groups.
In this particular fixed effects regression model, variation in differing reac-tions to the tax rate by the two groups of interest, intra-firm and arm’s-length trade, are treated with extensive set of dummies so that group-specific traits are not affecting the estimates for country-specific variables. This is analo-gous to the traditional difference-in-differences model, in which group-specific traits do not affect the time-specific estimates, such as effects of treatment on treatment group. By this formulation, one is able to see if country-specific attributes, such as tax rate, affect prices, given that the variation between firms, products, years or months do not bias the results.
To control for unobserved country-specific traits, I follow Davies et al. (2018) and also use country fixed effects in some of the calculations. By creating dummy variables for each export country, one is able to ensure that no country specific trait that is not included in the regression model biases estimates for export mode specific effects. However, as country fixed effects are introduced, no country variables that are constant across time can be introduced to the model, since they are perfectly co-linear with the country
dummies (Asteriou and Hall, 2015). This includes tax rates, which implies that with country fixed effects, no estimate for effects of tax rate differences on prices can be obtained. Despite this drawback of country fixed effects, they do not cancel out the cross term of intra-firm group and a country variable – such as tax rate – which derives from the notion that variances of intra-firm prices and arm’s-length prices can differ within countries. Even if country fixed effects absorb possible effects of tax rates on the totality of export prices, the parameter estimate for the cross-term can be obtained, describing if the intra-firm prices react to tax rates different to prices in general.
5.2
Controlling for arm’s-length price manipulation
As suggested by Cristea and Nguyen (2016), MNEs practicing transfer mis-pricing may also have incentive to manipulate their arm’s-length prices. Ma-nipulated arm’s-length prices are used to make the difference to intra-firm prices look smaller, making it more difficult for the tax authorities to notice transfer mispricing. The possibility of arm’s-length price manipulation makes it crucial not to make conclusions on transfer mispricing on a single prod-uct, exported by a single firm to a single destination. Such identification has been implemented by Bernard et al. (2006), who calculate a price wedge by subtracting the “comparable uncontrolled price”, i.e. the closest comparable arm’s-length price, from the intra-firm price. Unfortunately, as the manipu-lated transfer price is compared with the closest arm’s-length price set by the same firm, there is a high probability that the arm’s-length price is also ma-nipulated by the MNE, which leads to a smaller price wedge underestimating the true magnitude of transfer mispricing.
In this research, the division of trade observations into categories of intra-firm and arm’s-length trade is made based on the geographic structure of the MNEs. Therefore, both the true intra-firm transactions and their closest com-parable arm’s-length prices are allocated to the same intra-firm group. Due to this, the intra-firm group contains also false cases of intra-firm trade, which are the prices most likely manipulated to hide transfer mispricing. Therefore, arm’s-length prices most likely manipulated are treated equally to transfer
prices. Most importantly, the arm’s-length prices most likely manipulated are not allocated to the control group, which would bias the reference group. To avoid biasing the results with respect to arm’s-length manipulation, prices set by a firm for a product are compared across each export destina-tion. The assumption is that arm’s-length manipulation would be the most probable within the same destination as the intra-firm manipulation, and by controlling with prices of all the destination countries, the effect of arm’s-length manipulation can be minimized.
5.3
Standard error clustering and additional models
Data consisting of clustered observations tend to have standard errors corre-lating within clusters (Cameron and Miller, 2015). In my export price data set, observations are clustered in multiple dimensions, including firm, product type, year, month and export country. This raises the need to control for stan-dard error clustering, since failing to do so when needed leads to misleadingly small standard errors, directly affecting the reliability of confidence intervals (Cameron and Miller, 2015). Davies et al. (2018) conclude to using standard error clustering at the country level in their similar data set and explain their choice to be the most conservative alternative. This means that compared to clustering standard errors on other dimensions, country level clustering gives the biggest standard errors and widest confidence intervals.
Other empirical papers using similar data and methods have also clustered their standard errors on a dimension of their choice. Cristea and Nguyen (2016) and Bernard et al. (2006) end up clustering at the country-year level, as do Vicard (2015) and Liu et al. (2017). The use of country-year fixed effects as opposed to Davies et al. (2018) may be due to the simple fact that Davies et al. use data for one year only. However, Cameron and Miller (2015) warn using country-year clustering when price shocks in a country may affect prices in later periods. Additionally, since by construction country-level has fewer clusters than country-year-level, country-level gives more conservative confidence intervals and should be applied as suggested by Cameron and Miller (2015). However, as previous literature exploiting observations for multiple