S
EX
D
IFFERENCES IN
G
ENERAL
I
NTELLIGENCE
A Psychometric Investigation of Group Differences in
Mean and Variability as Measured by
The Raven’s Standard Progressive Matrices
Emily Savage-M
cGlynn
This Dissertation is submitted for the degree of Doctor of Philosophy at
the University of Cambridge
This dissertation is my own work and contains nothing which is the outcome of word done in collaboration with others, except as specified in the text and Acknowledgements.
A Psychometric Investigation of Group Differences in Mean and Variability as Measured by the Raven’s Standard Progressive Matrices
Emily Savage-McGlynn, Emmanuel College
Researchers and the general public alike continue to debate ‘which is the smarter sex?’ Research to date suggests that males outperform females, females outperform males, while others find no differences in mean or variance. These inconsistent results are thought to occur for two reasons. First, studies rely on opportunity samples rather than samples that represent the general population. Second, researchers have not availed themselves of advances in psychometrics that allow for identification of bias in test items and the reliable evaluation of group differences. This dissertation addresses these two identified needs in the literature.
Using a large representative U.K. sample, 926 seven to 18 year olds were assessed with the Raven’s Standard Progressive Matrices Plus (SPM+), a measure considered to be one of the best measures of general intelligence. In assessing a one-factor model of general intelligence, four research aims were addressed. First, confirmatory factor analyses and assessment of measurement invariance revealed that the SPM+ is not biased to either sex. Second, multiple group confirmatory factor analyses revealed there to be no significant differences between males and females in either mean or variance. Third, analyses revealed no significant sex differences in mean or variability in younger or older participants. Finally, method effects of Gestalt and Visuospatial answering strategies explained some of the residual variance in the model. For the overall sample, males were significantly disadvantaged by the visuospatial element of some of the items. For older participants, the influence of the methods effects was equivalent.
sex difference in general intelligence. Future research should employ representative samples and robust statistical methodologies to assess sex differences on the Raven’s from a multiple factor perspective.
There are many people that I wish to thank for the help and support that I have received throughout the last four years, both professionally and personally.
First, this research was supported by the Cambridge Assessment Doctoral Studentship in Psychometrics. Further funding support has been gratefully provided by Emmanuel College. I would also like to extend immense thanks to the support of Pearson Assessment for the use of the Raven’s SPM data.
I extend great thanks to all of the study participants, their families and schools for taking part in the standardisation project. Further thanks to Lyn Dale and Vikas Dhawan who were administrators on the project and to the test examiners who collected data across the U.K. Special thanks to Dr. Paul Crane and Dr. David Good with whom I consulted in the early phases of this project and, with their guidance, feel that my work has been strengthened. My gratitude and appreciation to Irenee Daly, who has helped to make the process of doing a Ph.D. much more enjoyable, and in our joint attempts to become better writers, has read and improved many of these chapters.
My thanks and appreciation goes to Prof. Melissa Hines and Prof. John Rust who have supervised and guided me through my doctoral studies. My sincere appreciation and gratitude goes to Dr. Rosie Ensor for her thoughtfulness, insight and patience, without whom I’d still be agonising over Mplus and my analysis.
I extend my heartfelt thanks and gratitude to Lyn Dean for looking after Brendan for the last 3 years. Knowing he was so well cared for ensured I could focus on my studies, and ultimately get this PhD finished!
without you.
Finally, I must thank two very special people to whom I dedicate this dissertation. Kevin, you’ve been with me through every step of this very, very long journey. Words cannot express how thankful I am and how much I appreciate your support of my dreams – even when I couldn’t remember what they were or why I was striving for them. You constantly reminded me of the light at the end of the tunnel, even when I couldn’t see it.
To my Brendan Moo – in your own way, you have helped me through this Ph.D. more than anyone with your endless hugs, kisses and smiles. You make every day worthwhile, and in completing this, I hope to have shown you that any dream is possible.
PREFACE ... II ABSTRACT ... III ACKNOWLEDGEMENTS ...V TABLE OF CONTENTS ... VII LIST OF TABLES ... XI LIST OF FIGURES ... XIII LIST OF EQUATIONS ... XVI GLOSSARY OF ACRONYMS ... XVII 1.AN INTRODUCTION TO INTELLIGENCE: DEFINITION,MEASUREMENT,&
CONTROVERSY... 1
1.1. Introduction ... 1
1.2. Intelligence ... 2
1.2.1. What is Intelligence? ... 3
1.2.2. How is intelligence measured? ... 5
1.3. The Structure of Intelligence: One factor of intelligence or many? .. 8
1.3.1. One factor of general intelligence – g ... 9
1.3.2. Multiple factors of intelligence ... 11
1.3.3. Multiple factors of intelligence and g – a hierarchy ... 12
1.3.4. Are IQ scores increasing? The Flynn Effect ... 13
1.4. Summary ... 15
2.LITERATURE REVIEW:SEX DIFFERENCES IN INTELLIGENCE ... 17
2.1. Introduction ... 17
2.2. Why study sex differences? ... 19
2.3. Sex differences in Review ... 24
2.3.1. Sex differences in multiple abilities of intelligence ... 24
2.3.2. Sex differences in general intelligence ... 32
2.4.1. Gender Differences or Similarities? ... 62
2.5. Summary ... 63
3. METHODS ... 66
3.1. Introduction ... 66
3.2. Materials ... 66
3.2.1. Raven’s Standard Progressive Matrices Plus ... 66
3.2.2. Standardisation of the Raven’s Progressive Matrices ... 68
3.3. Participants ... 69
3.3.1. Recruitment ... 69
3.3.2. Data Protection and Ethical Considerations ... 70
3.4. Data Collection ... 71
3.4.1. Standardisation Test Administration ... 71
3.5. Final Standardisation Sample ... 73
3.5.1. Age and Sex ... 73
3.5.2. Ethnicity ... 75
3.5.3. Level of Parental Educational Achievement... 75
3.5.4. Geographic Region ... 76
3.6. Summary ... 77
4.STATISTICAL RATIONALE OF ANALYTIC TECHNIQUES ... 79
4.1. Introduction ... 79
4.2. Item Response Theory ... 80
4.2.1. Discrimination Parameter ... 82
4.2.2. Difficulty Parameter ... 83
4.2.3. Pseudo-guessing Parameter ... 84
4.2.4. The One-Parameter Logistic (1PL) Model ... 85
4.2.5. The Two-Parameter Logistic (2PL) Model ... 86
4.4. Confirmatory Factor Analysis ... 91
4.4.1. Measurement Invariance and Group Differences ... 93
4.5. Multiple-Groups Confirmatory Factor Analysis (MG-CFA) ... 95
4.5.1. Model Specificity and Evaluation ... 97
4.6. Summary ... 102
5.RESULTS CHAPTER 1: THE RAVEN’S SPM+ AT THE ITEM LEVEL - ITEM RESPONSE THEORY &THE RASCH MODEL ... 104
5.1. Introduction ... 104
5.2. Factor Analysis ... 105
5.2.1. Exploratory Factor Analysis ... 105
5.3. The Rasch Model ... 107
5.4. Understanding the SPM+ at the Item Level ... 108
5.4.1. Descriptive information ... 108
5.5. Exploratory Factor Analysis and the SPM+ ... 110
5.6. Rasch Model ... 117 5.6.1. Set A ... 118 5.6.2. Set B ... 120 5.6.3. Set C ... 122 5.6.4. Set D ... 124 5.6.5. Set E ... 126 5.7. Summary ... 130
6.RESULTS CHAPTER 2:ASSESSMENT OF GROUP DIFFERENCES IN MEAN AND VARIABILITY USING MULTIPLE GROUPS CONFIRMATORY FACTOR ANALYSIS ... 132
6.1. Introduction ... 132
6.2. Model Specification & Measurement Invariance ... 136
6.2.1. MG-CFA Males and Females Simultaneously ... 148
6.4.1. Model Specification and Measurement Invariance ... 155
6.5. Summary ... 159
7. RESULTS CHAPTER 3:ASSESSMENT OF GROUP DIFFERENCES IN MEAN AND VARIABILITY USING MULTIPLE GROUPS CONFIRMATORY FACTOR ANALYSIS OF YOUNGER &OLDER PARTICIPANTS OF THE SPM+ ... 161
7.1. Introduction ... 161
7.2. Model specification & Measurement Invariance ... 165
7.3. Assessment of Sex Differences in Latent Mean and Variability in Younger & Older Participants ... 175
7.3.1. Younger and Older Males and Females ... 176
7.3.2. Younger Males and Females ... 177
7.3.3. Older Males and Females ... 178
7.4. Methods Factor ... 178
7.5. Summary ... 180
8. DISCUSSION ... 183
8.1. Introduction ... 183
8.2. Male & Female Measurement Equivalence and Sampling issues in the SPM+... 184
8.3. Sex Differences in Mean and Variability of the Overall Sample ... 187
8.4. Differences in Mean and Variability at Younger and Older Ages . 191 8.5. Influence of Method Effects ... 195
8.6. Summary of Findings ... 198
8.7. Strengths, Limitations, & Future Research Directions ... 199
Appendix 1:Parent Information Letter ... 205
Appendix 2:Parental Consent Form ... 208
Table 1: Details of age and sex of the SPM+ standardisation sample ... 74
Table 2: Details of age groups by sex of the SPM+ standardisation sample ... 75
Table 3: Details of parental educational achievement of the SPM+ standardisation sample ... 76
Table 4: Details of geographic region of the SPM+ standardisation sample ... 77
Table 5: Item means and standard deviations for males and females ... 109
Table 6: Mean, minimum and maximum total scores for the overall, younger and older samples of the SPM+ ... 110
Table 7: Eigenvalues from the EFA from the female and males samples of the SPM+... 112
Table 8: Goodness-of-fit statistics for one, two-, and three-factor solutions for the SPM+ ... 114
Table 9: Minimum, maximum, and average factor loadings for the one-, two-, and three-factor solutions ... 116
Table 10: Item difficulties of Items in Set A for males and females ... 118
Table 11: Item difficulties of Items in Set B for males and females ... 120
Table 12: Item difficulties of Items in Set C for males and females ... 122
Table 13: Item difficulties of Items in Set D for males and females ... 124
Table 14: Item difficulties of Items in Set E for males and females ... 126
Table 15: Items of the SPM+ for males and females ordered from easiest to most difficult. ... 128
Table 16: Average item difficulty of all item sets for males and females .... 130
Table 17: Correlation matrix for male 1-factor model ... 137
Table 18: Correlation matrix for female 1-factor model ... 138
Table 19: Unstandardised parameter estimates, indicator thresholds, and proportion of variance explained (R2) for males and females ... 140
thresholds, proportion of variance explained (R2) and factor
variance for male and female 1-factor models ... 142 Table 21: Model fit statistics and chi-square difference tests ... 155 Table 22: Results of the EFA of residual variance ... 156 Table 23: Minimum, maximum and average factor loadings, indicator
thresholds and proportion of variance explained (R2) for a 1-factor
model with a methods factor for males and females ... 158 Table 24: Model fit statistics for a one-factor model of the SPM+ for
young males, young females, older males and older females ... 166 Table 25: Minimum, maximum and average factor loadings, indicator
thresholds, proportion of variance explained (R2) and factor
variance for 1-factor models for younger males, younger females, older males and older females ... 167 Table 26: Unstandardised parameter estimates, indicator thresholds,
and proportion of variance explained (R2) for younger males and
younger females ... 170 Table 27: Unstandardised parameter estimates, indicator thresholds,
and proportion of variance explained (R2) for older males and
older females ... 172 Table 28: Summary of model fit statistics and chi-square ... 180
Figure 1: Example of an item similar to those in the Raven’s Progressive
Matrices. ... 7
Figure 2: Water-level Test ... 25
Figure 3: A biopsychosocial model as a framework for understanding cognitive sex differences. ... 57
Figure 4: Details of Ethnic Groups in the SPM+ Standardisation Sample ... 75
Figure 5: Normal Ogive Curve or the 1-Parameter Logistic Model ... 81
Figure 6: Low versus high item discrimination ... 83
Figure 7: Locating the difficulty of an item on the ability / difficulty axis ... 83
Figure 8: Low versus high item difficulty ... 84
Figure 9: Item Characteristic Curves of five items in a 1PL model. ... 86
Figure 10: Item Characteristic Curves of 3 items in a 2PL model ... 87
Figure 11: Scree plot of eigenvalues for the male sample of the SPM+ .... 113
Figure 12: Scree plot of eigenvalues for the female sample of the SPM+ . 113 Figure 13: Female Sample Item Characteristic Curves for the Rasch Model of Item Set A of the Raven's SPM+ ... 119
Figure 14: Male Sample Item Characteristic Curves for the Rasch Model of Item Set A of the Raven's SPM+ ... 119
Figure 15: Female sample Item Characteristic Curves for the Rasch Model of Item Set B of the Raven's SPM+ ... 121
Figure 16: Male sample Item Characteristic Curves for the Rasch Model of Item Set B of the Raven's SPM+ ... 121
Figure 17: Female sample Item Characteristic Curves for the Rasch Model of Item Set C of the Raven's SPM+... 123
Figure 18: Male sample Item Characteristic Curves for the Rasch Model of Item Set C of the Raven's SPM+... 123
Figure 19: Female sample Item Characteristic Curves for the Rasch Model of Item Set D of the Raven's SPM+... 125
Model of Item Set D of the Raven's SPM+... 125 Figure 21: Female sample Item Characteristic Curves for the Rasch
Model of Item Set E of the Raven's SPM+ ... 127 Figure 22: Male sample Item Characteristic Curves for the Rasch
Model of Item Set E of the Raven's SPM+ ... 127 Figure 23: Diagram of the One-Factor MG-CFA for Males and Females ... 139 Figure 24: Male Item Characteristic Curves for the MG-CFA of Item
Set A ... 143 Figure 25: Female Item Characteristic Curves for the MG-CFA of
Item Set A ... 143 Figure 26: Male Item Characteristic Curves for the MG-CFA of
Item Set B ... 144 Figure 27: Female Item Characteristic Curves for the MG-CFA of
Item Set B ... 144 Figure 28: Male Item Characteristic Curves for the MG-CFA of
Item Set C ... 145 Figure 29: Female Item Characteristic Curves for the MG-CFA of
Item Set C ... 145 Figure 30: Male Item Characteristic Curves for the MG-CFA of
Item Set D ... 146 Figure 31: Female Item Characteristic Curves for the MG-CFA of
Item Set D ... 146 Figure 32: Male Item Characteristic Curves for the MG-CFA of
Item Set E ... 147 Figure 33: Female Item Characteristic Curves for the MG-CFA of
Item Set E ... 147 Figure 34: Diagram of the One-Factor MG-CFA for Males ... 149 Figure 35: Diagram of the One-Factor MG-CFA for Females ... 150
L
IST OFE
QU ATIONSEquation 1: Cohen's d for the calculation of effect
sizes ... 23 Equation 2: Normal ogive curve ... 82
Acronym
Definition
1PL One Parameter Logistic Model 2PL Two Parameter Logistic Model APM Advanced Progressive Matrices CAT Cognitive Abilities Test
CFA Confirmatory Factor Analysis CFI Comparative Fit Index
CPM Coloured Progressive Matrices CTT Classical Test Theory
DAT Differential Aptitude Test DIF Differential Item Functioning EFA Exploratory Factor Analysis
FSIQ Full Scale Intelligence Quotient
g General Intelligence Gc Crystallised Ability
GCSE General Certificate of Secondary Education
Gf Fluid Ability Gs Perceptual Speed Gv Spatial Visualisation ICC Item Characteristic Curve IQ Intelligence Quotient IRT Item Response Theory
MG-CFA Multiple Group Confirmatory Factor Analysis
MIMIC Multiple Indicator Multiple Causes
ML Maximum Likelihood Estimator
NNAT Naglieri Nonverbal Ability Test
PCA Principal Components Analysis
RMSEA Root Mean Square Error of Approximation
SAT Scholastic Aptitude Test SEM Structural Equation Modelling SES Socio-Economic Status
Acronym
Definition
SPM+ Standard Progressive Matrices Plus
SRMR Standardised Root Mean Square Residual
TLI Tucker-Lewis Index
WAIS Wechsler Adult Intelligence Scale
WISC Wechsler Intelligence Scale for Children
WLSMV Weighted Least Means Squares Estimator
—
1 —
A
N
I
NTRODUCTION TO
I
NTELLIGENCE
:
D
EFINITION
,
M
EASUREMENT
,
&
C
ONTROVERSY
“The answer to the question of which is the smartersex depends on how ‘smart’ is defined” (p. 230, Halpern & LaMay,
2000).
1.1.
I
NTROD UC TIONSex differences in intelligence continues to captivate psychologists and the general public alike, as evidenced by the ever-increasing collection of empirical research, books, informed commentary, and popular culture. No other concept in psychology has generated more debate (Johnson, 2004), and may arguably be the longest-running and most impassioned controversy in psychology’s history (Halpern, In Press). This dissertation contributes to the debate by providing a psychometrically robust evaluation of sex differences in general intelligence as measured by the U.K. standardisation edition of the Raven's Standard Progressive Matrices Plus (SPM+; Raven, Court, & Raven, 2008). The representativeness of the U.K. population, the size and recency of this sample and robustness of analyses are novel contributions to the literature.
The very nature of intelligence lends itself to debate. The subject of intelligence is the most studied and likely the most understood subject in psychology, yet there remain many “unknowns” (Gottfredson & Saklofske, 2009). The field is rife with disagreement over a number of central issues at its very foundation: conflicting definitions and theoretical perspectives,
disagreement over measurement practices and methodology, and questionable research practices and conclusions. Before reviewing the literature on sex differences in general intelligence, the field of intelligence will first be introduced. In order to effectively discuss group differences in intelligence, it is important to first establish some general understandings of the field of intelligence: its origins, how it is defined, and the conceptual issues that lie therein. A brief, overview of the relevant theory and literature will be provided, acknowledging, but not aligning to, different theoretical perspectives. In so doing, particular attention will be paid to the contentious issues mentioned above, by addressing the following questions:
1. What is intelligence?
2. How is intelligence measured?
3. What is the structure of intelligence? Is there one type of intelligence or many?
4. Are IQ scores rising over time?
By addressing these questions, the discussion of sex differences will be placed into context of the field as a whole. This will allow for more insightful understanding in subsequent chapters of the underlying issues as to why the subject of intelligence and sex differences is still being so fiercely debated and still worthy of investigation.
1.2.
I
NTEL LIGENCEIntelligence, as a concept, has been with us for millennia. The theoretical concept of intelligence and the comparison of individuals with respect to their intellect was recognized and noted as early as 6th Century B.C. by one of the most ancient of Greek writers, Homer: "So true is it that the Gods do not grace all men alike in speech, person, and understanding" (Homer, 2007, p. 63).
Since that time, academics and laymen alike have regarded intelligence as a topic of considerable interest (Cianciolo & Sternberg, 2004), and remains one of the most highly regarded personal attributes, second only to good health (Gottfredson, 1998). It also remains a topic of intense academic focus, evidenced by the vast collection of literature, empirical research and commentary on the subject that continues to amass in present
day. A recent search on Google Scholar generated 1,570,000 results while the more empirically-focused PsycInfo database generated 155,555 results. These vast numbers provide a quantitative indication of just how much people want to know and share what they know about intelligence. There is likely to more written about intelligence than any other subject in psychology (Johnson, Carothers, & Deary, 2008).
Like other topics of great social interest, it is not without its controversies. At the centre of the debate are methodological issues, specifically how best to define and measure intelligence (Halpern & LaMay, 2000). The concept of intelligence is different according to ones’ own theoretical perspective, inherent biases, and conceptions with seemingly as many definitions of intelligence as there are investigators of it (Sternberg, 1985).
1.2.1. What is Intelligence?
The seemingly simple question – ‘What is intelligence?’ – has generated much debate and discussion in the search for a conclusive answer (Mackintosh, 2001; Neisser, Boodoo, Bouchard Jr., et al., 1996) and the search continues. Throughout the literature, intelligence is defined in a number of ways, each slight variations of the next: “Innate general cognitive ability” (p. 187, Burt, 1955); “the ability to understand complex ideas, to adapt effectively to the environment, to learn from experience, to engage in various forms of reasoning, to overcome obstacles by taking thought” (p. 77, Neisser, Boodoo, Bouchard Jr., et al., 1996); “The aggregate or global capacity of the individual to act purposefully, to think rationally, and to deal effectively with his environment” (p. 3, Wechsler, 1944); “The mental capacity of emitting contextually appropriate behaviour at those regions in the experiential continuum that involve response to novelty or automatisation of information processing as a function of meta-components, performance components, and knowledge-acquisition components” (p. 319, Sternberg, 1985); “Superior understanding; quickness of mental apprehension, sagacity” (Oxford University Press, 1999).
What these different definitions illustrate is that, as a concept, there is certainly a general understanding of what is meant by the term “intelligence”;
it is something that everyone knows and understands at some level, yet is elusive to finding a concrete definition that everyone would agree upon wholeheartedly. The classic tale of three blind men and an elephant is a lovely illustration of the varying conceptions of intelligence.
Never having encountered an elephant previously, three men had different impressions after each touching a different part of the animal’s body. The first man touched the trunk and thought the elephant was snake-like; the second man touched the leg and believed it to be like a tree; the third man felt the elephant’s side and believed it to be like a wall. Of these three differing interpretations of an elephant, which was correct – all or none? Like the blind men, those who currently study intelligence cannot see what is being studied (Sternberg, 1990). In “feeling” and “exploring” intelligence in different ways, different theorists arrive at different definitions. While some might argue that differing conceptions of the same issue are cause for concern, Neisser et al. (1996a) argue that differing conceptions of intelligence need not be seen as problematic, but rather an opportunity for greater understanding.
In an attempt to further understand the nature of the differing definitions, a number of psychologists asked 2 groups of people, one group of psychologists who studied human intelligence, and another group of non-psychologists, to describe characteristics of an intelligent person. The responses from the 2 groups were not identical but were qualitatively similar, which can be classified into three categories of intellectual functioning: problem-solving ability, verbal intelligence, and practical intelligence or social competence (Sternberg, 1982).
What is evident from the first two categories is that, for many, intelligence is conceived of as those abilities and skills that one needs to be successful in formal education (such as reading, writing, and mathematics). However, as evidenced by the third category, others would argue that there are other types of intelligence that are more difficult to assess: creativity, social skills, physical and kinaesthetic. Sternberg’s Triarchic Theory (1985) and Gardner’s Theory of Multiple Intelligences (1993) are comprised of multiple abilities to conceptualise intelligence of the individual as a whole. While both theories have made important contributions to the field of intelligence research, the focus of this dissertation will remain on the
perspective of intelligence that is cognitively-based and psychometrically testable.
1.2.2. How is Intelligence Measured?
From the time of the ancient Greeks, there has been the implicit understanding of the mental abilities of an individual. However, it was not until the late 19th Century that attempts were made to explicitly quantify intelligence in order to better understand it. What resulted was the development of the intelligence test. Intelligence tests hold an important place in modern Western society and are widely used in many settings. They are used for diagnosis, evaluation, and selection (Neisser, Boodoo, Bouchard, et al., 1996), and their use has changed very little from the time when they were first conceptualised.
Sir Francis Galton
The original concept of assessing an individual’s intelligence is most often attributed to Sir Francis Galton. While most of his work focused upon the evaluation of sensory functioning (such as “keenness of sight and hearing”, “breathing power”, and “force of blow”; p.245, Galton, 1908), his underlying belief was that inherited differences in sensory discrimination ability were positively correlated with intellectual ability (Brody, 1992). Although the methods proposed by Galton for the assessment of intellectual functioning were later discredited, it was his influence that inspired future generations of psychologists, such as Alfred Binet and Théodore Simon.
Alfred Binet
The French Ministry of Public Instruction charged Alfred Binet with the task of devising a diagnostic instrument to quickly and reliably assess a child’s ability to be effectively educated in a normal school environment (Binet, 1905). The resulting test contained items that required the child to perform a variety of mental tasks, such as naming parts of the body, remembering list of digits, copying designs from memory, and comparing weights and measures. In assessing intellectual competence, test items were ordered according to the age at which the majority of the children in the
sample could solve them. This allowed him to determine whether a child’s test performance was average, advanced or delayed relative to his peers and in so doing, established the model upon which the majority of psychometric measures are now based - test scores of the individual are compared to the normative reference group to assess their relative fit (Mackintosh, 2001).
Modern Psychometric Testing
While the test devised by Binet and Simon (1905) set the standard at the time, it was the considerable number of revision and adaptations that followed that proved to make significant contributions to the field of psychometrics. These are notably the Stanford-Binet (Terman, 1916), and two of the most important and widely used measures currently in use: the Wechsler Scales of Intelligence (Wechsler, 1997; 2003) and the Raven’s Progressive Matrices (Raven, Raven, & Court, 1998a). In developing the Stanford-Binet Intelligence Scale, Terman obtained much more accurate information about normative age-related results allowing him to establish the definition of IQ: (mental age / chronological age) x 1001.
Just as with the Stanford-Binet, the Wechsler Intelligence Scales for Children (WISC) and for Adults (WAIS) were designed to measure different aspects of cognitive functioning. They are individually administered clinical instruments consisting of 15 subtests such as Vocabulary (where the participant must provide definitions of presented words), Picture Completion (where the participant is asked to identify the missing portion of an image within a time limit), and Block Design (where the participant is asked to re-create a design using coloured blocks within a time limit). The subtests are thought to measure different aspects of intellectual functioning: verbal comprehension, perceptual reasoning, working memory, and processing speed. Together they provide a Full Scale Intelligence Quotient (FSIQ) which is the modern conception of IQ defined by Terman (above).
In contrast to the multiple subtest structure of the WISC and the WAIS, the Raven’s Matrices was designed with one measurement objective:
1
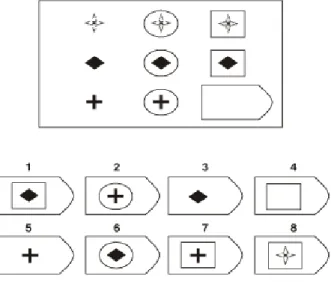
to assess general cognitive ability (Raven, 2009). The Matrices were constructed as a measure of the educative component of g (Raven, Court, & Raven, 2008), which is the ability to forge new insights, to discern meaning in confusion, to perceive, and to identify relationships (Spearman, 1927). Due to its very clear measurement objectives, the Matrices are often used in investigations of sex differences in general intelligence, or g (Raven, Court, & Raven, 2008; Lynn, Allik, & Irwing, 2004). The Matrices are comprised of one type of item that assesses analogical reasoning and completion tasks (Figure 1). The examinee is presented with a 3 x 3 matrix of diagrams, where the 3rd diagram in the 3rd row missing.
Figure 1. Example of an item similar to those in the Raven’s
Progressive Matrices
(Costa, Azambuja, Portuguez, & Costa, 2004).
The examinee is asked to choose, from a number of alternatives, the item that will complete the 3rd row. A discussion of sex differences as measured by the Raven’s Matrices will be provided in Chapter 6, while further technical information of the measure will be provided in Chapter 3.
Despite being designed as a unidimensional assessment of general cognitive ability (Raven, 2009), there continues to be considerable debate in the literature about what the Raven’s Progressive Matrices is actually measuring: one factor of general intelligence (Jensen, 1998; Spearman, 1927) or multiple factors of different abilities (Gustafsson, 1984; Lynn, Allik, & Irwing, 2004; van der Ven & Ellis, 2000). Further discussion of the
literature pertaining to the factor structure of the Raven’s Matrices will be provided in Chapter 2.
Another controversy central to the field of intelligence is highlighted in considering different scales of intelligence based on contrasting theoretical structures (i.e., the Wechsler scales versus the Raven’s Matrices), and different theoretical perspectives on the same scale of intelligence (i.e., the numerous ways to view the Raven’s Progressive Matrices). Just as there are a number of ways to define intelligence, and different ways to measure intelligence, there are also many ways to conceptually organise what the intelligence tests are measuring.
1.3. T
HES
TRU CTURE OFI
N TELLIGE N CE:
O
NE F AC TOR OF IN TELLIGEN CE OR M AN Y?
In assessing intelligence through the use of measures such as the Wechsler scales and the Raven’s Matrices, psychometricians have identified a wide range of cognitive abilities2 that are conceptually distinct from one another, and yet statistically related, most often determined through the application of factor analysis.
When considering a collection of related indicators (such as a series of items on an intelligence test), factor analysis techniques serve to understand the variation and covariation, or patterns of relationship, among a collection of test items in the simplest, most parsimonious manner (Brown, 2006). The resulting factor structure provides suggestions about underlying causes of the covariation.
Explanations of the factor structure of intelligence can vary between theorists depending on their underlying theoretical conceptions of intelligence. Herein lays the “fuel” that fires the debate about the structure of intelligence that has existed since the time when intelligence began to be measured.
No other concept of psychology has generated more debate and may
2
Cognitive abilities are understood to be theoretical constructs that represent the underlying components of intelligence (Halpern, 2000).
arguably be psychology’s “longest-running and most acrimonious controversy” (p. 24, Halpern, In Press). Some theorists argue that intelligence comprises a number of separate elements of intelligence, such as verbal, spatial or analytic abilities (Gardner, 1993; Thurstone, 1931; Thurstone, & Thurstone, 1941). A conception of intelligence comprised of multiple abilities is often referred to as “modularity” (Halpern, In Press). Others focus on the variance that all such abilities have in common, what is commonly known as general intelligence or g (Spearman, 1927). This unitary view of intelligence is often referred to as “molarity”. Others still conceive of intelligence as a combination of these two approaches, in something of a hierarchical arrangement of multiple factors, with an overarching general factor, g, at the top (Carroll, 1993). These will now be discussed.
1.3.1. One Factor of General Intelligence – g
In the early study of intelligence, it was noted that people who performed well on one kind of mental test were likely to perform well on others (and similarly for those who performed poorly; Demetriou, Mouyi, & Spanoudis, 2008; Gottfredson, 1998). This commonality suggested some universal element that has come to be known in the literature as ‘general intelligence’ or g.
This universal concept of general intelligence was first statistically described by Spearman (1927) after determining, through the application of principle components analysis, that much of the variability in people’s intelligence test scores could be attributed to one single, common factor. His principle of the indifference of the indicator countered the argument made by Thurstone that an understanding of intelligence was intrinsically linked to the test content. Rather, Spearman believed that the only concern was item g-loadings: because all IQ tests correlate highly with one another, a general factor extracted from one test would be the same as one extracted from another measure.
Although Spearman acknowledged factor analysis, and g, as the description of a pattern of interrelationships among any number of different intelligence tests, he also acknowledged that this description is not the same
as identifying human abilities (Mackintosh, 2001). Rather, he saw the pattern of interrelationships as indicative of an underlying psychological process, a type of mental energy (Howe, 2000).
This conceptualisation of g continues to be another contentious point of disagreement in the intelligence literature. To some, g is described in such a way that suggests that it is a tangible entity, an “active ingredient” (p. 34, Rushton, 1995) that someone either has or doesn’t have in a finite amount. This conceptualisation has been vehemently disputed with “no convincing reason...for insisting that g is something real” (Howe, 2000, p. 30). g is simply a means for statistically describing commonalities among a series of test items designed to assess cognitive functioning. By conceptualising g as something one has or doesn’t have runs the risk of sentencing individuals into categories of ability, rather than measuring individuals for their cognitive potential.
A closer look at Spearman’s theory reveals the finer points of his notion of the general factor of intelligence: that there are, in fact, two factors (Colom & García-López, 2002; Mackintosh, 2001). The general factor, as previously described, that accounts for the correlations among different tests as well as a secondary specific sub-factor unique to each test. Together they form “the two-factor theory of intelligence” (Spearman, 1927). He described the specific factors (or s) as those processes needed to solve a specific type of problem, or “nuts and bolts” of intelligence, while the energy to drive to overall “intelligence engine” came from the general factor (Mackintosh, 2001).
This discussion of variations of interpretations highlights the importance with which results of intelligence research ought to be considered – with caution and with awareness of how they fit within the larger context of social understanding. Factor analysis can simply describe relationships among different sets of items and different tests, which is distinctly different to determining the structure of human abilities (Mackintosh, 2001). A relationship between constructs does not necessarily imply cause and effect.
1.3.2. Multiple Factors of Intelligence
Many theorists conceptualise intelligence as a complement of several different intellectual abilities (Halpern, n d)). Drawing a parallel to the variety of psychometric tests that are available to assess intelligence, the multiple factor perspective would be akin to the Wechsler scales, measuring different abilities in separate subtests. But even among those theorists who believe intelligence is comprised of different abilities, they do not agree on how many different abilities there are.
Moving on from Spearman’s findings of g and s, Cattell (1970) believed there to be more than one second-order factor. He proposed that g
could be divided into two separate sub-factors: fluid and crystallised ability. He and Horn (1966) went on to subsequently propose nine ability factors including crystallised ability (Gc), the accumulation of knowledge and skills, and fluid ability (Gf), the capability of abstract reasoning and flexibility of thought. These were then further fractioned into spatial visualisation (Gv) and perceptual speed (Gs) among others (Mackintosh, 2001). Carroll (1993) suggests that it will be infinitely possible to further decompose these broad factors into more specific, subsidiary factors.
Another model that continues to receive wide support is that proposed by Thurstone and Thurstone (1941). They believed that the content of test items intrinsically influenced the outcome of factor analysis, and consequently, upon the interpretation of a theory of intellectual abilities. Their extensive factor analysis of 60 different intelligence tests revealed three categories of abilities: verbal, number (quantitative), and perception (visual-spatial). These three factors of intelligence are still widely referred to in the current literature.
Another particularly influential model of multiple factors of intelligence is Gardner’s Theory of Multiple Intelligences (1993). In his book Frames of Mind, Gardner contested that traditional IQ tests only measure a sub-set of abilities, and to effectively assess an individual’s overall level of ability, it is important to account for other non-traditional aspects of intelligent functioning. In total, Gardner has proposed seven different intelligences: linguistic, spatial, logical-mathematical, musical, bodily-kinaesthetic, interpersonal, and intrapersonal. Each of these ‘frames of mind’ was arrived at through different sources of evidence, not only psychometric evaluations.
Not all intelligence experts agree with Gardner’s definitions of alternative abilities, and some would argue that according to Gardner’s criteria for identifying intelligence, a far greater range of abilities would be possible with virtually any specific skill or cognitive operation qualifying to be defined as an ‘intelligence’ (Mackintosh, 2001; Brody, 1992; Sternberg, 1990).
While they differ in conceptualisation and configuration of their factors, the notion of multiple abilities in intelligence is still widely accepted and further discussion will be provided in relation to sex differences in Chapter 2. While theories of multiple factors of intelligence (such as those proposed by Thurstone & Thurstone, [1941] and Gardner, [1993]) continue to make important contributions to the field of intelligence research, the focus of the current dissertation will remain aligned with the conceptual framework of the Raven’s Progressive Matrices, and hence, upon a one-factor model of general intelligence.
1.3.3. Multiple Factors of Intelligence and g – A Hierarchy
An alternative way to view intelligence combines the single factor and multiple factor perspectives just described, in something of a compromise. Rather than a collection of multiple unrelated abilities or one single g, intelligence can be conceptualised as a hierarchy of different abilities with g
overarching them all. While acknowledging the many meaningful separate factors exist, an extensive literature review by Brody (1992), concluded that “the structure of abilities tests supports a hierarchical model of ability with g at its apex” (p.40).
It could be argued that by describing intelligence in this hierarchical configuration allows for ‘the best of both worlds’: the specificity and attention to detail of the multiple factor perspective with the parsimony and simplicity of the general factor model. The fact remains that performance on one kind of intelligence test correlates highly with performance on all other kinds of tests, and due to this “positive manifold” (Spearman, 1927), a large general factor will always be obtained through factor analytic investigations (Mackintosh, 1995; 2001).
Despite the differing theoretical perspectives on the structure of intelligence, the strength of g continues to be supported. It is upon the
strength of the general factor that this dissertation is established.
1.3.4. Are IQ scores increasing? The Flynn Effect
Another issue that has arisen in the intelligence literature in recent years pertains to the worldwide generational increase in IQ scores over time – known as the Flynn Effect. James Flynn (1987) identified that, in the last 50 years, IQ raw scores have increased by more than 15 points (or approximately 3 IQ points per decade). The greatest gains appear to be on tests that are designed to be free of cultural influence, such as the RPM, and the rate of gain may be increasing.
Reasons for this increase are unclear. One explanation for these gains has often been the increasing sophistication in measurement practices. Intelligence tests are often ‘re-standardised’ in order to account for increasing population intelligence (Neisser, Boodoo, Bouchard Jr., et al., 1996). As part of the process, the mean score of the new standardization sample is recalibrated to 100. In doing so, increases in population IQ are often masked. This means that if 20 years had elapsed between standardisation editions, a group of people tested on both versions would, for example, score 106 on the older version but 100 on the newer version. Some would argue that the steady increase in IQ scores described by Flynn is too large to result from increased test sophistication and improved testing practices (Neisser, Boodoo, Bouchard Jr., et al., 1996), and they must therefore be attributable to the abilities of the test takers themselves.
Improvements in nutrition have been offered as another explanation (e.g., Roberto Colom, Lluis-Font, & Andres-Pueyo, 2005). (Lynn, 1990) noted large nutritionally-based increases in height during the same period as the IQ gains, and Neisser et al. (1996a) question whether nutrition might also have increased brain size, and therefore are responsible for the rise in IQ. They do note that a clear causal relationship between nutrition and intelligence has yet to be conclusively established.
Flynn (2009) refutes the relationship between nutrition and IQ gains, claiming that the two trends are largely independent on strength of multiple factor analyses of numerous standardisations of the Raven’s Standard Progressive and Coloured Matrices. Flynn himself says “Enhanced nutrition
has made us taller people and poorer nutrition has made us more obese. But our diet today probably does not make us very different people from our grandparents as far as cognitive competence is concerned” (p. 26, 2009). Further he maintains that increases in IQ do not necessarily indicate an increase in intelligence (personal communication, October 11, 2010).
Rather, Flynn (2009) attributes the gains to the Industrial Revolution and increasingly sophisticated educational practices. There is no question that there are notable cultural differences between successive generations with respect to the accumulation of information and knowledge. Daily life and occupational experience seem more complex today than ever before. For example, The New York Times contains more information in one week day edition than the average person was likely to come across in a lifetime in 17th century England (Wurman, 2000). Populations are becoming increasingly urbanised, children stay in school longer than ever before, and almost everyone seems to be encountering new forms of cognitively complex experiences through television and the internet. Through such experiences, cognition has developed accordingly, and is qualitatively different to that of previous generations resulting in a group of people who are better at solving the problems that are relevant to them (Flynn, 2009).
Another possible explanation of the IQ gains of the Flynn Effect is measurement bias that arises from something other than the latent construct of intelligence. One such explanation might be Differential Item Functioning (DIF). DIF can occur when people of the same level of intelligence from different groups (such as different generations or sexes) have a different likelihood of giving a correct answer on an intelligence test due to something inherent in the test item itself. For example, within the context of increased exposure to technology, different generations will likely have different exposure to completing spatial tasks that are common in video games (Feng, Spence, & Pratt, 2007; Subrahmanyam & Greenfield, 1994). Test items, like those on the RPM that assess spatial ability, will likely be easier for current generations not because they are more intelligent, but because the current generation will have considerably more experience with spatial tasks like these. Consequently, these items are biased against members of previous generations. Through the advent of modern statistical techniques such as Structural Equation Modelling (SEM) and Multiple Groups
Confirmatory Factor Analysis (MG-CFA), it is increasingly possible to investigate such sources of measurement bias. It is clear that the Flynn effect has yet to be understood fully from the perspectives of psychometrics (Wicherts, 2008).
With better understanding of the nuances of group differences in intelligence, whether they are groups of males and females or groups of individuals at different points in history, through the use of advanced statistical modelling techniques we will begin to gain a better understanding of human intelligence. The current dissertation will be employing SEM and MG-CFA techniques with the U.K. standardisation data of the SPM. The use of these sensitive statistical methods is unprecedented in the literature, and is considered a further strength of this dissertation.
1.4. S
UMMAR YWhile it is true that a great deal is known about intelligence, there is arguably still much to understand about this complex topic. What is most apparent from a review of the literature pertaining to intelligence is that there is disagreement on a number of accounts pertaining to the definition of the construct, the method of measurement and its structure. The extent of the debate and lack of consensus needn’t be considered an obstacle, as discussed by Neisser et al. (1996), but rather as an opportunity to learn more about intelligence.
When prominent theorists were asked to provide a definition of intelligence, each gave a different definition (Sternberg & Detterman, 1986). For some psychologists, intelligence is considered a collection of many different abilities. “Individuals differ from one another in their ability to understand complex ideas, to adapt effectively to the environment, to learn from experience, to engage in various forms of reasoning, to overcome obstacles by taking thought” (p. 77, Neisser et al., 1996). From a different perspective, separate intellectual abilities are found to be positively correlated with one another, leading many psychologists to view intelligence as a single, general construct, g.
Equally contentious is the debate of measurement. Since the time of Binet and Galton, there has been a debate about the best way to measure
intelligence. Some would argue that “there is no single true measure of intelligence because there is no single thing called intelligence” (p. 582, Mackintosh, 1995), as evidenced by Gardner’s Theory of Multiple Intelligences. For those who conceptualise intelligence in terms of multiple cognitive abilities, a multiple subtest approach is most appropriate, as is seen in the WISC or the WAIS. For those who conceive of intelligence in terms of one general intelligence, g, tests such as the Ravens are considered to be optimal.
While there is much value in each of these perspectives, in order to present a cohesive argument throughout this dissertation, it is necessary to align with certain theoretical perspectives and not others. The main objective of this dissertation is to assess whether there exists sex differences in general intelligence using modern statistical modelling methods. As such, the focus will remain upon the unidimensional construct of general intelligence as measured by the Raven’s Progressive Matrices.
In light of the review of the contentions in the field of intelligence, it is now appropriate to proceed with a comprehensive review of the relevant literature that pertains to sex differences in intelligence in Chapter 2.
—
2 —
L
ITERATURE
R
EVIEW
:
S
EX
D
IFFERENCES IN
I
NTELLIGENCE
2.1. I
NTROD UC TIONSince before the time when tests of intelligence were first developed by Binet (1905) and Galton (1908), there has been great interest in differences between people: what it means for one person to be more intelligent than another, and how these differences may have arisen. Herein lays the focus of this chapter.
Of the many controversial issues that are found in the literature on intelligence, “few have generated more heat and less light” (p. 559, Mackintosh, 1996) than the discussion of group differences in average IQ, particularly with respect to differences between males and females. Much has been written on the subject, and still there has yet to be a consensus reached. Despite this lack of consensus, the subject continues to gain interest with the number of publications on this topic soaring. A recent search for sex differences and intelligence on PsycINFO returned over 86,000 entries, while a search on Google Scholar returned 652,000 suggestions for empirical articles on the subject.
Throughout this extensive literature, there are distinct trends emerging from the findings. When intelligence is conceived as a collection of multiple cognitive abilities, reports indicate that there are some cognitive domains where, on average, females excel and others where males excel. While a considerable amount has been learned about intelligence in recent years, surprisingly little has changed in terms of the overall conclusions drawn from
the beginning of last century.
“The chief ascertainable differences appear to be the following: boys are better at arithmetic, mathematics, physical sciences, classical languages, geography, and drawing; girls are better at reading, spelling, handwriting, English composition, English literature, and possibly history, modern languages, and biological sciences” (p. 658, Nature, 1923).
On tasks of visuospatial ability, such as mental rotation3, large differences have been consistently found favouring males (Linn & Petersen, 1985; Moè, 2009; Voyer, Voyer, & Bryden, 1995). On some tasks of verbal abilities, such as verbal fluency (e.g., a task of naming words that begin with a given letter in a given period of time) and synonym generation, females are found to outperform males (Hines, 1990; Hyde & Linn, 1988). Further, females are found to excel on a number of verbal measures such as reading comprehension and spelling (Hedges & Nowell, 1995), and tend to score higher on tests of literature and composition (Stanley, 1993).
When intelligence is considered as a general construct, commonly referred to as g, the existence of differences between the sexes continues. Many would conclude that males are the more intelligent sex overall (Abad, Colom, Rebollo, & Escorial, 2004; Jackson & Rushton, 2006; Lynn, 1998; 2002; Lynn & Irwing, 2004; Vigneau & Bors, 2008)
Some suggest that the different rates of physical and cognitive maturation of males and females influence the emergence of sex differences, resulting in a female advantage before 15 years of age and a male advantage afterwards (Lynn, 1994). Others would conclude that there are no meaningful sex differences in mean scores of general intelligence. Any differences that have been found tend to be considered “small and virtually non-existent (Brody, 1992; Colom & García-López, 2002; Halpern, 2000; Jensen, 1998; Mackintosh, 1996; Rushton & Cvorovic, 2009). For
3
Mental rotation – the ability to rotate stimuli rapidly and accurately within the mind (p. 12, Hines, 2005).
others still, sex differences have been demonstrated in variability of scores if not in average IQ (Deary, Thorpe, Wilson, Starr, & Whalley, 2003; Hedges & Nowell, 1995; Irwing & Lynn, 2005).
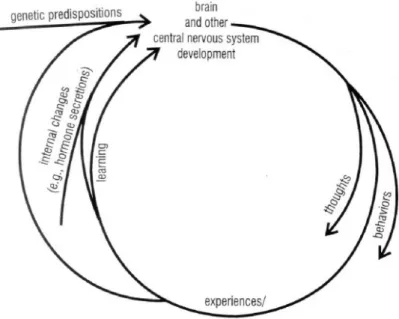
Reasons for the noted sex differences in multiple abilities of intelligence and g alike have been explained by a number of different factors: biological (such as anatomical differences, genes and hormones) environmental (such as social influence and improved nutrition), or a combination of factors as suggested in Halpern’s biopsychosocial theory (In Press). Some would argue that the differences reported in the literature are not, in fact, differences at all but rather psychometric artefacts arising from statistical irregularities such as item bias and differential item functioning (van der Sluis et al., 2008; Wicherts, Borsboom, & Dolan, 2010).
These will each be discussed in turn through a comprehensive review of the sex differences literature with special consideration for the unidimensional perspective of intelligence and the Raven’s Standard Progressive Matrices (SPM; Raven, Court, & Raven, 2008).In so doing, the literature underlying the aims of this dissertation will be reviewed. The first aim of this dissertation is to determine whether the SPM+ is measuring the construct of general intelligence in the same way for both males and females. That is to say, is the SPM+ free from item bias, ensuring a fair assessment for both sexes? The second aim of the dissertation is to determine whether there is a significant sex difference in the mean and variability of scores in the overall sample of the SPM+. Due to the large age range of participants of the standardisation sample, it is also important to consider whether an overall evaluation of sex differences are masking the emergence of developmentally-related sex differences in general intelligence. This forms the third aim of this dissertation. The final aim of this dissertation is to determine whether extraneous elements inherent in the items, or method effects, are affecting performance on the SPM+.
2.2. W
HY STUD Y SE X DIFFERE NC ES?
In all areas of research in intelligence, there exists controversy about the way that research is conducted, how the results are interpreted, and the significance of the results from both theoretical and practical perspectives. For research in sex differences in intelligence, there is an additional
controversy of whether the research ought to be conducted at all (Halpern, n d)). What is particularly interesting is that much of the controversy stems not from the discovery of differences themselves but from the explanations used to understand the findings. These, according to Cianciolo and Sternberg (2004) are not always based upon empirical data, but upon predetermined agenda. Some fear that the results of studying sex differences will be interpreted and used in such a way to support a misogynist objective and oppress women or to reaffirm ‘traditional’ roles for males and females in society.
While the potential reasons for not studying sex differences raise valid concerns, there are many more reasons why the study of the differences between males and females ought to continue. Investigations of sex differences in cognitive ability provide valuable insight into a number of areas that are deemed socially important, not only those directly associated with scores on intelligence tests and academic achievement.
Societal inequalities continue to prove detrimental for females in Britain and around the world. It is well documented that females are less likely to enter into certain careers (such as science, technology, engineering or maths; Eccles, 1994) or into senior and executive positions within business and academia (Niederle & Vesterlund, 2007). Seemingly associated with this, there continues to be a significant wage gap between males and females, particularly in legal, healthcare and technical occupations. For 2009, the median weekly pay for full-time male employees was £531 per week, while for females it was £426. Although the wage gap narrowed by 0.4% compared to 2008, there still remains a 12.2% gap in the amount of money males and females are being paid for equivalent positions of employment (National Statistics, 2009). Presuming that individuals in similar occupations have obtained similar levels of education and possess similar levels of intellectual ability, such figures suggest evidence of discrimination and bias against females.
When discussing classroom-based differences between males and females, it is the assessment of student achievement that is the focus. Tests of achievement aim to measure the amount of knowledge an individual possesses in a particular academically-based subject area (like reading or maths). Although inextricably related, it is qualitatively different to the
assessment of ability. Tests of ability aim to measure an individual’s proficiency in a particular domain (such as verbal fluency or spatial rotation). These underlying abilities, or latent constructs, are relatively abstract constructs, and can prove quite difficult to effectively quantify and measure.
There are many reports in the intelligence literature that document one group excelling over the other group; in the achievement literature, girls tend to outperform boys, while in the ability literature, males are often cited as outperforming females. Achievement is directly related to the education one receives in school, and is inherently entwined with ability. In practical terms, it is difficult to devise a test of ability that does not also measure an element of achievement. It is, therefore, not surprising that intelligence scores correlate very highly with school achievement and with the number of years of an education an individual will complete (Deary, Strand, Smith, & Fernandes, 2007; Mackintosh, 2001). Because it is virtually impossible to isolate ability and achievement as independent constructs, it is important to be cautious in interpretations of reports of sex differences in accordance with the measurement approach taken.
Performance differences between boys and girls in the classroom have been noted worldwide. In the UK, recent reports from the 2010 National Curriculum results for Key Stages 24 show that girls perform better than boys in reading and writing. It is also noted that the performance of girls has improved in mathematics and is now equivalent to boys for the first time since 2004 (Department for Education, 2010).
A similar picture emerges from the recent GCSE results published in August 2010. 72.6% of females and 65.4% of males received passing grades of A* to C. This has prompted discussion over whether different versions of the tests are needed in order to capitalise on the perceived strengths of male and female students. The Assessment and Qualifications Alliance claims that assessments such as this would allow for greater flexibility in order to match the specific needs and differences of boys and
4
Reports are for children who are 11 years of age. Reports showing female advantage are also available for children of Key Stage 1 (age 7 years) and Key Stage 3 (aged 14 years) but they incorporate a teacher assessment. Teacher assessments may be influenced by extraneous variables, and therefore not deemed appropriate for the current discussion.
girls, and may be ready as early as September 2011(Collins, 2010).
Results such as these are often sensationalised in the media leading to claims that either one group or the other is being disadvantaged by the current education system. For many years, research claimed that schools and teachers were biased against girls, and that this has contributed to their underachievement relative to males in such domains as maths and sciences (American Association Of University Women, 1993). However, there has been a shift of perspective in recent years. Research findings are now pointing towards what the media is now referring to as a “boy crisis” (Gurian & Stevens, 2005) and the “New Gender Gap” (Conlin, 2003). “There is a rather alarming crisis in our society that’s been developing for years...Too many of our boys and young men are falling behind in school and life...Something has gone wrong in the way we educate our boys” (p. 28, Gurian & Stevens, 2005). But whether the differing performance of boys and girls ought to be viewed as a “crisis” is open for interpretation.
Such differences in achievement and ability need not automatically mean that one of the groups is inferior. Neisser et al., (1996) suggest that investigations into sex differences and their results need not be cause for concern but are opportunities for greater understanding of intelligence as a whole. Despite being an opportunity for greater understanding, very little in the literature discusses sex similarities in intelligence or the non-significant findings. Some would suggest that a “file-drawer” problem is occurring (Blinkhorn, 2005). An argument could be made that in discussing differences it would also be prudent and constructive to discuss similarities as well. Hyde (2005; 2007) advocates for the gender similarities hypothesis, suggesting that males and females are much more similar than they are different. She indicates that empirical findings of similarities ought to take a more prominent place in the literature. The gender similarities hypothesis will be discussed further in section 2.4.1.
Although not directly related, the benefits of studying group differences in intelligence can be evidenced by one of the most intriguing phenomena in psychology, the Flynn effect (as discussed in Section 1.3.4.). It was only through the study of differences in IQ scores over time that it was concluded by Flynn that each successive generation is more intelligent than the last. Having a greater understanding of the nuances of intelligence and